



Content
U.S. crypto ETF demand split sharply this week.

Spot Bitcoin funds recorded a net outflow of $140.8 million across the five completed U.S. trading sessions from July 9 through July 15. Spot Ether funds moved in the opposite direction, attracting $63.0 million.
The combined BTC and ETH market therefore lost $77.8 million. That headline understates the reversal beneath it.
A $440.1 million combined outflow on July 13 was followed by $401.0 million of inflows over the next two sessions. Roughly 91% of the July 13 withdrawal was recovered before the reporting cutoff, but the distribution of that capital was uneven. Bitcoin demand remained highly dependent on BlackRock, while Ether’s positive week was almost entirely carried by one BlackRock product.
July 16 flows were not available at the report cutoff. All weekly calculations use the five completed sessions through July 15.
Weekly ETF Flow Scorecard
| Metric | Bitcoin ETFs | Ether ETFs | Combined Market |
|---|---|---|---|
| Net Flow, July 9–15 | -$140.8M | +$63.0M | -$77.8M |
| Positive Sessions | 3 Of 5 | 3 Of 5 | — |
| Largest Daily Inflow | +$181.1M | +$58.3M | +$239.4M |
| Largest Daily Outflow | -$424.7M | -$52.2M | -$440.1M |
| Final Two Sessions | +$288.8M | +$112.2M | +$401.0M |
| Average Daily Flow | -$28.2M | +$12.6M | -$15.6M |
| Cumulative Net Inflow Since Launch | $51.19B | $11.10B | $62.29B |
Bitcoin remains the dominant regulated crypto allocation vehicle, with cumulative net inflows more than 4.6 times larger than Ether’s total. The weekly direction, however, favored ETH.
Farside’s displayed long-run daily averages stand at approximately $81.5 million for Bitcoin funds and $22.4 million for Ether funds. Bitcoin’s negative $28.2 million average this week represented a clear break from its historical flow profile. Ether stayed positive, but its $12.6 million daily average remained below its longer-run pace.
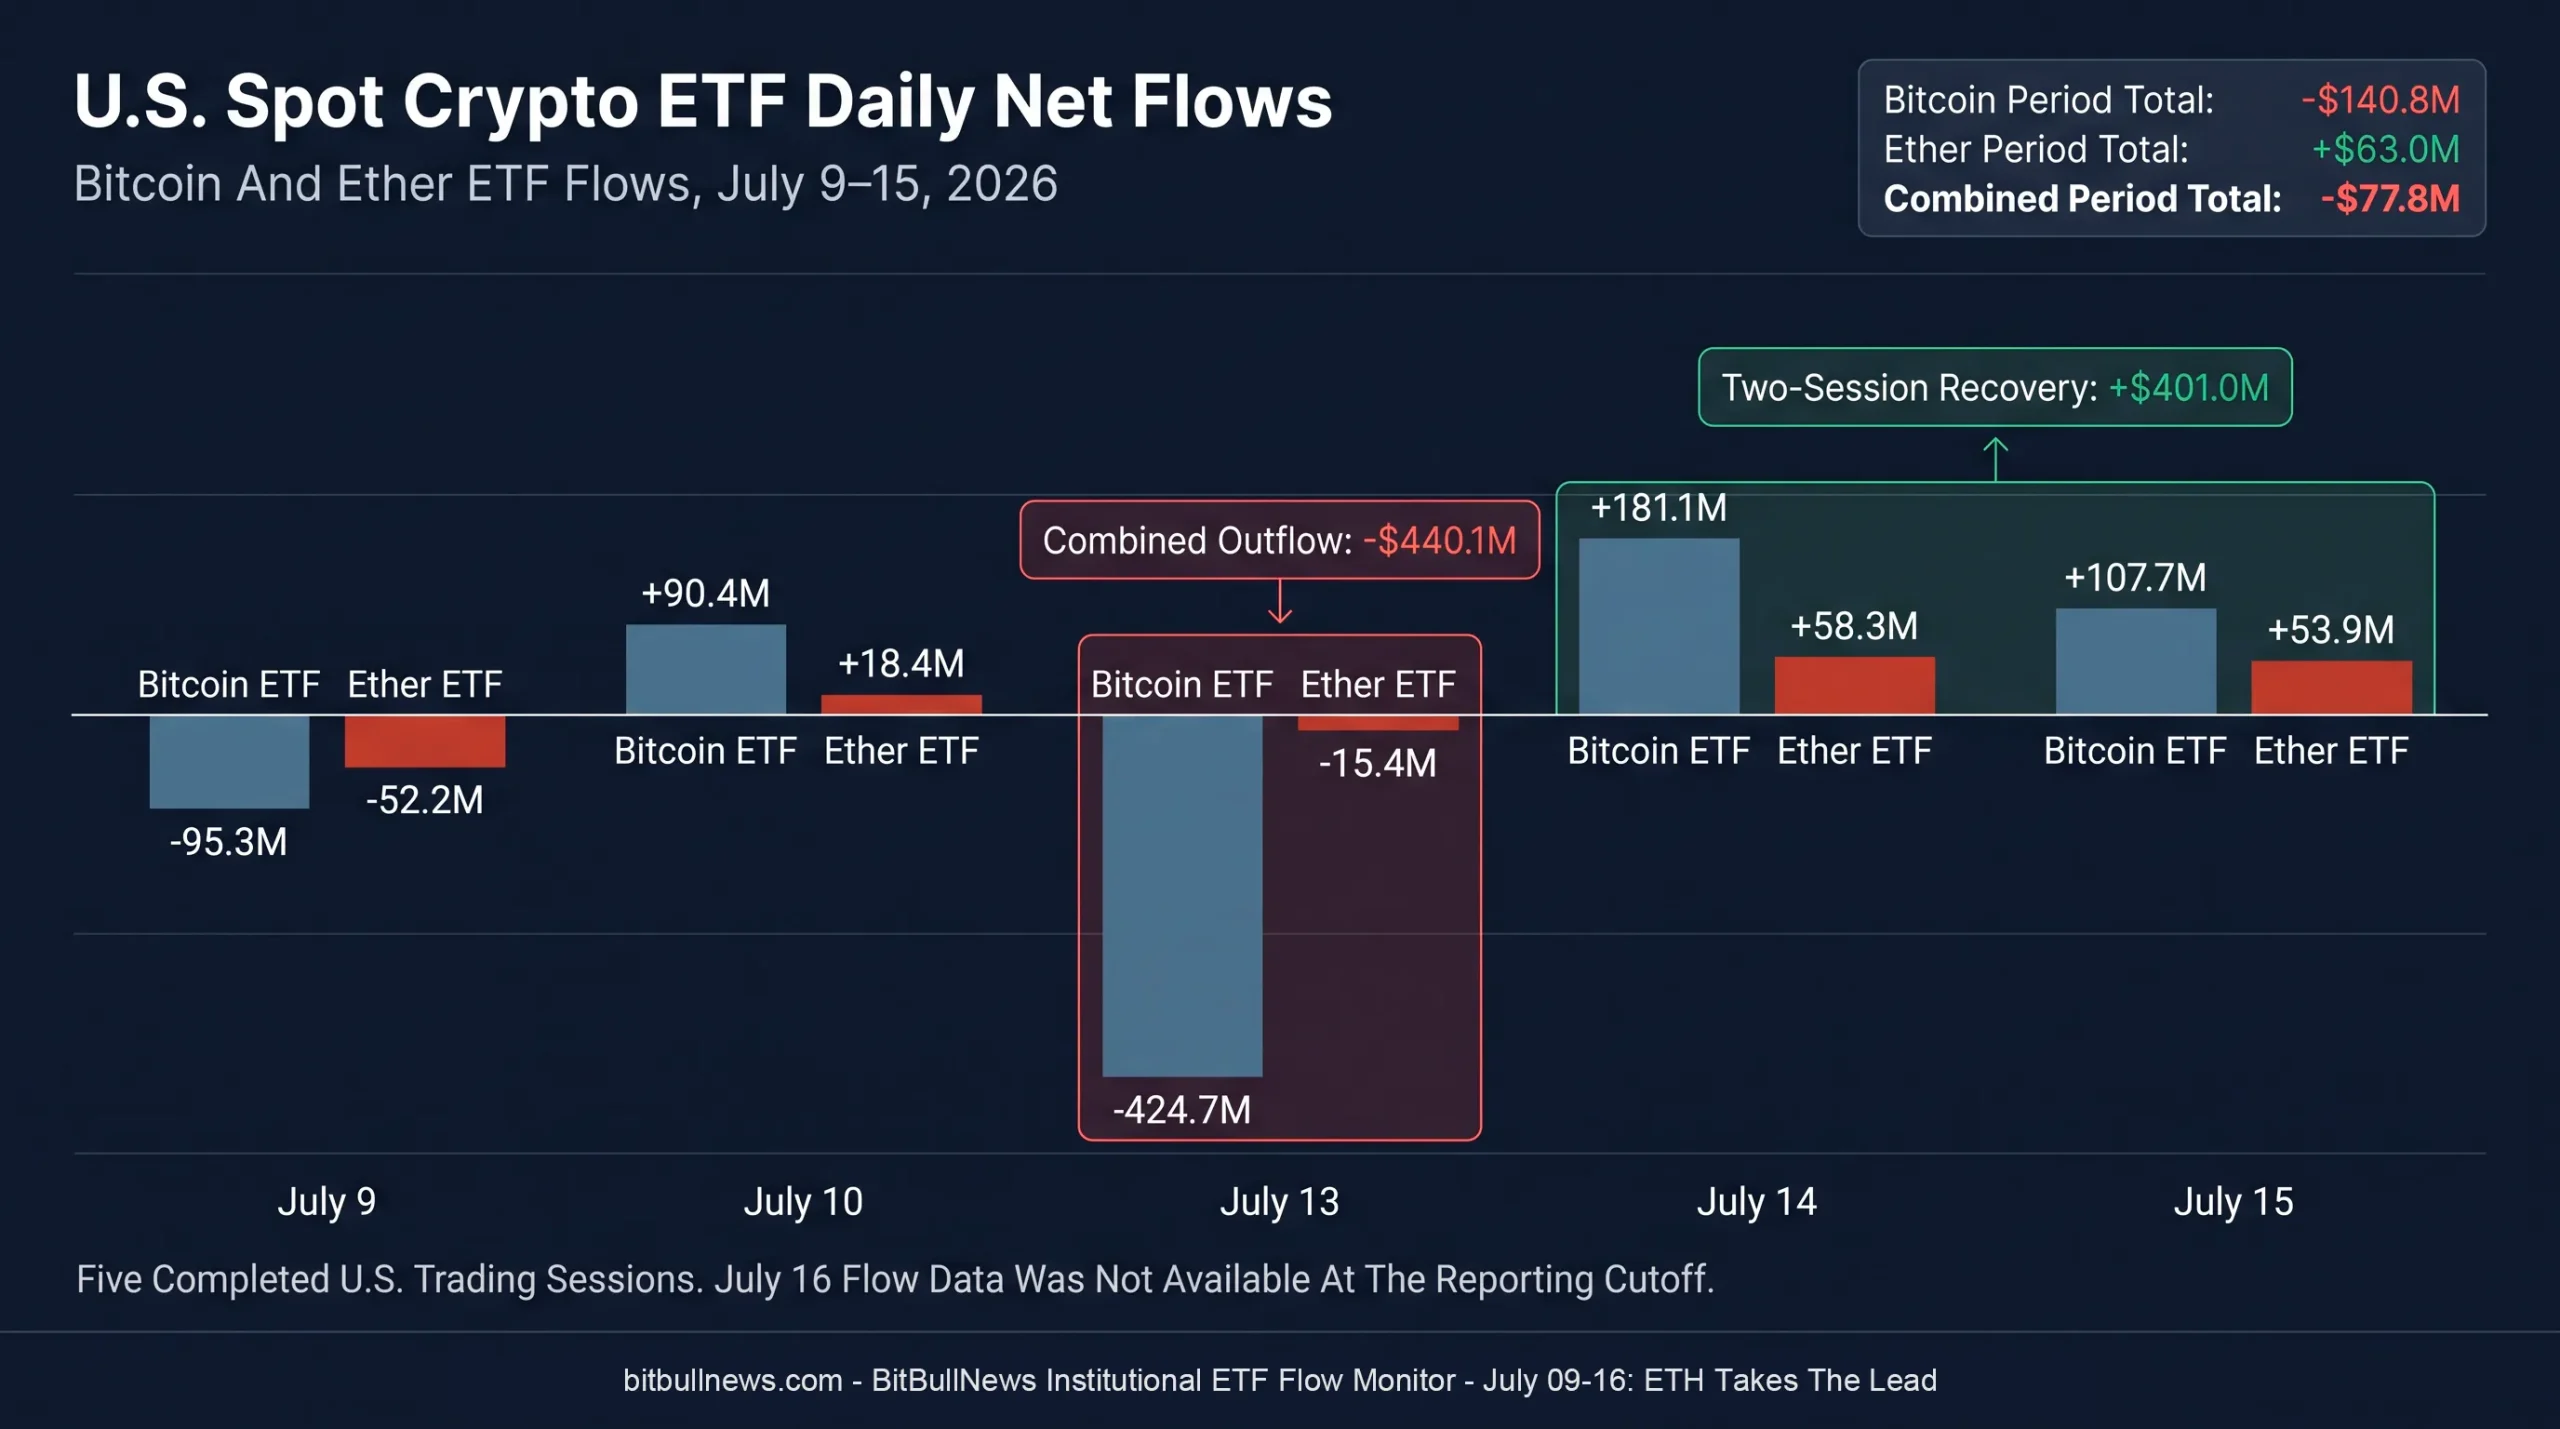
Grouped Daily Bar Chart Showing U.S. Spot Bitcoin And Ether ETF Net Flows From July 9 Through July 15, 2026. Use Separate Bars For BTC And ETH. Highlight The Combined $440.1M Outflow On July 13 And The $401.0M Recovery Across July 14–15.
One Redemption Wave Defined Bitcoin’s Week
Bitcoin ETF flows were positive on three of the five sessions, but the size of the July 13 outflow overwhelmed the surrounding inflows.
| Trading Date | Bitcoin ETF Flow | Ether ETF Flow | Combined Flow |
|---|---|---|---|
| July 9 | -$95.3M | -$52.2M | -$147.5M |
| July 10 | +$90.4M | +$18.4M | +$108.8M |
| July 13 | -$424.7M | -$15.4M | -$440.1M |
| July 14 | +$181.1M | +$58.3M | +$239.4M |
| July 15 | +$107.7M | +$53.9M | +$161.6M |
| Period Total | -$140.8M | +$63.0M | -$77.8M |
The July 13 Bitcoin withdrawal was not a broad, evenly distributed exit across the entire ETF complex. Fidelity’s FBTC lost $245.6 million, BlackRock’s IBIT lost $185.5 million and Grayscale’s GBTC lost $53.1 million. Inflows into the Grayscale Bitcoin Mini Trust and VanEck’s HODL partially offset those redemptions.
The next two sessions reversed much of the damage. IBIT collected $138.9 million on July 14 and another $80.8 million on July 15. FBTC added $38.0 million across those sessions, while the Grayscale Bitcoin Mini Trust drew $16.6 million.
The result was a fast recovery, but not a complete one.
Bitcoin funds needed only two sessions to recover 68% of the July 13 outflow. That is a constructive signal for liquidity, though it does not qualify as a sustained allocation trend. The complex still ended the monitoring period in net redemption.
Fidelity Was The Main Source Of Bitcoin Weakness
The issuer breakdown changes the interpretation of Bitcoin’s negative week.
| Bitcoin Fund | Issuer | Net Flow, July 9–15 |
|---|---|---|
| IBIT | BlackRock | +$121.0M |
| BTC | Grayscale Bitcoin Mini Trust | +$70.0M |
| HODL | VanEck | +$15.1M |
| MSBT | Morgan Stanley | +$9.6M |
| BITB | Bitwise | +$3.8M |
| BTCO | Invesco | $0.0M |
| EZBC | Franklin Templeton | $0.0M |
| BRRR | Valkyrie | $0.0M |
| BTCW | WisdomTree | $0.0M |
| ARKB | 21Shares | -$36.3M |
| GBTC | Grayscale | -$53.1M |
| FBTC | Fidelity | -$270.9M |
| Total | — | -$140.8M |
Without FBTC, the rest of the Bitcoin ETF complex would have recorded a net inflow of approximately $130.1 million.
That does not make Fidelity’s redemptions irrelevant. It does show that the weekly headline was driven by issuer-specific allocation behavior rather than a uniform rejection of Bitcoin exposure.
There are several possible explanations for concentrated fund-level redemptions: portfolio rebalancing, tax management, advisor-platform activity or a shift between competing wrappers. Public flow data does not disclose the underlying investor or motive, so those explanations cannot be confirmed from creations and redemptions alone.
The cleanest conclusion is narrower: demand for Bitcoin exposure remained present, but it was not broad enough to absorb the week’s large FBTC withdrawals.
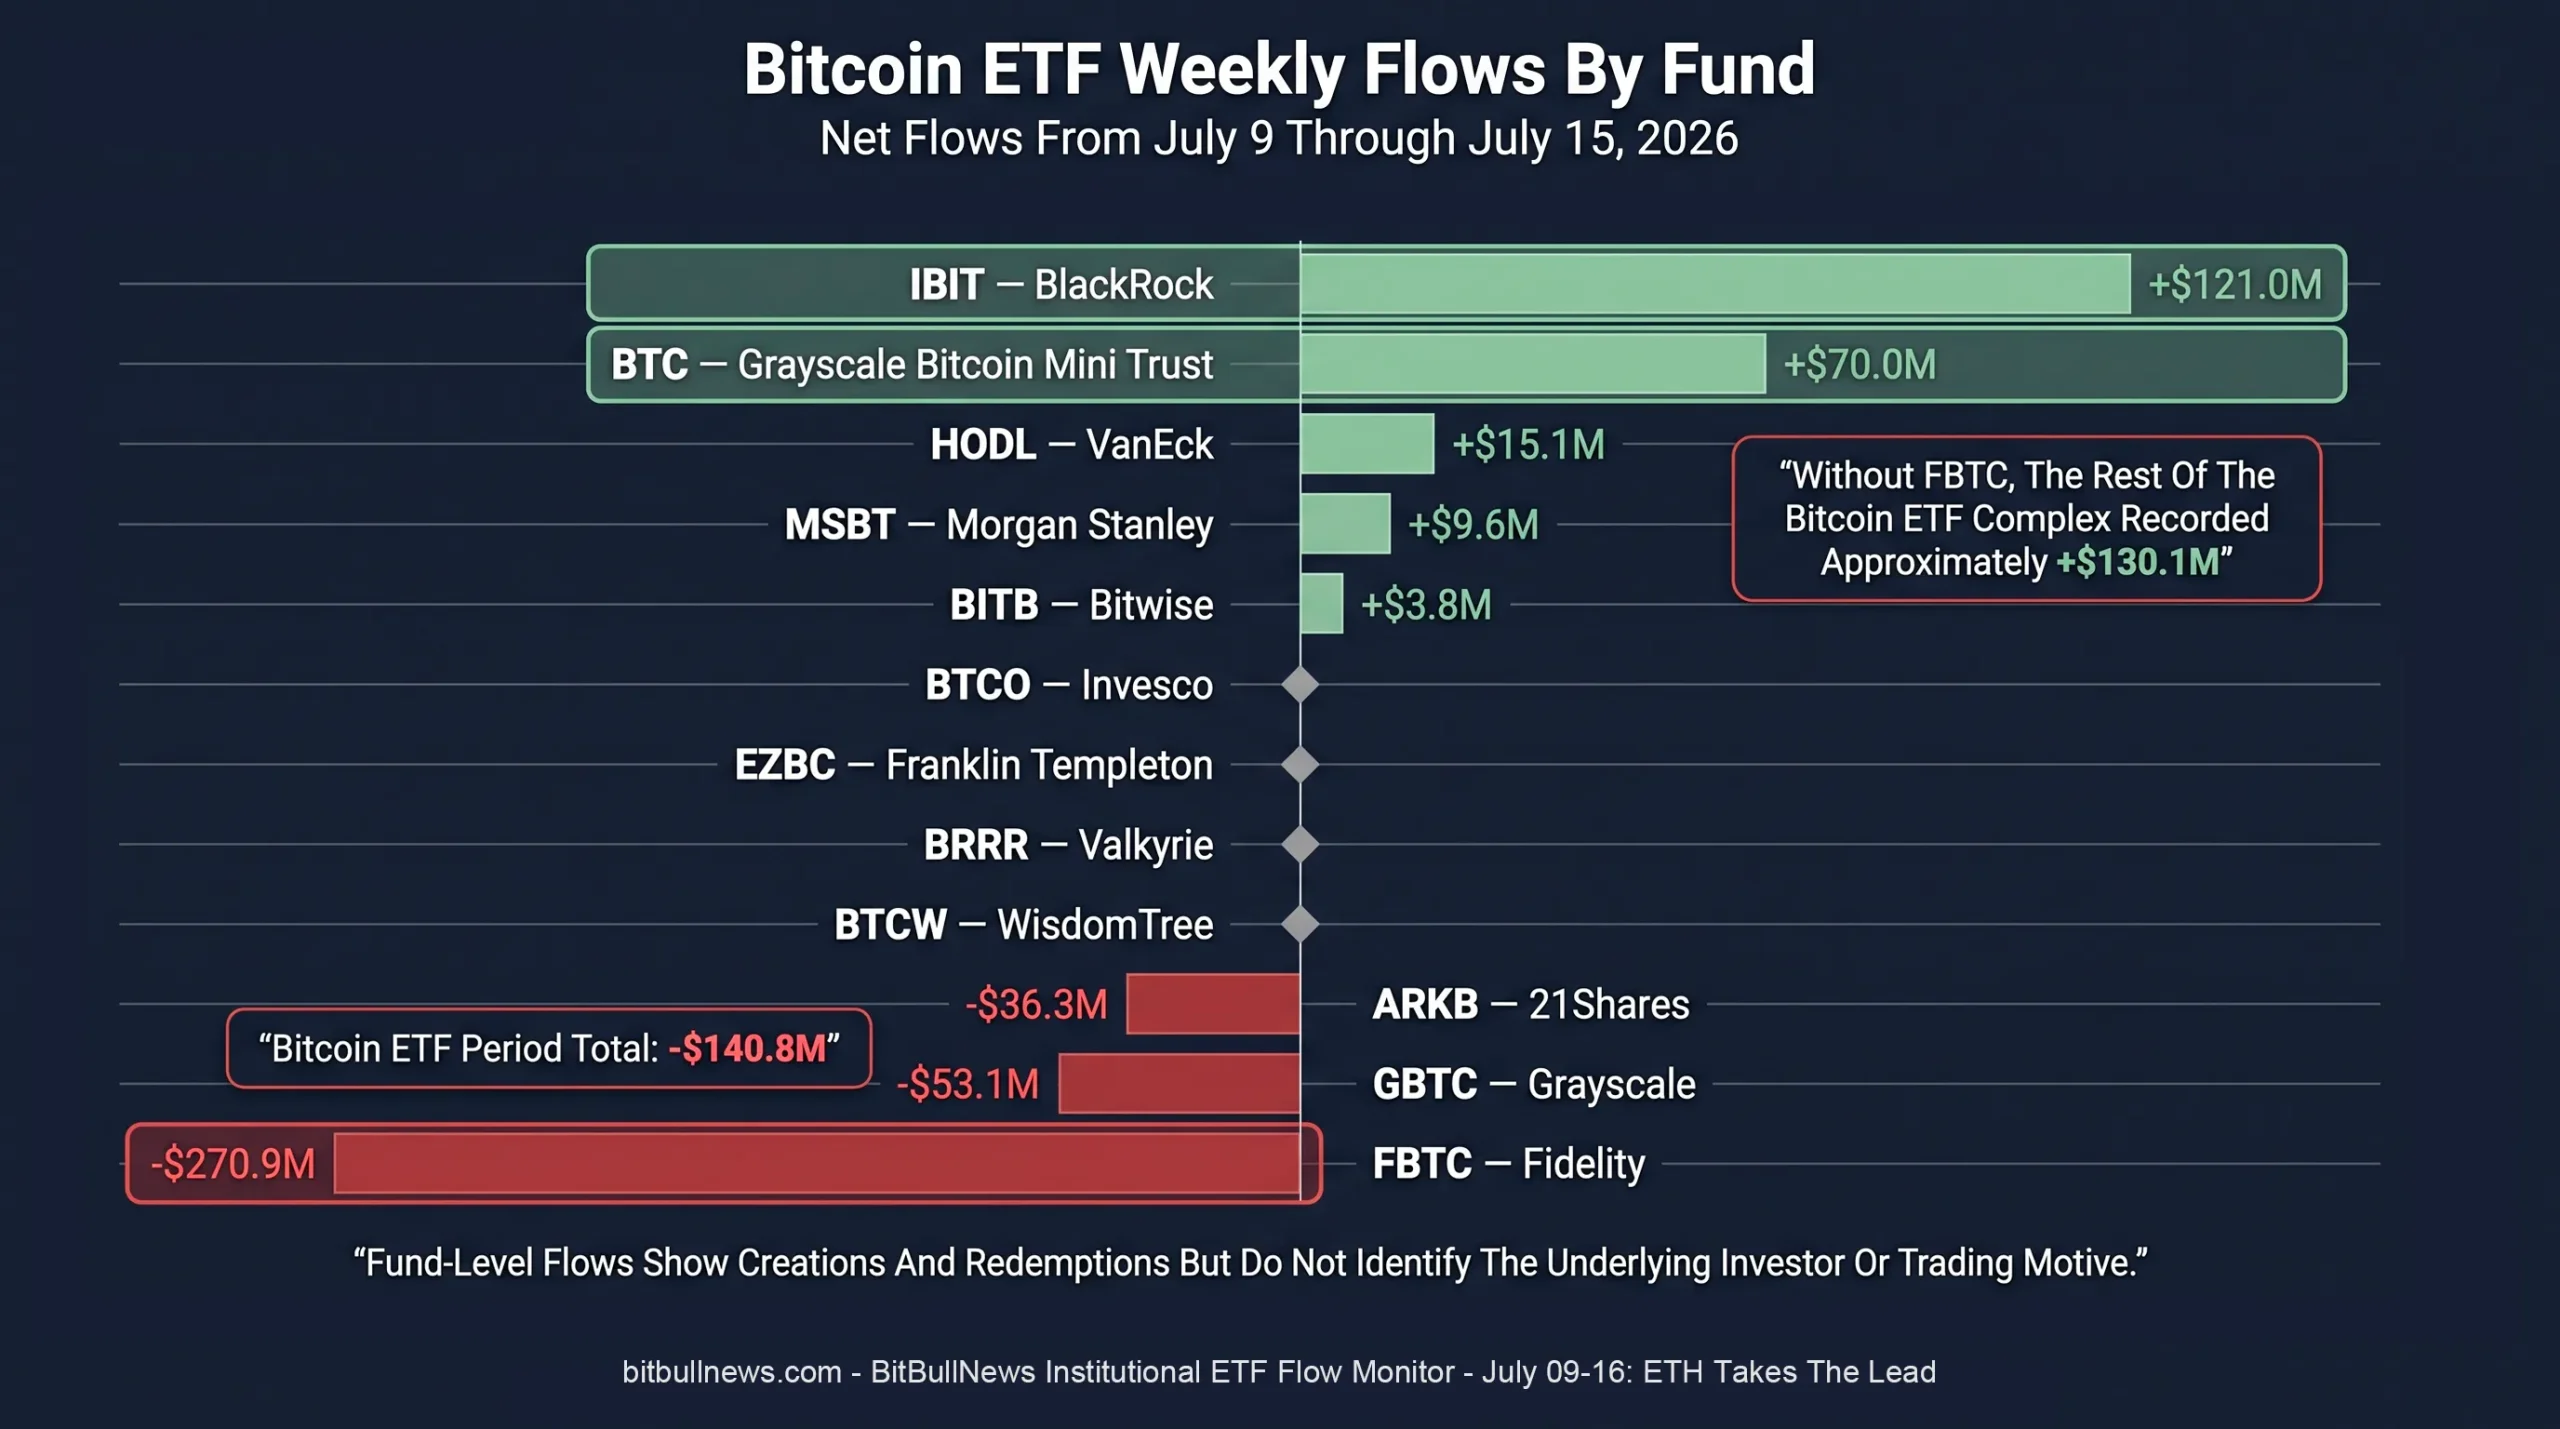
Horizontal Diverging Bar Chart Showing Net Bitcoin ETF Flows By Issuer From July 9 Through July 15. Highlight FBTC At -$270.9M, IBIT At +$121.0M And The Grayscale Bitcoin Mini Trust At +$70.0M.
Ether Delivered The Cleaner Flow Signal
Ether funds also recorded three positive and two negative sessions. Unlike Bitcoin, their strongest inflows were sufficient to produce a positive weekly result.
ETH ETFs collected $112.2 million across July 14 and July 15. That more than offset the $67.6 million withdrawn over July 9 and July 13, as well as the limited activity elsewhere in the period.
The price response was stronger too.
The Coin Metrics Ethereum benchmark advanced from $1,790.68 at the July 9 New York close to $1,923.88 at the latest July 15 close, a gain of approximately 7.44%. Bitcoin rose from $63,871.14 to $64,883.19 over the same interval, gaining about 1.58%. ETH therefore outperformed BTC by roughly 5.85 percentage points.
That alignment matters:
- ETH price increased.
- ETH ETF flows were positive.
- ETH outperformed BTC.
- ETH’s largest inflow sessions occurred late in the week rather than at the beginning.
Bitcoin showed a weaker alignment. Its price rose despite a negative ETF flow total, suggesting that other sources of demand — spot trading outside U.S. ETFs, derivatives positioning or short covering — contributed more heavily to the move. That is an inference from the flow and price divergence, not proof of a specific buyer group.
BlackRock Carried The Ether Complex
The positive Ether result was highly concentrated.
| Ether Fund | Issuer | Net Flow, July 9–15 |
|---|---|---|
| ETHA | BlackRock | +$107.1M |
| ETH | Grayscale Ethereum Mini Trust | +$4.6M |
| ETHB | BlackRock Staked Ethereum Trust | +$1.3M |
| TETH | 21Shares | $0.0M |
| ETHV | VanEck | $0.0M |
| QETH | Invesco | $0.0M |
| EZET | Franklin Templeton | $0.0M |
| ETHE | Grayscale | $0.0M |
| ETHW | Bitwise | -$2.8M |
| FETH | Fidelity | -$47.2M |
| Total | — | +$63.0M |
BlackRock’s two Ether products generated a combined $108.4 million of net inflows. That was greater than the entire market’s $63.0 million total because Fidelity and Bitwise recorded offsetting redemptions.
ETHA alone produced 170% of the complex’s net weekly inflow.
This is positive for BlackRock’s franchise, but it weakens the breadth of the overall ETH signal. A durable institutional rotation into Ether would normally become more convincing if several issuers began attracting capital simultaneously.
For now, the data shows strong demand for ETH exposure through the market-leading BlackRock wrapper, not an industry-wide surge across every product.
Staking Has Not Yet Become The Main Allocation Driver
The presence of BlackRock’s staked Ether product adds a new layer to the flow analysis.
ETHB seeks to provide exposure to Ether while capturing rewards from staking a portion of the trust’s assets. BlackRock reported net assets of $549.4 million as of July 15, compared with $5.38 billion in the conventional ETHA product. ETHB’s standard sponsor fee is 0.25%, with a temporary waiver reducing the fee on qualifying assets during the initial waiver period.
Despite that differentiated structure, ETHB gained only $1.3 million during the monitoring period. ETHA attracted $107.1 million.
That split suggests allocators still prioritized the larger and more liquid conventional product over the staking wrapper this week. The result should not be read as a rejection of staking. ETHB is newer, smaller and carries additional operational considerations, including validator activation and withdrawal queues, staking liquidity constraints and the risk that rewards may not be realized. BlackRock lists those risks in the product documentation.
The key metric in future reports will be the share of BlackRock Ether flows captured by ETHB. A sustained increase would indicate that institutional investors are moving beyond simple price exposure and beginning to treat staking yield as part of the investment case.
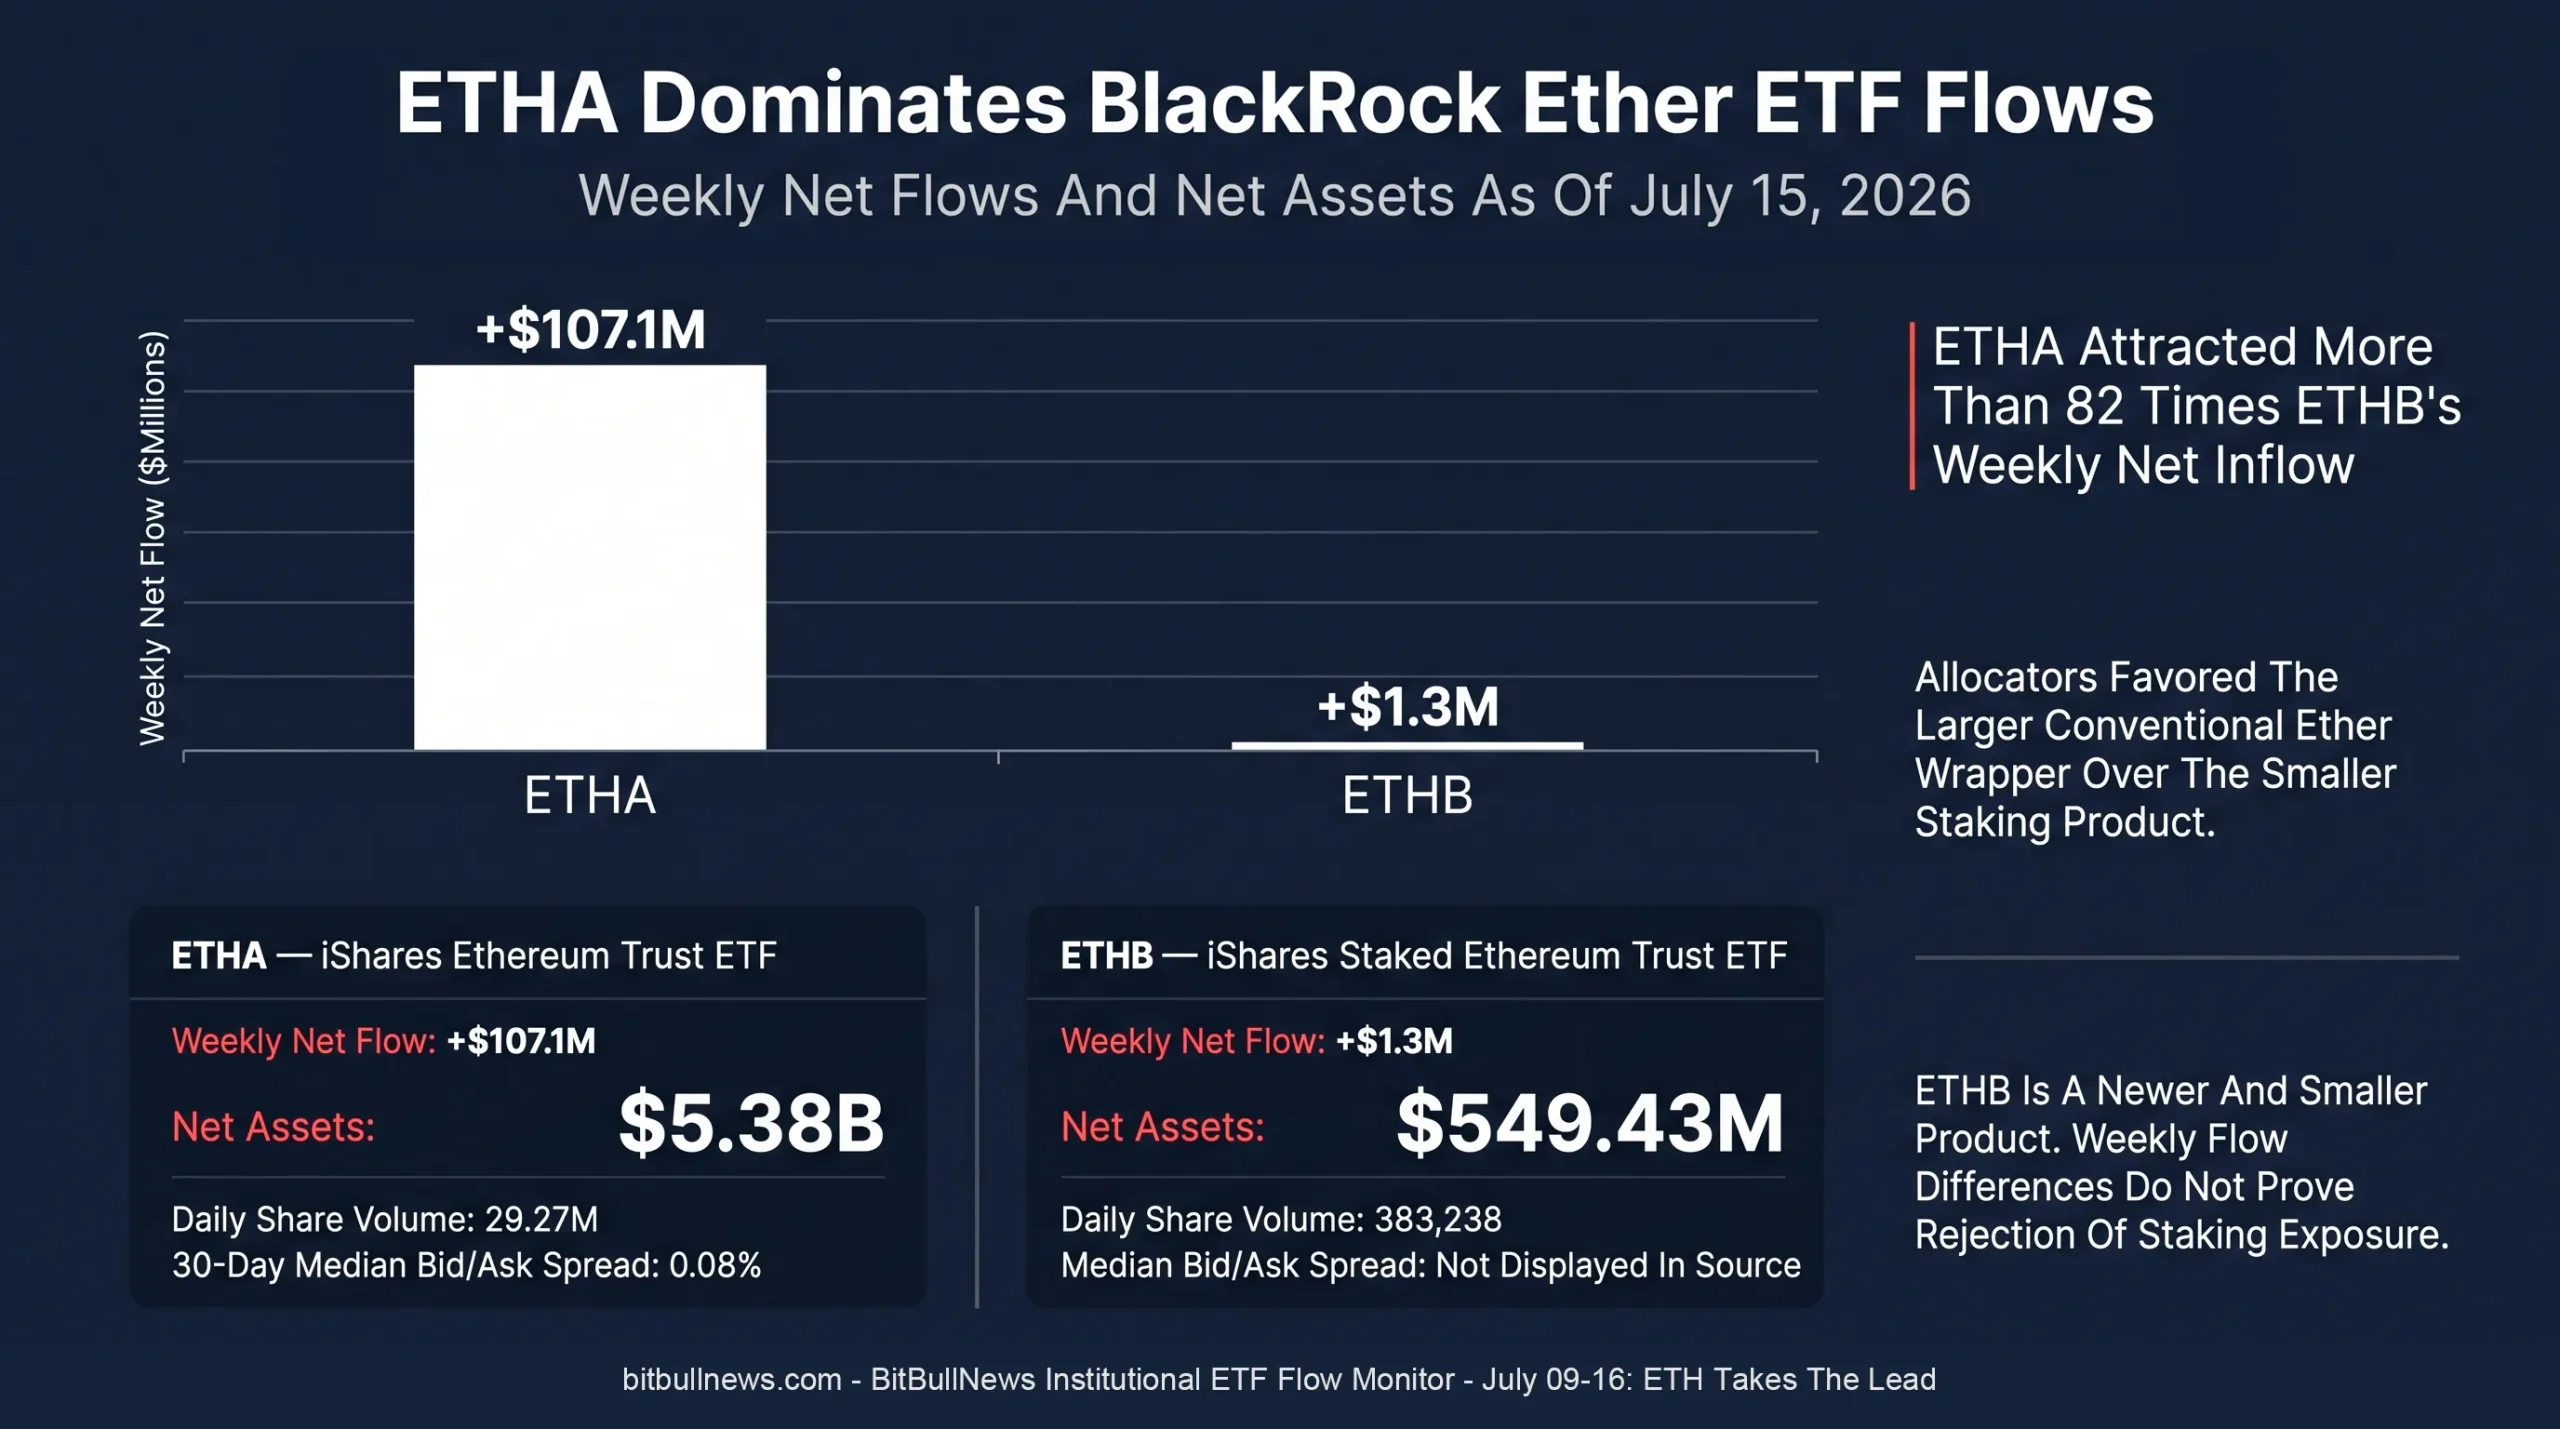
Grouped Bar Chart Comparing Weekly Net Flows Into BlackRock’s ETHA And ETHB. Show ETHA At +$107.1M And ETHB At +$1.3M. Add Official Net Assets Of $5.38B For ETHA And $549.4M For ETHB As Separate Callouts.
The Macro Trigger Arrived Late In The Period
The strongest ETF inflows appeared after the June U.S. inflation report.
The Bureau of Labor Statistics reported that headline CPI fell 0.4% on a seasonally adjusted monthly basis in June, while the annual rate slowed to 3.5% from 4.2% in May. Core CPI was unchanged during the month and increased 2.6% over 12 months. Energy prices fell 5.7%, providing the largest contribution to the monthly decline.
On July 14, the first ETF session after the release:
- Bitcoin funds attracted $181.1 million.
- Ether funds attracted $58.3 million.
- Combined inflows reached $239.4 million.
Another $161.6 million entered the two markets on July 15.
The timing is consistent with lower inflation pressure improving demand for risk assets, but the flow data does not establish direct causality. ETF orders can reflect decisions made before the official flow date, and authorized participants may hedge creations and redemptions through spot or derivatives markets.
Still, the sequence was notable. The week’s largest Bitcoin inflow and largest Ether inflow both occurred immediately after the inflation release.
Product Liquidity Still Favors Bitcoin
BlackRock’s official fund data shows the size gap between the largest Bitcoin and Ether wrappers.
| Product | Underlying Exposure | Net Assets, July 15 | Daily Share Volume | 30-Day Median Bid/Ask Spread |
|---|---|---|---|---|
| IBIT | Bitcoin | $47.57B | 34.11M | 0.03% |
| ETHA | Ether | $5.38B | 29.27M | 0.08% |
| ETHB | Staked Ether | $549.43M | 383,238 | Not Displayed In Source |
IBIT’s net assets were almost nine times larger than ETHA’s. Its median spread was also tighter, reinforcing Bitcoin’s position as the most efficient large-scale institutional crypto wrapper.
ETHA’s trading volume was substantial, but its 0.08% median spread remained wider than IBIT’s 0.03%. That difference matters for large orders, systematic allocation programs and funds that rebalance frequently.
ETHB remains much smaller. Its daily volume of approximately 383,000 shares was below its 30-day average of roughly 438,000 shares on July 15. The product has enough scale to be relevant, but it does not yet offer the same execution profile as ETHA or IBIT.
ETF Flows Are Not A Pure Institutional Census
The term “institutional ETF flow” requires a caveat.
Creations and redemptions are processed by authorized participants, but the investors buying and selling ETF shares can include institutions, financial advisers and retail brokerage clients. BlackRock’s documents confirm that ordinary investors may trade the shares on the secondary market, while only authorized participants can create or redeem large baskets directly with the trust.
ETF flows are therefore best understood as regulated-wrapper demand.
They provide a cleaner signal than exchange volume because net creations require actual expansion or contraction of the fund structure. They do not identify the end investor, reveal the purpose of the trade or distinguish a long-term allocation from a short-term tactical position.
This week’s data is most useful for measuring where regulated capital moved, not for claiming that every dollar represented a new institutional conviction trade.
What Allocators Should Watch Next
Bitcoin Needs Broader Issuer Participation
IBIT returned to inflows and finished the week positive, but the broader market remained vulnerable to redemptions from a single large competitor.
A healthier Bitcoin flow structure would include simultaneous inflows into IBIT, FBTC, BITB and the lower-fee Grayscale product. That would show demand broadening across adviser platforms and allocation channels.
Ether Must Move Beyond ETHA
ETH’s positive week was real, but it was concentrated.
Continued ETHA inflows would remain constructive. A stronger confirmation would come from FETH returning to positive territory and ETHB capturing a larger share of new capital.
The Final Two Sessions Need Follow-Through
The $401.0 million combined inflow across July 14–15 nearly erased the July 13 shock.
The next question is whether that rebound marks the start of a multi-session allocation run or only a reaction to the inflation release. One or two additional positive sessions would materially improve the weekly structure.
Price And Flow Alignment Matters
ETH had positive flows and stronger relative performance. Bitcoin rose despite net redemptions.
For tactical investors, the ETH signal was cleaner. For long-term allocators, Bitcoin still offered greater product scale, tighter spreads and a much larger cumulative capital base.
Watch The ETHA–ETHB Split
The relative demand for unstaked and staked Ether exposure could become one of the most informative institutional indicators in the second half of 2026.
A rising ETHB share would show that allocators increasingly value native yield. Continued ETHA dominance would suggest that liquidity, simplicity and execution remain more important than staking income.
Institutional ETF Risk Dashboard
| Signal | Current Reading | Interpretation | Confirmation Needed |
|---|---|---|---|
| Bitcoin Weekly Flow | -$140.8M | Net redemption despite late recovery | Broad multi-issuer inflows |
| Ether Weekly Flow | +$63.0M | Positive regulated demand | Participation beyond BlackRock |
| BTC Price–Flow Relationship | Price Up, Flows Negative | Rally supported by non-ETF channels | ETF flows turn positive |
| ETH Price–Flow Relationship | Price Up, Flows Positive | Cleaner directional alignment | Continued inflow streak |
| Bitcoin Issuer Concentration | FBTC Drove Most Outflows | Headline distorted by one fund | FBTC stabilization |
| Ether Issuer Concentration | ETHA Drove The Entire Net Gain | Demand strong but narrow | FETH and ETHB participation |
| Macro Sensitivity | Inflows Returned After CPI | Risk appetite improved late in week | Follow-through beyond the event |
| Product Liquidity | IBIT Remains Dominant | BTC retains execution advantage | ETH spreads continue tightening |
Concentration, Not Conviction
Ether won the ETF flow contest this week.
Its funds attracted $63.0 million while Bitcoin products lost $140.8 million. ETH also outperformed BTC by nearly six percentage points between the July 9 and July 15 New York closes.
The result was less broad than it first appears. BlackRock’s ETHA generated more inflows than the entire Ether complex because Fidelity and Bitwise moved in the opposite direction. Bitcoin’s negative result was similarly concentrated, with FBTC accounting for $270.9 million in net redemptions.
Strip out those issuer-level distortions and the market looked more resilient. IBIT finished positive. The Grayscale Bitcoin Mini Trust attracted capital. The two largest crypto ETF categories recovered $401.0 million over the final two sessions after a severe July 13 withdrawal.
The next monitor should focus on breadth rather than the headline total.
Bitcoin needs multiple large issuers attracting capital at the same time. Ether needs demand to spread beyond ETHA. ETHB’s performance will show whether staking yield is becoming an institutional allocation feature or remains secondary to liquidity and fund scale.
For now, the regulated market is not delivering a uniform risk-on signal. It is delivering a selective one: investors returned after the inflation release, favored Ether on a relative basis and continued concentrating capital in the largest BlackRock products.
Data Sources & References
- Farside Investors — Bitcoin ETF Flows
- Farside Investors — Ethereum ETF Flows
- Coin Metrics — CMBI Bitcoin Benchmark
- Coin Metrics — CMBI Ethereum Benchmark
- U.S. Bureau Of Labor Statistics — June 2026 CPI
- BlackRock — iShares Bitcoin Trust ETF
- BlackRock — iShares Ethereum Trust ETF
- BlackRock — iShares Staked Ethereum Trust ETF