


Content
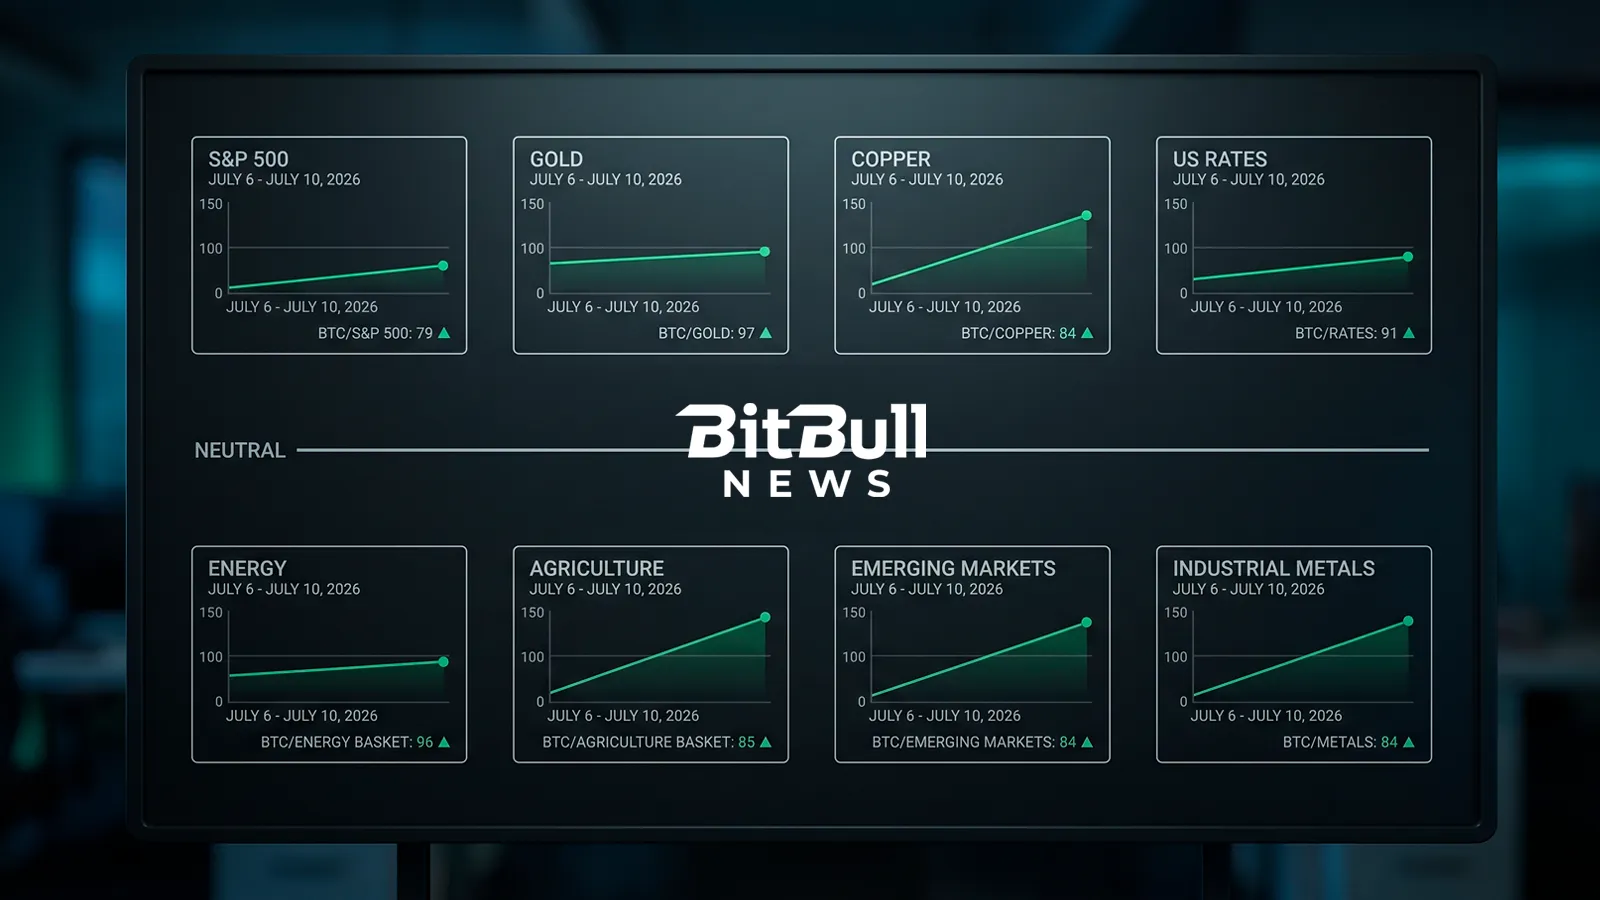
Bitcoin completed a second consecutive clean sweep across the BitBullNews benchmark family. All eight readings rose between July 6 and July 10, extending the relative recovery that began after the June sell-off.
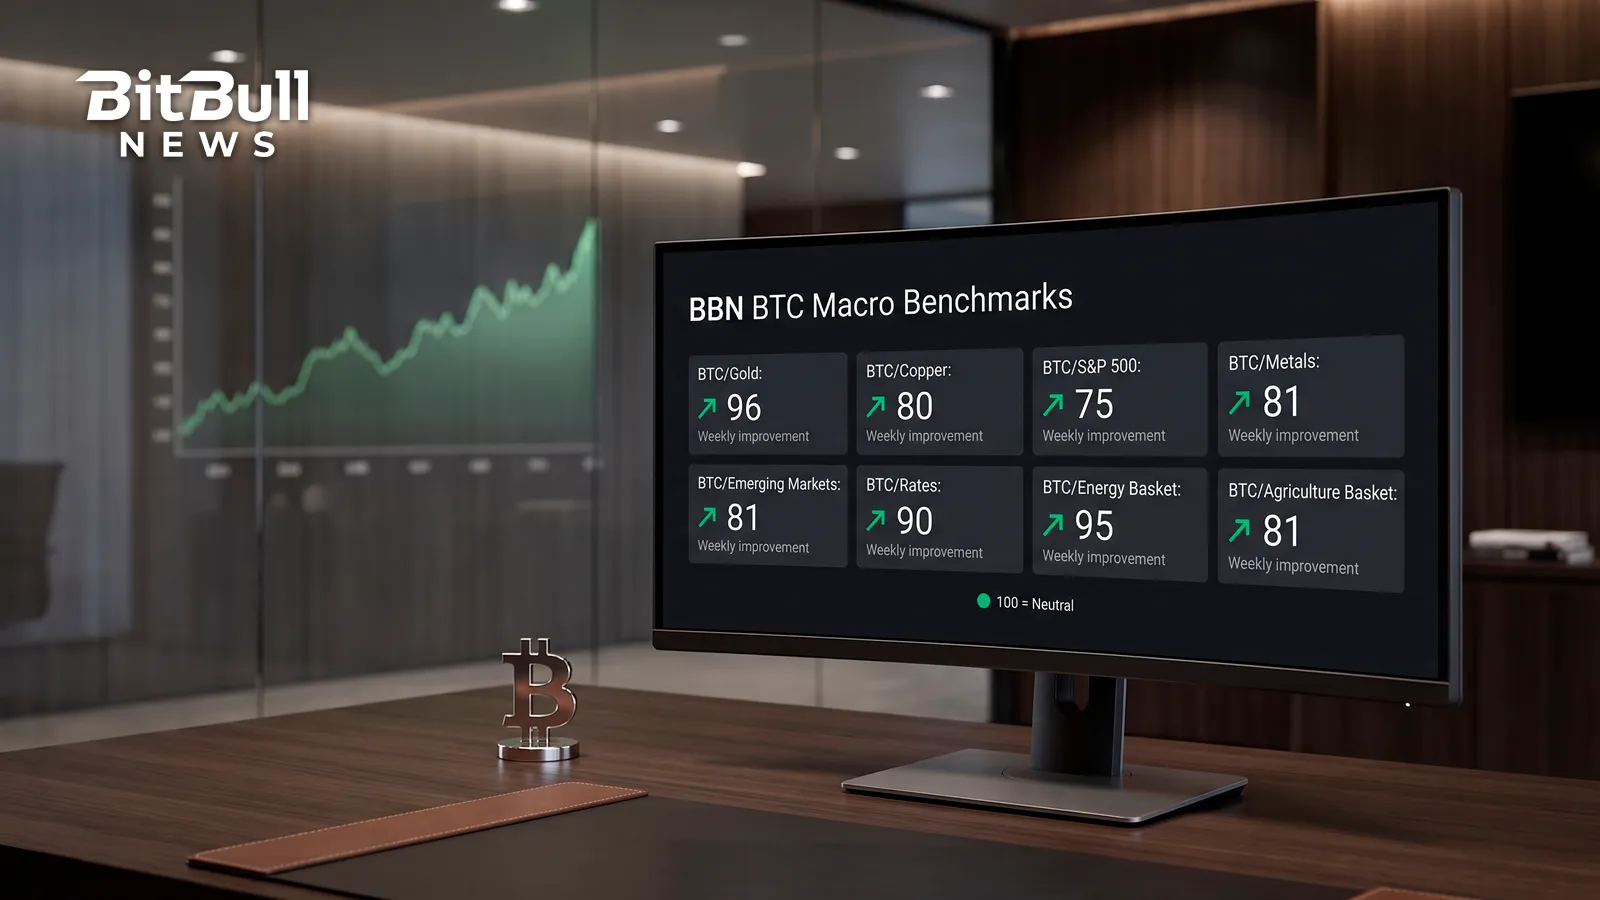
The strongest advances came against the S&P 500, copper and the agriculture basket. Bitcoin also gained against gold, rates and energy despite a week marked by higher Treasury yields, renewed oil volatility and another strong performance from AI-linked equities.
That breadth matters. The previous BBN Data update showed Bitcoin beginning to recover from six-month relative lows. This week confirmed that the move was not limited to one weak commodity or one favorable macro release.
It still was not a breakout.
Every benchmark remains below the neutral level of 100, where Bitcoin would be holding an equal relative position against the comparison asset. The family average improved from 84.9 to 87.5, a gain of 2.6 points or 3.1%, but Bitcoin is still playing from behind across the entire board.
The Scoreboard
The BBN benchmark family measures Bitcoin against monetary assets, industrial commodities, equities, emerging markets, interest rates and broad commodity baskets. A reading above 100 means Bitcoin is outperforming. A reading below 100 means the comparison asset still holds the stronger relative position.
| Benchmark | July 10 | Previous | Point Change | Weekly Change | Gap From 100 |
|---|---|---|---|---|---|
| BTC/Gold | 97 | 96 | +1 | +1.0% | −3 |
| BTC/Copper | 84 | 80 | +4 | +5.0% | −16 |
| BTC/S&P 500 | 79 | 75 | +4 | +5.3% | −21 |
| BTC/Metals | 84 | 81 | +3 | +3.7% | −16 |
| BTC/Emerging Markets | 84 | 81 | +3 | +3.7% | −16 |
| BTC/Rates | 91 | 90 | +1 | +1.1% | −9 |
| BTC/Energy Basket | 96 | 95 | +1 | +1.1% | −4 |
| BTC/Agriculture Basket | 85 | 81 | +4 | +4.9% | −15 |
The percentage changes are calculated against each benchmark’s previous reading. That is why an identical four-point increase produces a 5.3% move for BTC/S&P 500 and a 5.0% move for BTC/Copper.
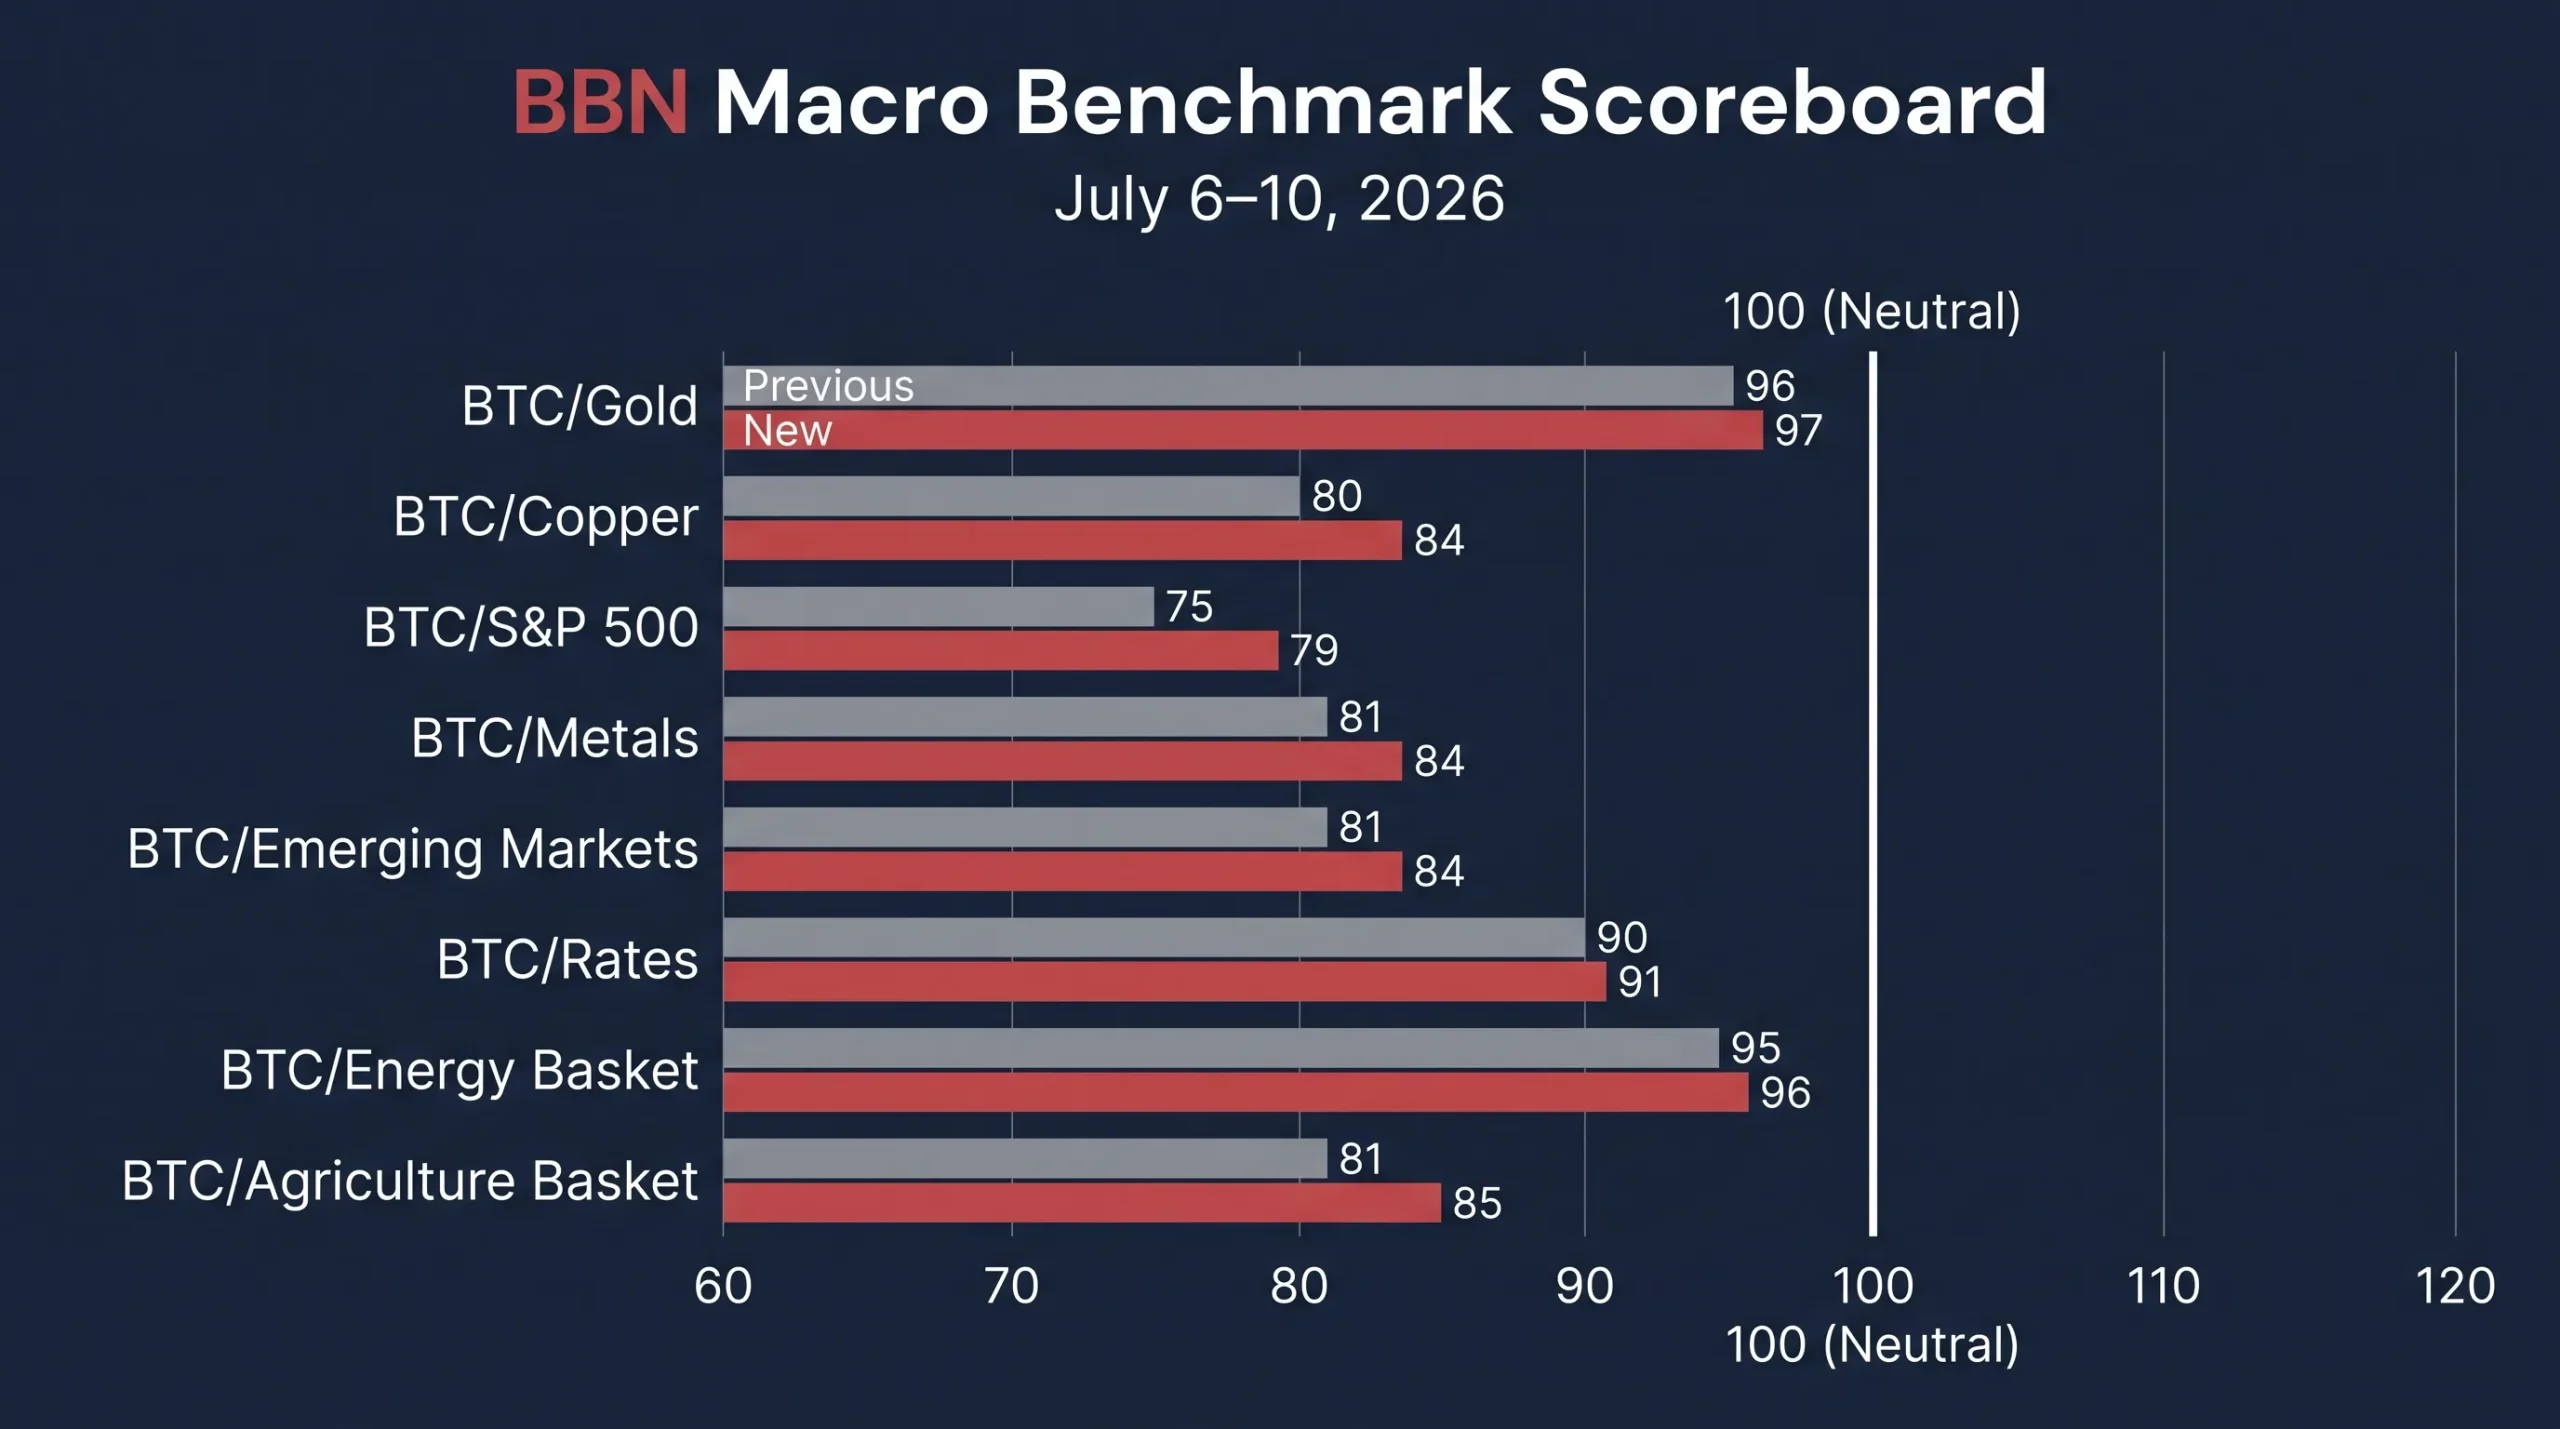
Chart 1: BBN Macro Benchmark Scoreboard — Previous Reading Versus July 10
A Recovery Built On Resilience, Not Euphoria
Bitcoin did not move through the week without resistance.
The market came under immediate pressure on Monday after Strategy disclosed that it had sold 3,588 BTC for roughly $216 million. According to the company’s SEC filing, the proceeds were used to support preferred-stock distributions and replenish its dollar reserve.
The disclosure pushed Bitcoin down to about $61,335 during Monday trading and challenged one of the market’s strongest narratives: that its largest corporate holder would remain a permanent buyer.
The selling did not develop into another liquidation cascade. Bitcoin recovered to around $63,900 by Friday and was up approximately 4% over the preceding seven days. It also held above $63,000 heading into a $1.4 billion options expiry, despite another midweek reversal in ETF flows.
The institutional flow picture was mixed but materially better than it had been in June. Farside Investors’ daily data show approximately $197.4 million of net inflows into U.S. spot Bitcoin ETFs across the five sessions:
| Date | Net U.S. Spot Bitcoin ETF Flow |
|---|---|
| July 6 | +$265.7 million |
| July 7 | +$21.5 million |
| July 8 | −$84.9 million |
| July 9 | −$95.3 million |
| July 10 | +$90.4 million |
| Weekly Total | +$197.4 million |
The pattern was hardly a stampede back into Bitcoin, but it was enough to establish a floor beneath the market. ETF demand absorbed the Strategy headline, geopolitical volatility and a renewed rise in Treasury yields without allowing BTC to revisit its July 1 low.
That resilience, rather than outright speculative enthusiasm, is what lifted the whole benchmark family.
Why Bitcoin Beat Copper And The S&P 500
BTC/S&P 500 recorded the largest percentage improvement of the week, rising 5.3% from 75 to 79. BTC/Copper followed closely, up 5.0% from 80 to 84.
These were the two comparisons where Bitcoin had the most ground to recover. They also represent the assets that have competed most directly with crypto for risk capital.
U.S. equities remained strong. The S&P 500 gained 1.2% during the week and the Nasdaq rose 1.7%, helped by another late-week rally in semiconductors and AI-linked companies. Information technology led the S&P 500 sectors, while the index completed its fourth positive week in five.
Bitcoin therefore did not improve against equities because Wall Street collapsed. It improved while the S&P 500 was still advancing. That makes the four-point move more useful than the previous week’s rebound, when several macro assets were falling sharply around BTC.
The problem is the starting level. At 79, BTC/S&P 500 remains the weakest reading in the entire family and sits 21 points below neutral. The capital rotation identified in the June BBN Indices report has not disappeared. AI infrastructure, semiconductors and technology equities still offer institutional investors a more liquid and earnings-backed way to express high-beta growth exposure.
Bitcoin won the week. It has not yet won the allocation battle.
Copper presented a different setup. Prices came under pressure during the middle of the week as renewed geopolitical tensions raised inflation and growth concerns, while uncertainty around U.S. refined-copper tariffs complicated physical trading. Chinese spot demand improved as prices declined, but that dip buying was not enough to prevent softer futures and spot conditions.
The result was a strong relative move for BTC/Copper. Bitcoin benefited from its late-week recovery while copper absorbed a combination of geopolitical risk, tariff uncertainty and concern over industrial demand.
The reading still sits at only 84. Copper’s longer-term support from power-grid investment, electrification, data centers and constrained mine supply continues to matter. Bitcoin recovered four points against copper, but it remains 16 points below parity with one of the strongest real-economy expressions of the AI investment cycle.
Gold And Energy Show Where The Rally Was Less Convincing
BTC/Gold and BTC/Energy are the two readings closest to neutral, at 97 and 96. They also posted among the smallest weekly increases, each gaining roughly 1%.
Gold ended the week down only 0.2%, despite a difficult macro backdrop. Higher Treasury yields and the more hawkish tone in the Federal Reserve minutes weighed on non-yielding assets, but geopolitical uncertainty kept a defensive bid under bullion.
Bitcoin’s one-point gain against gold therefore reflects modest monetary-asset outperformance rather than a decisive change in the market’s preferred store of value. At 97, BTC/Gold is close enough to neutral that another constructive week could push it above 100. It is also close enough that a fresh geopolitical shock could reverse the move quickly.
Energy was harder.
Oil prices rose sharply after geopolitical tensions intensified and concerns returned over traffic through the Strait of Hormuz. WTI gained about 4% for the week, while Brent rose approximately 5.4%. The largest moves came on Wednesday, when renewed hostilities sent both contracts sharply higher before negotiations and de-escalation reports pulled prices back from their peaks.
Against that backdrop, BTC/Energy still moved from 95 to 96. The gain was small, but it shows Bitcoin held its relative position even as crude oil delivered one of the strongest weekly performances among major commodities.
The broader energy basket is not limited to crude. Natural gas, refined products and other energy contracts did not move in lockstep with Brent and WTI, which helped Bitcoin preserve a narrow relative advantage at the basket level.
Energy remains only four points ahead of Bitcoin on the BBN scale. Gold and energy are now the first two benchmarks with a realistic chance of crossing neutral, but the drivers are different. Gold requires Bitcoin to strengthen as a monetary asset. Energy requires BTC to hold up while the oil shock fades.
Rates Remained A Headwind, But Bitcoin Absorbed It
BTC/Rates rose from 90 to 91, a gain of 1.1%.
That move should not be read as evidence that the rate environment improved. It did not.
The Federal Reserve’s June meeting minutes, released on July 8, showed that several officials saw a possible case for raising interest rates if inflation remained elevated. Most policymakers supported removing language that implied an easing bias, reinforcing the view that the next policy move was no longer certain to be a cut.
Treasury yields rose in response. According to U.S. Treasury data, the two-year yield increased from approximately 4.13% on July 6 to 4.21% on July 10. The ten-year yield climbed from 4.48% to 4.56%.
| Treasury Maturity | July 6 | July 10 | Weekly Change |
|---|---|---|---|
| 2-Year Yield | 4.13% | 4.21% | +8 bps |
| 10-Year Yield | 4.48% | 4.56% | +8 bps |
That combination normally works against Bitcoin. Higher yields increase the return available on risk-free assets and raise the opportunity cost of holding a volatile asset with no cash flow.
Bitcoin’s ability to improve the rates benchmark despite an eight-basis-point rise in both two-year and ten-year yields is therefore constructive. The market absorbed a hawkish policy signal without giving back the entire post-payroll recovery.
Still, a reading of 91 means rates remain a clear relative headwind. Bitcoin is handling tighter financial conditions better than it did in June, not escaping them.
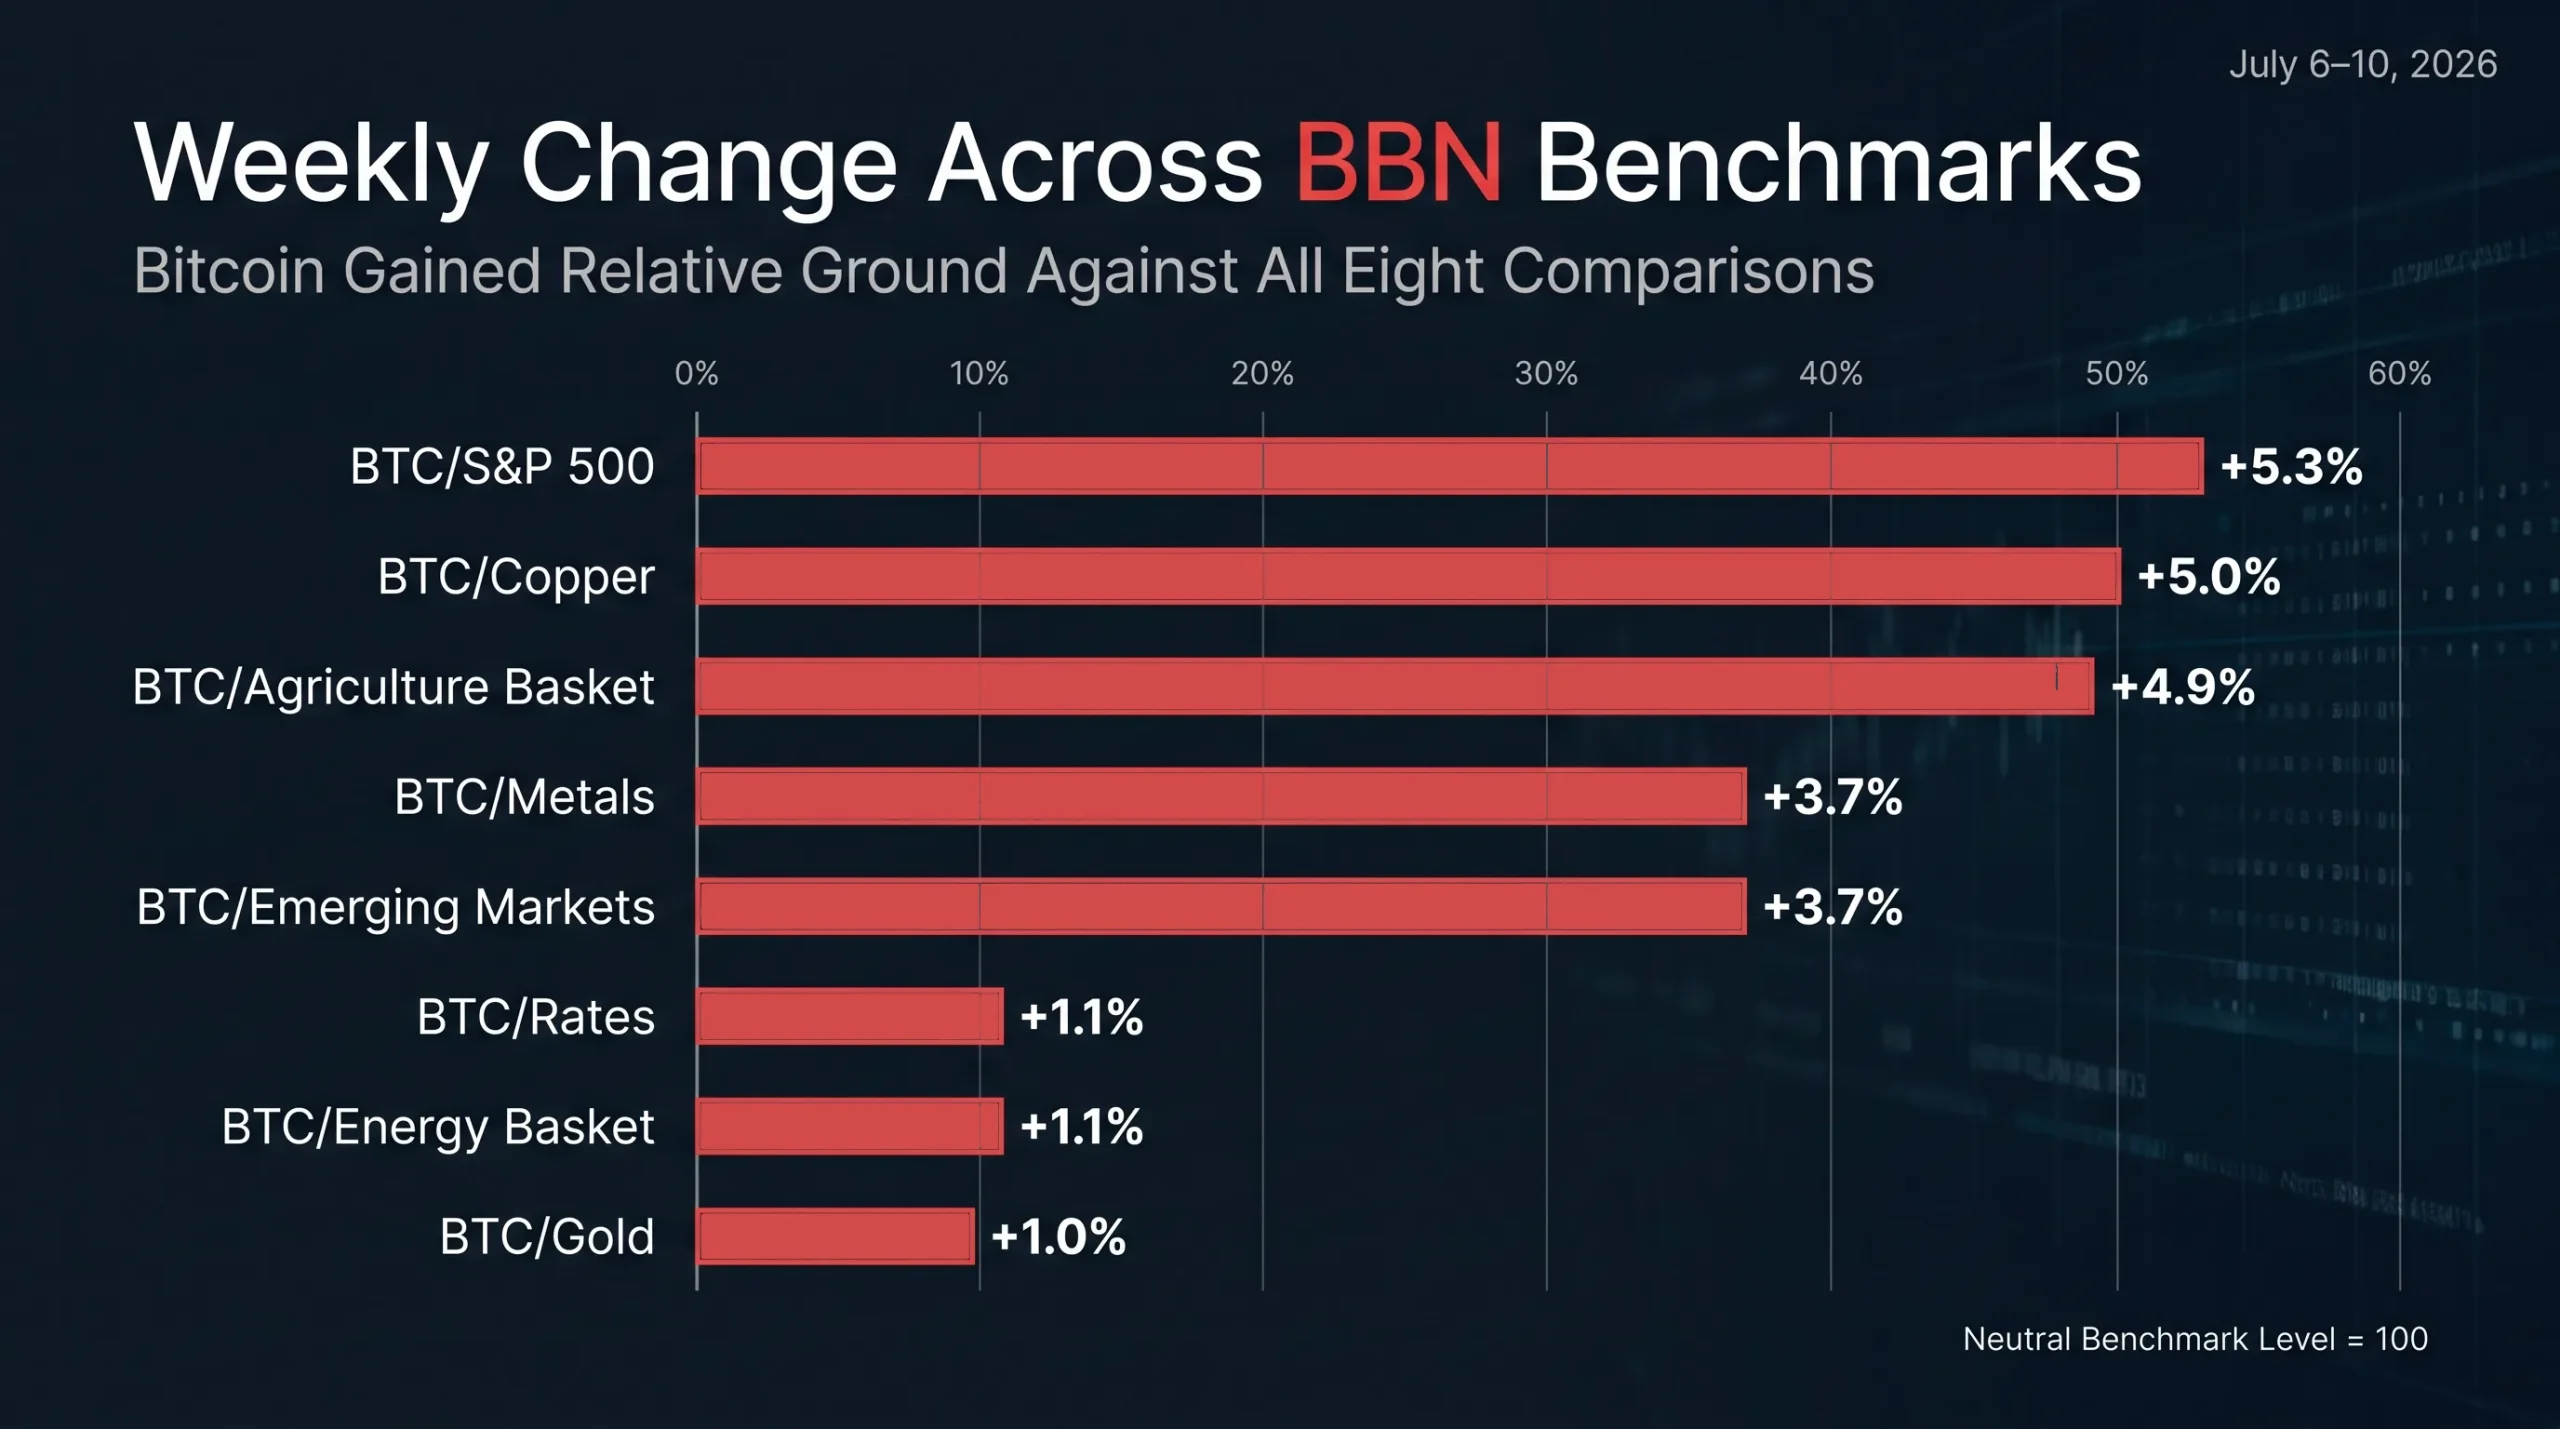
Chart 2: Weekly Percentage Change Across The BBN Benchmark Family
Agriculture And Emerging Markets Lost Relative Ground
BTC/Agriculture rose 4.9%, the third-largest percentage increase of the week, moving from 81 to 85.
Agricultural markets were not uniformly weak. The USDA’s July supply-and-demand update reduced its U.S. wheat production estimate and raised export projections for corn and soybeans. Corn briefly gained about 2%, soybeans 1% and wheat 3.3% following the report.
That late-week rally probably prevented an even larger rise in BTC/Agriculture. Earlier trading remained uneven across grains, livestock and soft commodities, while Bitcoin’s Friday recovery produced a stronger relative move across the full comparison period.
At 85, agriculture is no longer tied for the bottom of the family, but it remains 15 points below neutral. The result says Bitcoin outperformed this week. It does not yet support the broader claim that BTC is consistently protecting purchasing power better than physical food commodities.
BTC/Emerging Markets also rose 3.7%, from 81 to 84.
Emerging-market performance was highly fragmented. China’s CSI 300 fell 1.27% and the Shanghai Composite lost 1.17%, while Hong Kong’s Hang Seng gained 3.53%. Higher oil prices and a firmer rate outlook created pressure for energy-importing countries and higher-yielding currencies, while technology-heavy Asian markets benefited from isolated AI and semiconductor gains.
The dollar finished the week close to flat, which matters. Bitcoin’s improvement against emerging markets was not simply the mechanical result of a major dollar rally crushing EM currencies. It reflected a stronger recovery in BTC than in a broad and uneven global risk complex.
What The Benchmarks Say About Bitcoin Now
Two consecutive clean sweeps deserve attention. They show that Bitcoin has stopped losing relative ground indiscriminately.
The first sweep, covering June 26 to July 3, was driven mainly by a weak U.S. employment report and collapsing oil prices. The second was more demanding. Bitcoin had to absorb a major corporate-holder sale, hawkish Fed minutes, rising yields and a midweek oil shock. It still finished with all eight benchmarks higher.
That is a better quality of recovery.
The composition also improved. The largest moves came against the S&P 500 and copper, not only against assets suffering outright declines. Bitcoin gained relative ground while AI equities remained strong and while oil prices rose. The benchmark family is beginning to register actual BTC resilience rather than just weakness elsewhere.
There is an important limit to that conclusion. The external benchmark recovery has not yet translated into a broad improvement inside the crypto industry.
The June BBN Indices showed seven of eight internal gauges below their neutral level of 50. Revenue, liquidity, labor, activity and development were still contracting, while settlement was the only area holding above neutral.
Those two signals can coexist. Bitcoin can outperform copper, stocks and commodities for a week while crypto businesses continue to face weak revenue, cautious hiring, thin liquidity and limited capital formation.
The benchmarks measure Bitcoin’s position against the outside world. The indices measure whether the industry underneath Bitcoin is expanding. Right now, the first is recovering faster than the second.
What To Watch Next
The neutral line is the only threshold that matters now.
Gold at 97 and energy at 96 are within striking distance. A sustained Bitcoin move above $65,000 combined with stable oil and gold prices could push both above 100.
Rates at 91 are the next test. The benchmark is unlikely to reach neutral while Treasury yields remain near current levels and the Federal Reserve keeps the possibility of another hike alive.
The hardest confirmation would come from BTC/S&P 500. The index’s rise from 75 to 79 is encouraging, but it remains the weakest reading in the family. A move through the mid-80s would show that Bitcoin is beginning to compete with the AI and semiconductor trade for risk capital. Until then, the equity gap remains the clearest evidence that institutional allocation has not fully rotated back toward crypto.
For the week of July 6–10, Bitcoin did enough. It survived an unfavorable sequence, recovered institutional demand and gained against every major macro comparison for a second straight update.
The market has moved from capitulation into repair. Neutral remains the dividing line between a repair trade and a genuine change in regime.
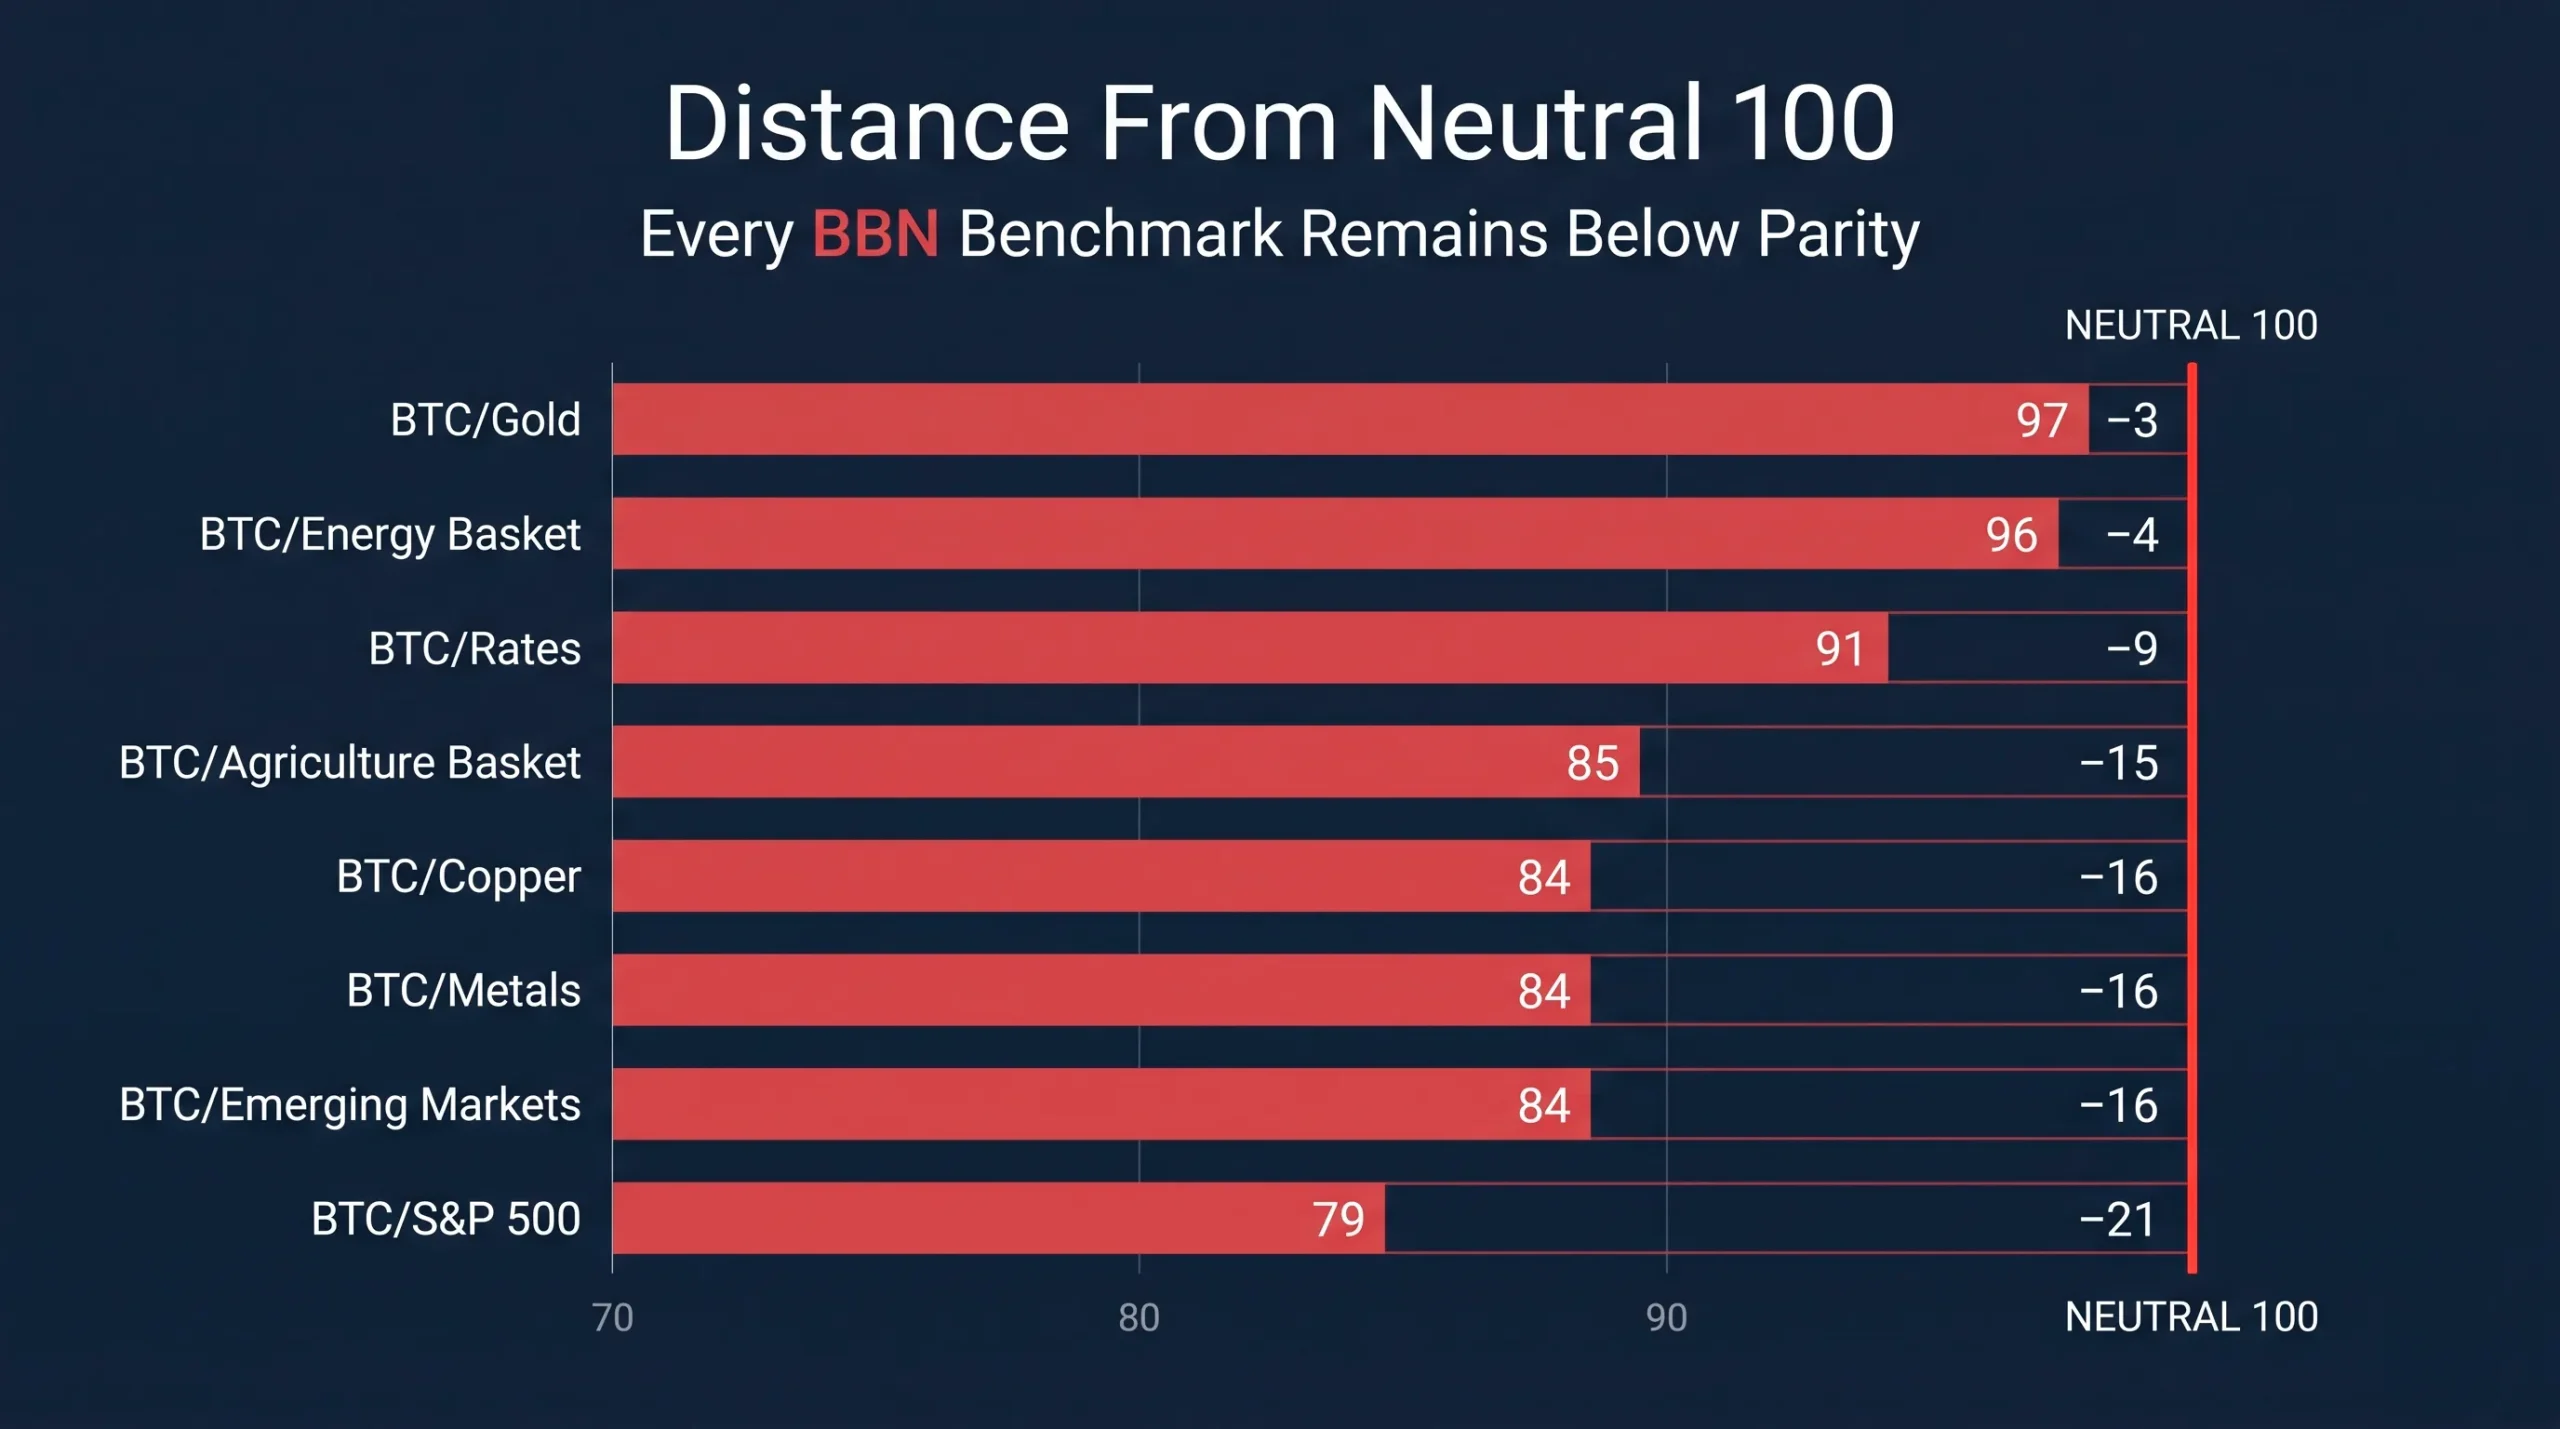
Chart 3: Distance From The Neutral 100 Line Across All Eight Benchmarks
Disclaimer
This article is for informational purposes only and does not constitute investment advice, a recommendation or a solicitation to buy or sell any asset. Digital assets, equities, commodities and fixed-income instruments can be highly volatile and involve substantial risk. Conduct independent research and consult a licensed financial professional before making investment decisions.