


Content
Bitcoin spent June getting taken apart. It shed roughly 20% for the month, printed a 21-month low near $57,950 on July 1, and bled a record $4-plus billion out of US spot ETFs along the way. Then the tape turned. A soft payrolls report and a crashing oil complex handed BTC a relative-strength week that looks a lot better on the scoreboard than it feels in the order book.
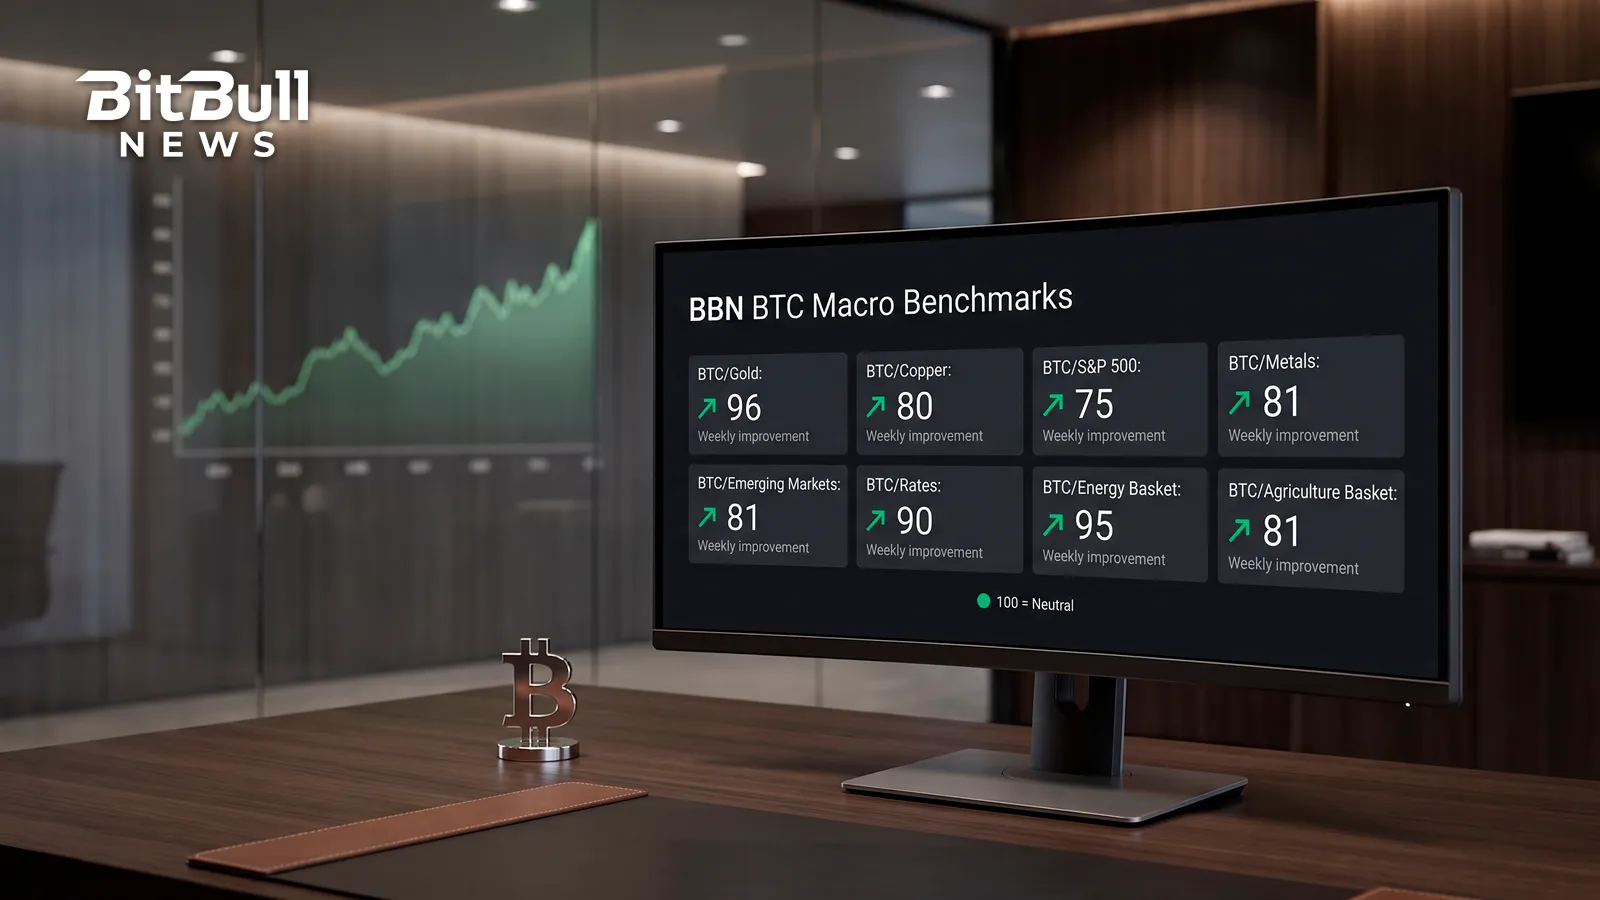
Every one of the eight BBN BTC Macro Benchmarks moved higher this week, meaning Bitcoin gained ground against gold, copper, equities, rates, emerging markets, and the energy, metals, and agriculture baskets simultaneously. That kind of clean sweep is rare. It usually signals either a genuine crypto bid or a macro shock that hits everything except Bitcoin. This time it was the second thing.
One number keeps the sweep in perspective. On the BBN scale, 100 is neutral — where Bitcoin neither out- nor underperforms an asset — and all eight readings are still below it. BTC clawed back toward its baseline this week without reclaiming it anywhere. Where it strengthened most and least tells the rest.
The Scoreboard
Here is where the eight benchmarks landed, current reading with the weekly move in points and percent, and how far each still sits below the neutral 100 line:
- BBN BTC/Gold: 96 (+3 pts, +3.2%) — 4 below neutral
- BBN BTC/Energy Basket: 95 (+6 pts, +6.7%) — 5 below neutral
- BBN BTC/Rates: 90 (+5 pts, +5.9%) — 10 below neutral
- BBN BTC/Metals: 81 (+4 pts, +5.2%) — 19 below neutral
- BBN BTC/Emerging Markets: 81 (+4 pts, +5.2%) — 19 below neutral
- BBN BTC/Agriculture Basket: 81 (+5 pts, +6.6%) — 19 below neutral
- BBN BTC/Copper: 80 (+3 pts, +3.9%) — 20 below neutral
- BBN BTC/S&P 500: 75 (+4 pts, +5.6%) — 25 below neutral
Two things stand out. Bitcoin has clawed closest to neutral against gold and energy, at 96 and 95, yet even those fall short of 100. And it sits furthest below par against the S&P 500 at 75, a full 25 points under equilibrium. On the move itself, energy led at plus six points and 6.7%, agriculture close behind; gold and copper trailed, each up three points. Every one of those extremes traces to a specific catalyst that landed between June 29 and July 3.
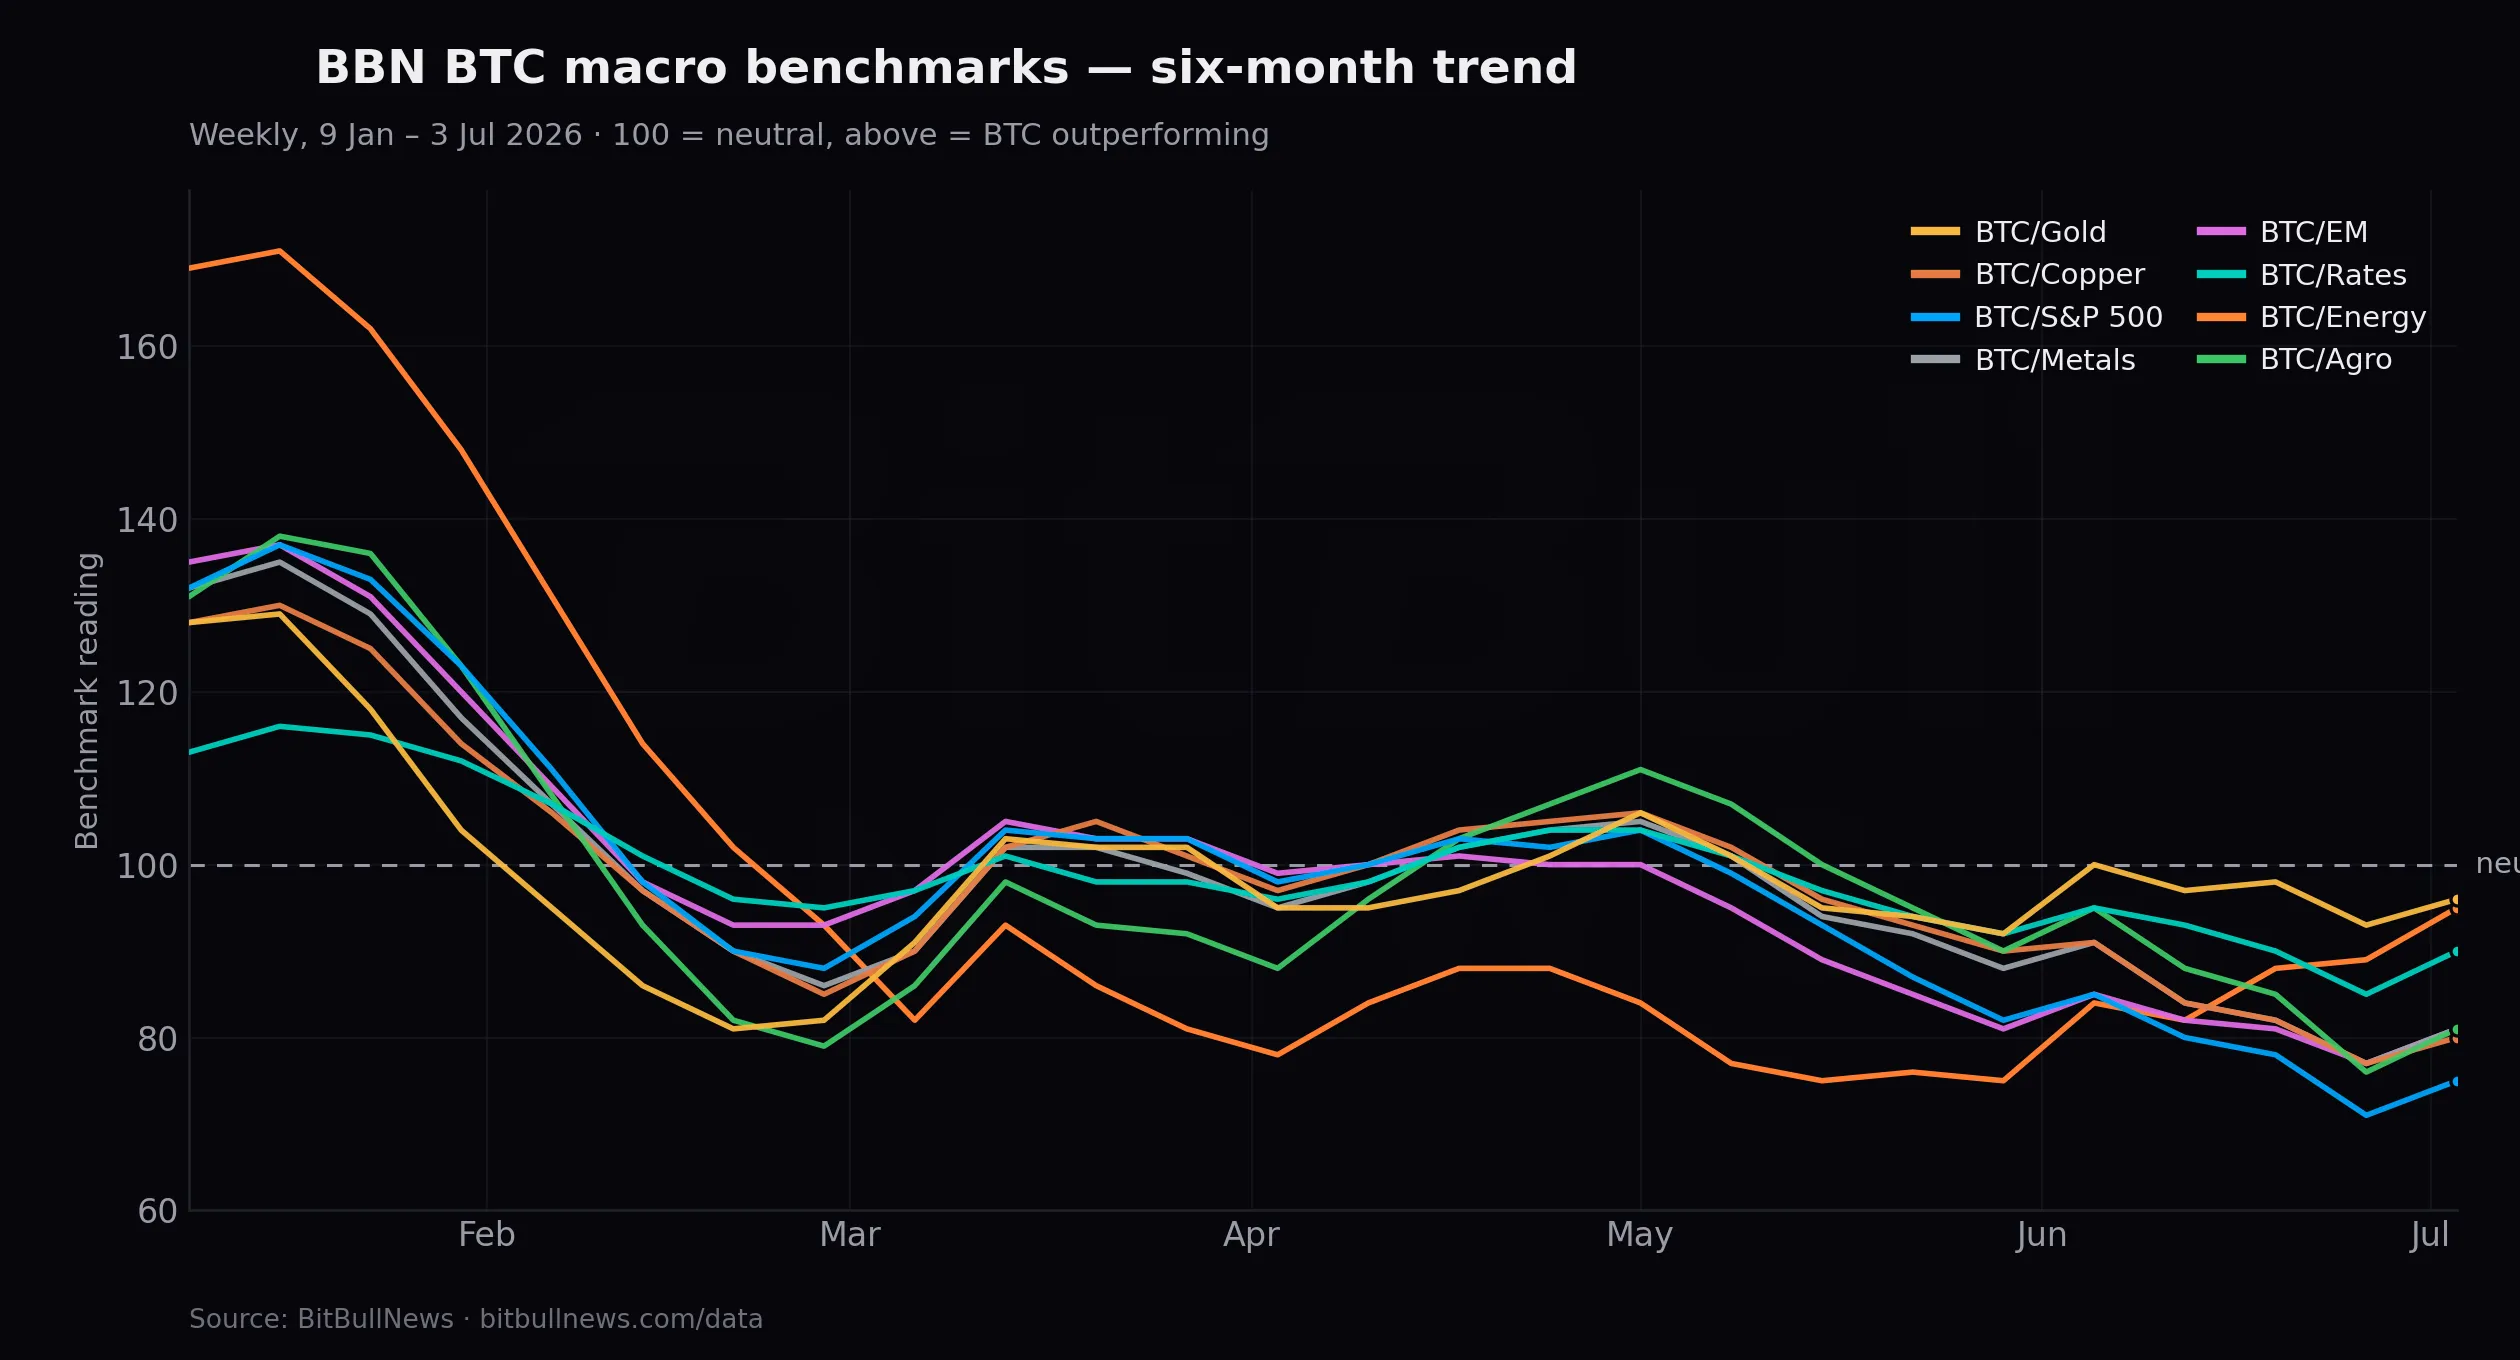
Zoom out to the six-month series and the sweep looks less like strength than a bounce off the floor. For six of the eight benchmarks — equities, copper, metals, emerging markets, agriculture, and rates — the June 26 reading marked the lowest point of the entire period, below even the late-February capitulation that followed the Warsh nomination shock. This week pulled those numbers up, but not one is back to 100. Bitcoin is less far behind than it was seven days ago. It is still behind.
A Jobs Miss Reset The Whole Board
The macro event of the week was the June employment report, out Thursday, July 2. Payrolls came in at just 57,000 against a consensus near 110,000, the weakest in four months, with the prior two months revised down a combined 74,000 and the household survey showing 507,000 fewer people working. Unemployment ticked down to 4.2%, but only because participation slid to 61.5%, its lowest since March 2021. That is not a strong labor market. That is people leaving it.
Markets repriced fast. Fed funds futures cut September hike odds from about 67% to roughly 50%, the two-year Treasury yield fell to around 4.13%, the dollar softened off a one-year high, and equity futures caught a bid. Every risk asset priced in a less aggressive Fed, and Bitcoin, the highest-beta expression of that trade, moved with them.
This matters because the Fed under new chair Kevin Warsh has spent 2026 leaning hawkish. Warsh took the year’s expected rate cut off the table in June, where nine of eighteen officials penciled in a hike rather than a cut, and on July 1 he flagged that prices remain too high even as inflation expectations moderate. A hawkish Fed is the heaviest weight Bitcoin has carried this year, and a weak jobs print is the first thing in weeks to lift a corner of it. BTC/Rates climbing five points to 90, up 5.9%, is the fingerprint of that repricing, though it too sits ten points shy of neutral.
Energy Did The Rest
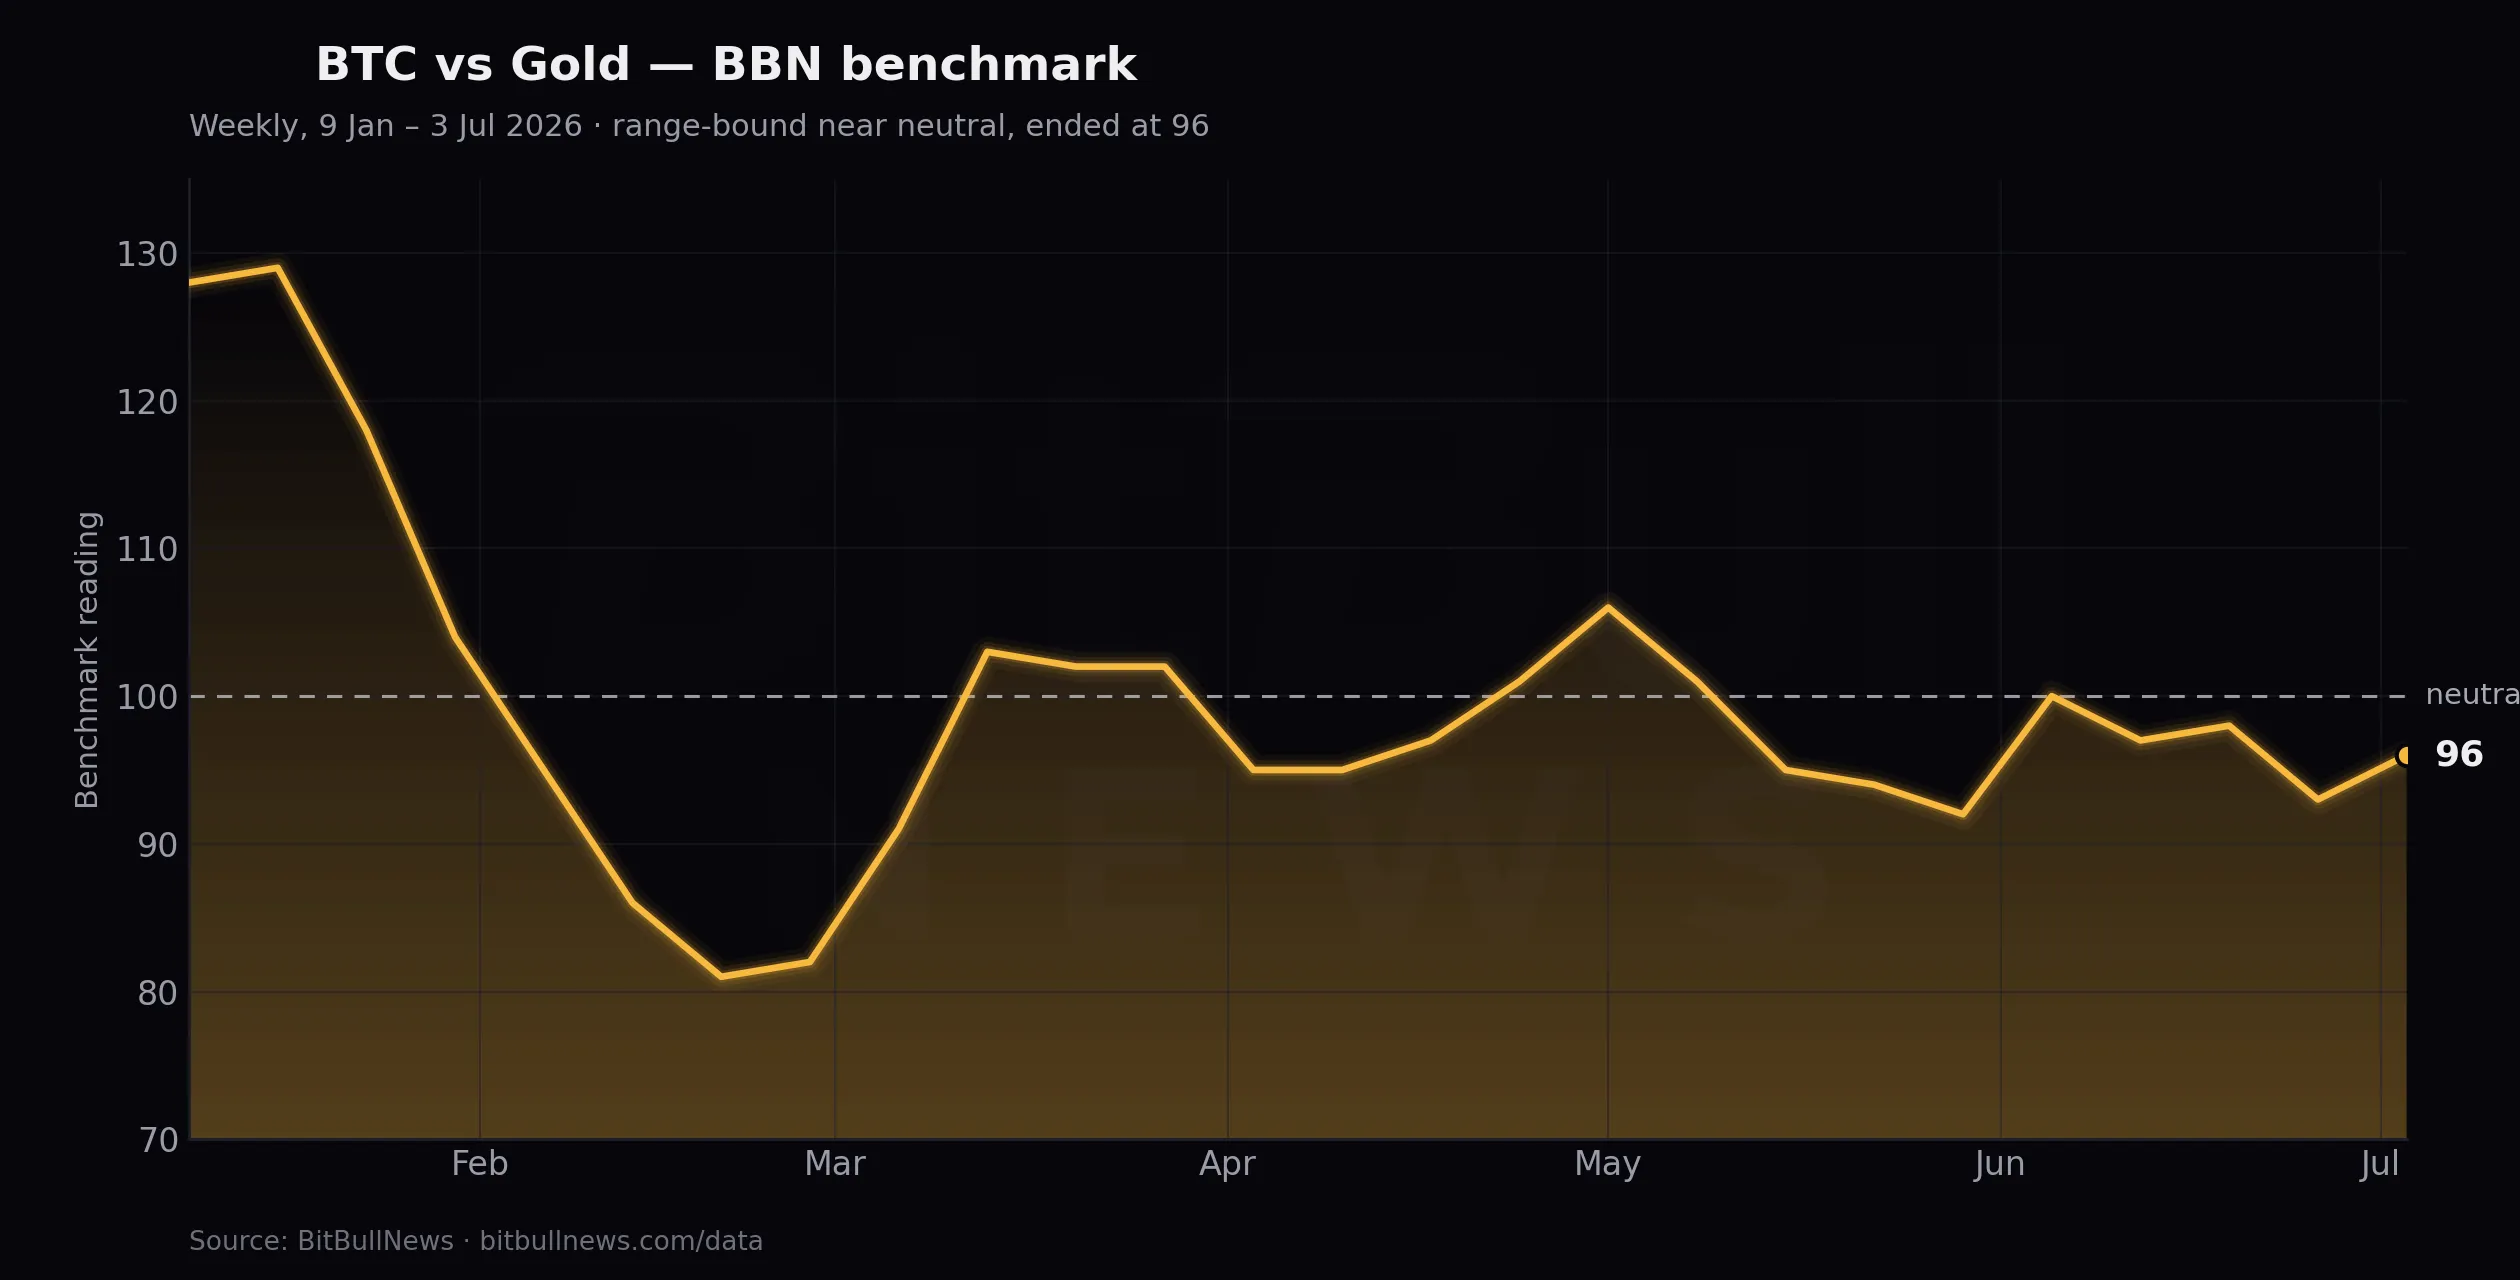
The BTC/Energy benchmark’s six-point surge to 95, up 6.7% and the biggest weekly move on the board, is not really a Bitcoin story. It is an oil story, and oil had a brutal week. Energy is also the one benchmark whose recovery has legs in the six-month data: it sat pinned near 75 through May, its floor for the year, because crude was spiking on the Middle East conflict. The climb from 75 to 95 since is the mirror image of Brent rolling over.
Brent closed out June with its biggest monthly decline since 2020 and kept sliding into July, near $71-72 with WTI around $67-68, the lowest since late February. The driver is de-escalation: traffic through the Strait of Hormuz has recovered after the Middle East conflict that spiked crude earlier this year, US-Iran talks in Doha are progressing, and Saudi and UAE exports are back near pre-war throughput. Add OPEC+ signaling another August quota hike and the market has swung from shortage fear to surplus.
Falling energy is a double win for the benchmark. The energy basket craters, so BTC gains ground mechanically, and cheaper oil pulls inflation expectations down, softening the Fed’s hike case and helping Bitcoin again through the rate channel. The same de-escalation that gutted energy fed the repricing that lifted BTC/Rates. One catalyst, two tailwinds.
Gold Rallied, And Bitcoin Still Won
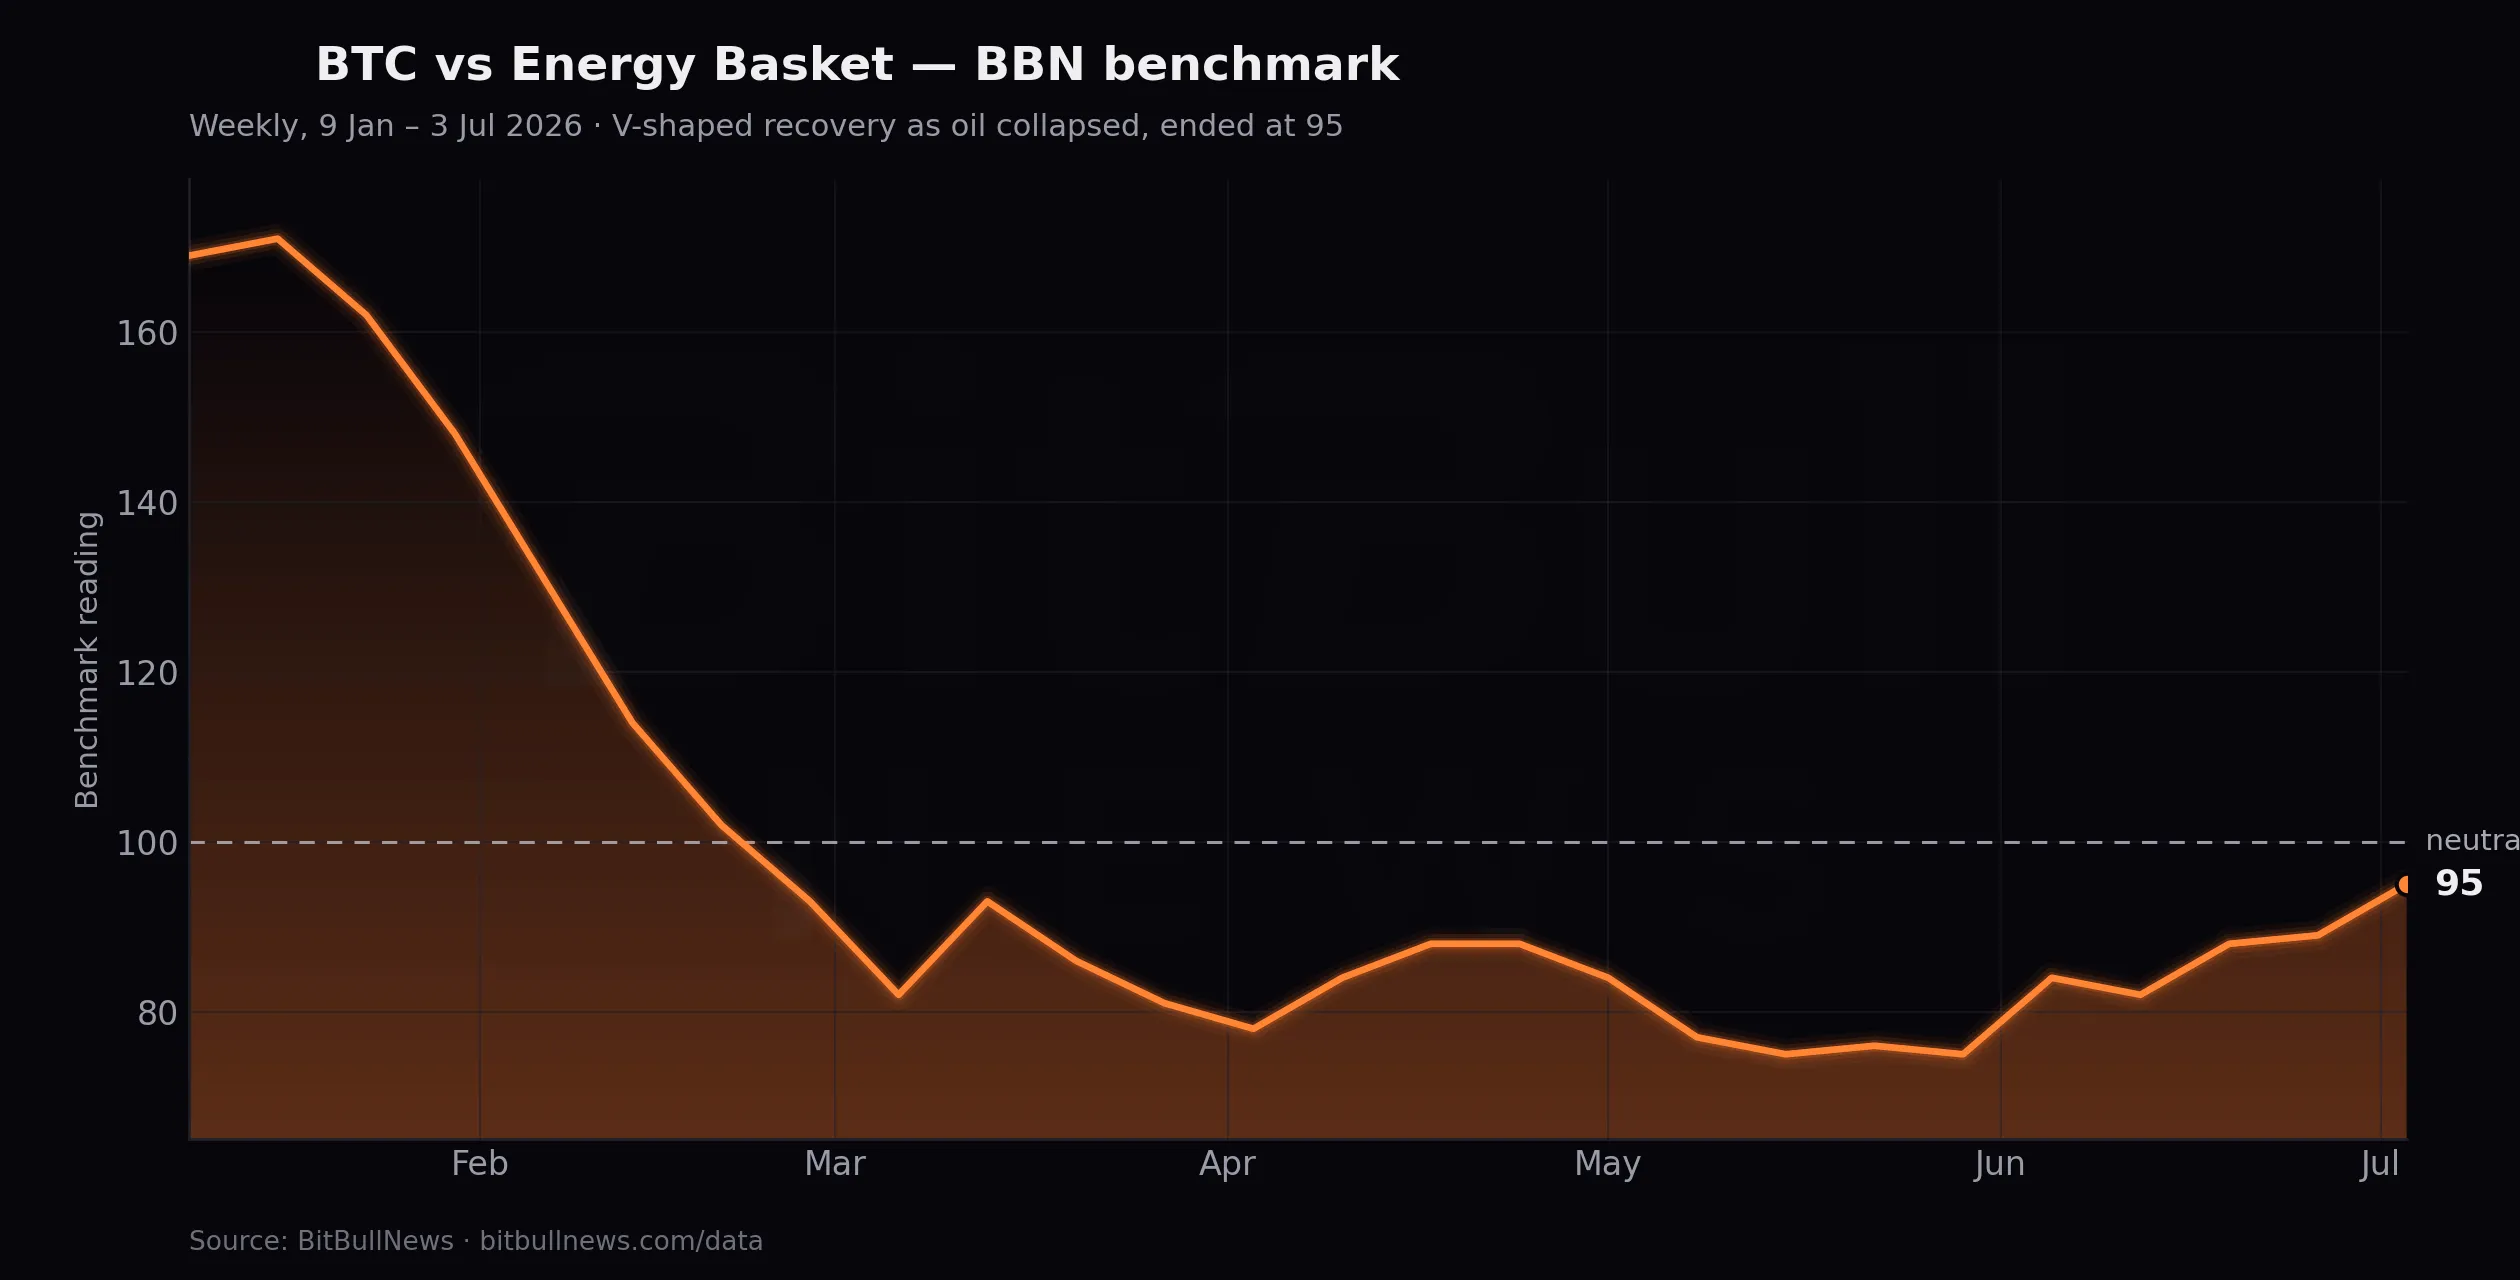
The gold benchmark is the quiet standout. BTC/Gold rose three points to 96, the reading closest to neutral on the board, in a week when gold itself rallied hard. Bullion climbed back above $4,100 toward $4,200 on Thursday and Friday, rebounding from an eight-month low on the same dovish jobs data that helped Bitcoin.
That explains why gold is both closest to par and the smallest gainer in percentage terms, up just 3.2%. Bitcoin had to out-run a rising benchmark to move the needle at all, and still could not push the reading to 100. That tells you the BTC bounce had real relative velocity this week. It also tells you gold has lost its shine for now. After peaking above $5,400 in late January and getting crushed roughly 16% in a single session on the Warsh nomination shock, gold has spent months capped below its 50-day average, no longer the reflex trade for macro anxiety. With central bank buying cooling, it is on the back burner, and Bitcoin is exploiting the gap.
Copper Stayed Stubborn
If energy was the biggest mover, copper was the most stubborn. The BTC/Copper benchmark rose three points to 80, up 3.9% and, alongside gold, one of the two smallest gains on the board, because copper simply refused to fall as hard as everything else.
Copper near $6.10-6.20 a pound did soften late in the week, ahead of a US Commerce report that could bring tariffs on refined metal and amid the same Fed-hike worries pressuring industrial demand. But the structural bid under copper is different from oil’s. The metal runs a genuine supply deficit and has quietly become an AI trade: data centers, power grids, and electrification pull in copper faster than mines deliver it, which is why it is up more than 20% over the past year while oil rolled over. Bitcoin gained little against it for the same reason it is stalling against equities — copper is plugged into the AI capital flood now outcompeting BTC for risk money.
The Benchmark Bitcoin Can’t Beat
Which brings us to the laggard. BTC/S&P 500 sits at 75, dead last, even after a four-point, 5.6% gain, and a full 25 points below neutral. Bitcoin is strengthening against US equities more slowly than against anything else, and the reason is the most important structural signal in this entire dataset. The starting point makes it worse: last week the reading hit 71, the lowest of the whole six-month series, so this bounce is off a floor, not a springboard.
American stocks just posted a historic first half. The S&P 500 rose 9.6%, the Nasdaq 12.8%, and the Russell 2000 around 22%, its best start since 1991, with the Dow tagging a record above 52,000 this week. The engine has been the AI and semiconductor complex, which more than tripled some memory names in a single quarter before profit-taking cooled it into July.
Here is the uncomfortable part for crypto bulls. The capital that used to rotate into Bitcoin on risk-on days is rotating into chips instead. Since April, US gold and Bitcoin ETFs have bled a combined $12 billion while semiconductor ETFs pulled in $20 billion. Bitcoin is not losing to fear right now. It is losing to Nvidia. That is why the S&P benchmark refuses to break higher even in a week when everything else went Bitcoin’s way, and why these relative gains are fragile.
Emerging Markets And The Dollar
The BTC/Emerging Markets benchmark added four points (+5.2%) and BTC/Agriculture five (+6.6%), both landing at 81 and both still nineteen points under neutral. EM assets caught the same softer-dollar, softer-yield impulse that lifted Bitcoin — the Brazilian real firmed, Latin American equities rose — but EM is a lower-beta risk trade, so BTC out-ran it comfortably. Agriculture sits in the downdraft from cheaper energy, which lowers input and fertilizer costs and drags the grain complex, handing BTC one of its larger point gains almost by default.
What The Correlations Are Saying
Two correlation shifts define the week. Bitcoin recoupled tightly with the rate trade, moving step for step with falling yields and the softening dollar after the jobs miss — the pure risk asset it is, not an independent store of value. When Fed odds move, BTC moves, and that link is as tight as it has been all year.
It also decoupled from the AI equity complex, and not in its favor. The assumption that Bitcoin is the marginal risk buyer’s first stop is breaking down: AI infrastructure is absorbing the capital that once flowed to crypto, and copper rides the same wave. On the flow data, BTC is losing that contest for the same dollars.
What It Means For The Market
The clean sweep reads as a strong week for Bitcoin, and on a relative basis it was. But almost none of the strength was earned by crypto demand. It was manufactured by two outside shocks — a labor market that cracked and an oil market that de-escalated — and neither is a Bitcoin catalyst you can count on repeating.
The internal evidence stays cautious. US spot ETFs just logged their worst month on record, and the Fear and Greed Index is parked at 19, deep in extreme fear. The one constructive read is the plumbing: open interest has collapsed from about $31 billion at the end of May to near $21.6 billion, wiping out the leverage that fueled June’s liquidation cascade, while whales quietly accumulated more than 270,000 BTC over two weeks. A market cleaned out and coiled, not one with conviction.
The cleaner tell is the neutral line. Bitcoin did not reclaim 100 against a single benchmark this week; it is still underperforming its own equilibrium versus gold, oil, equities, everything, just by less than before. A real trend change needs readings back above 100, led by the benchmarks that just bounced off six-month lows rather than by gold and energy, where the move is really about a rallying metal and a crashing barrel. Until BTC/S&P 500 climbs out of the mid-70s, meaning until Bitcoin wins the rotation against AI equities instead of borrowing strength from a weak jobs print, the sweep is a macro gift, not a trend. Watch the July 18 GENIUS Act rulemaking deadline and the end-of-July Fed meeting for the next real catalysts. Everything before that is positioning.
Disclaimer: This article is for informational purposes only and does not constitute investment advice, a recommendation, or a solicitation to buy or sell any asset. Digital assets and commodities are volatile and carry substantial risk. Do your own research and consult a licensed professional before making financial decisions.