



Content
The July 02 – July 09, 2026 ETF window looked stronger than the previous week, but the finish was weak.

U.S. spot Bitcoin ETFs took in a net $330.5 million across the five reported trading sessions in the window, according to Farside Investors. That is a clear improvement from the late-June redemption wave, but the sequence matters more than the headline total: Bitcoin ETFs posted inflows on July 02, July 06, and July 07, then flipped back into outflows on July 08 and July 09.
Ethereum ETFs also improved, with a net $94.9 million inflow across the same window. The ETH complex held inflows for four straight reported sessions before a $52.2 million outflow on July 09. That makes ETH flows look cleaner than BTC on momentum, even though the dollar amount was smaller.
Spot prices did not give the market a clean confirmation. Bitcoin closed at $61,495 on July 02 and $63,198 on July 09, up roughly 2.8% across the window. Ether closed at $1,698.31 on July 02 and $1,744.73 on July 09, also up roughly 2.7%. Both assets recovered from the early-July lows, but both stalled after July 06.
The market read is straightforward: institutional ETF demand returned, but it did not sustain enough pressure to offset broader risk-off trading by the end of the week.
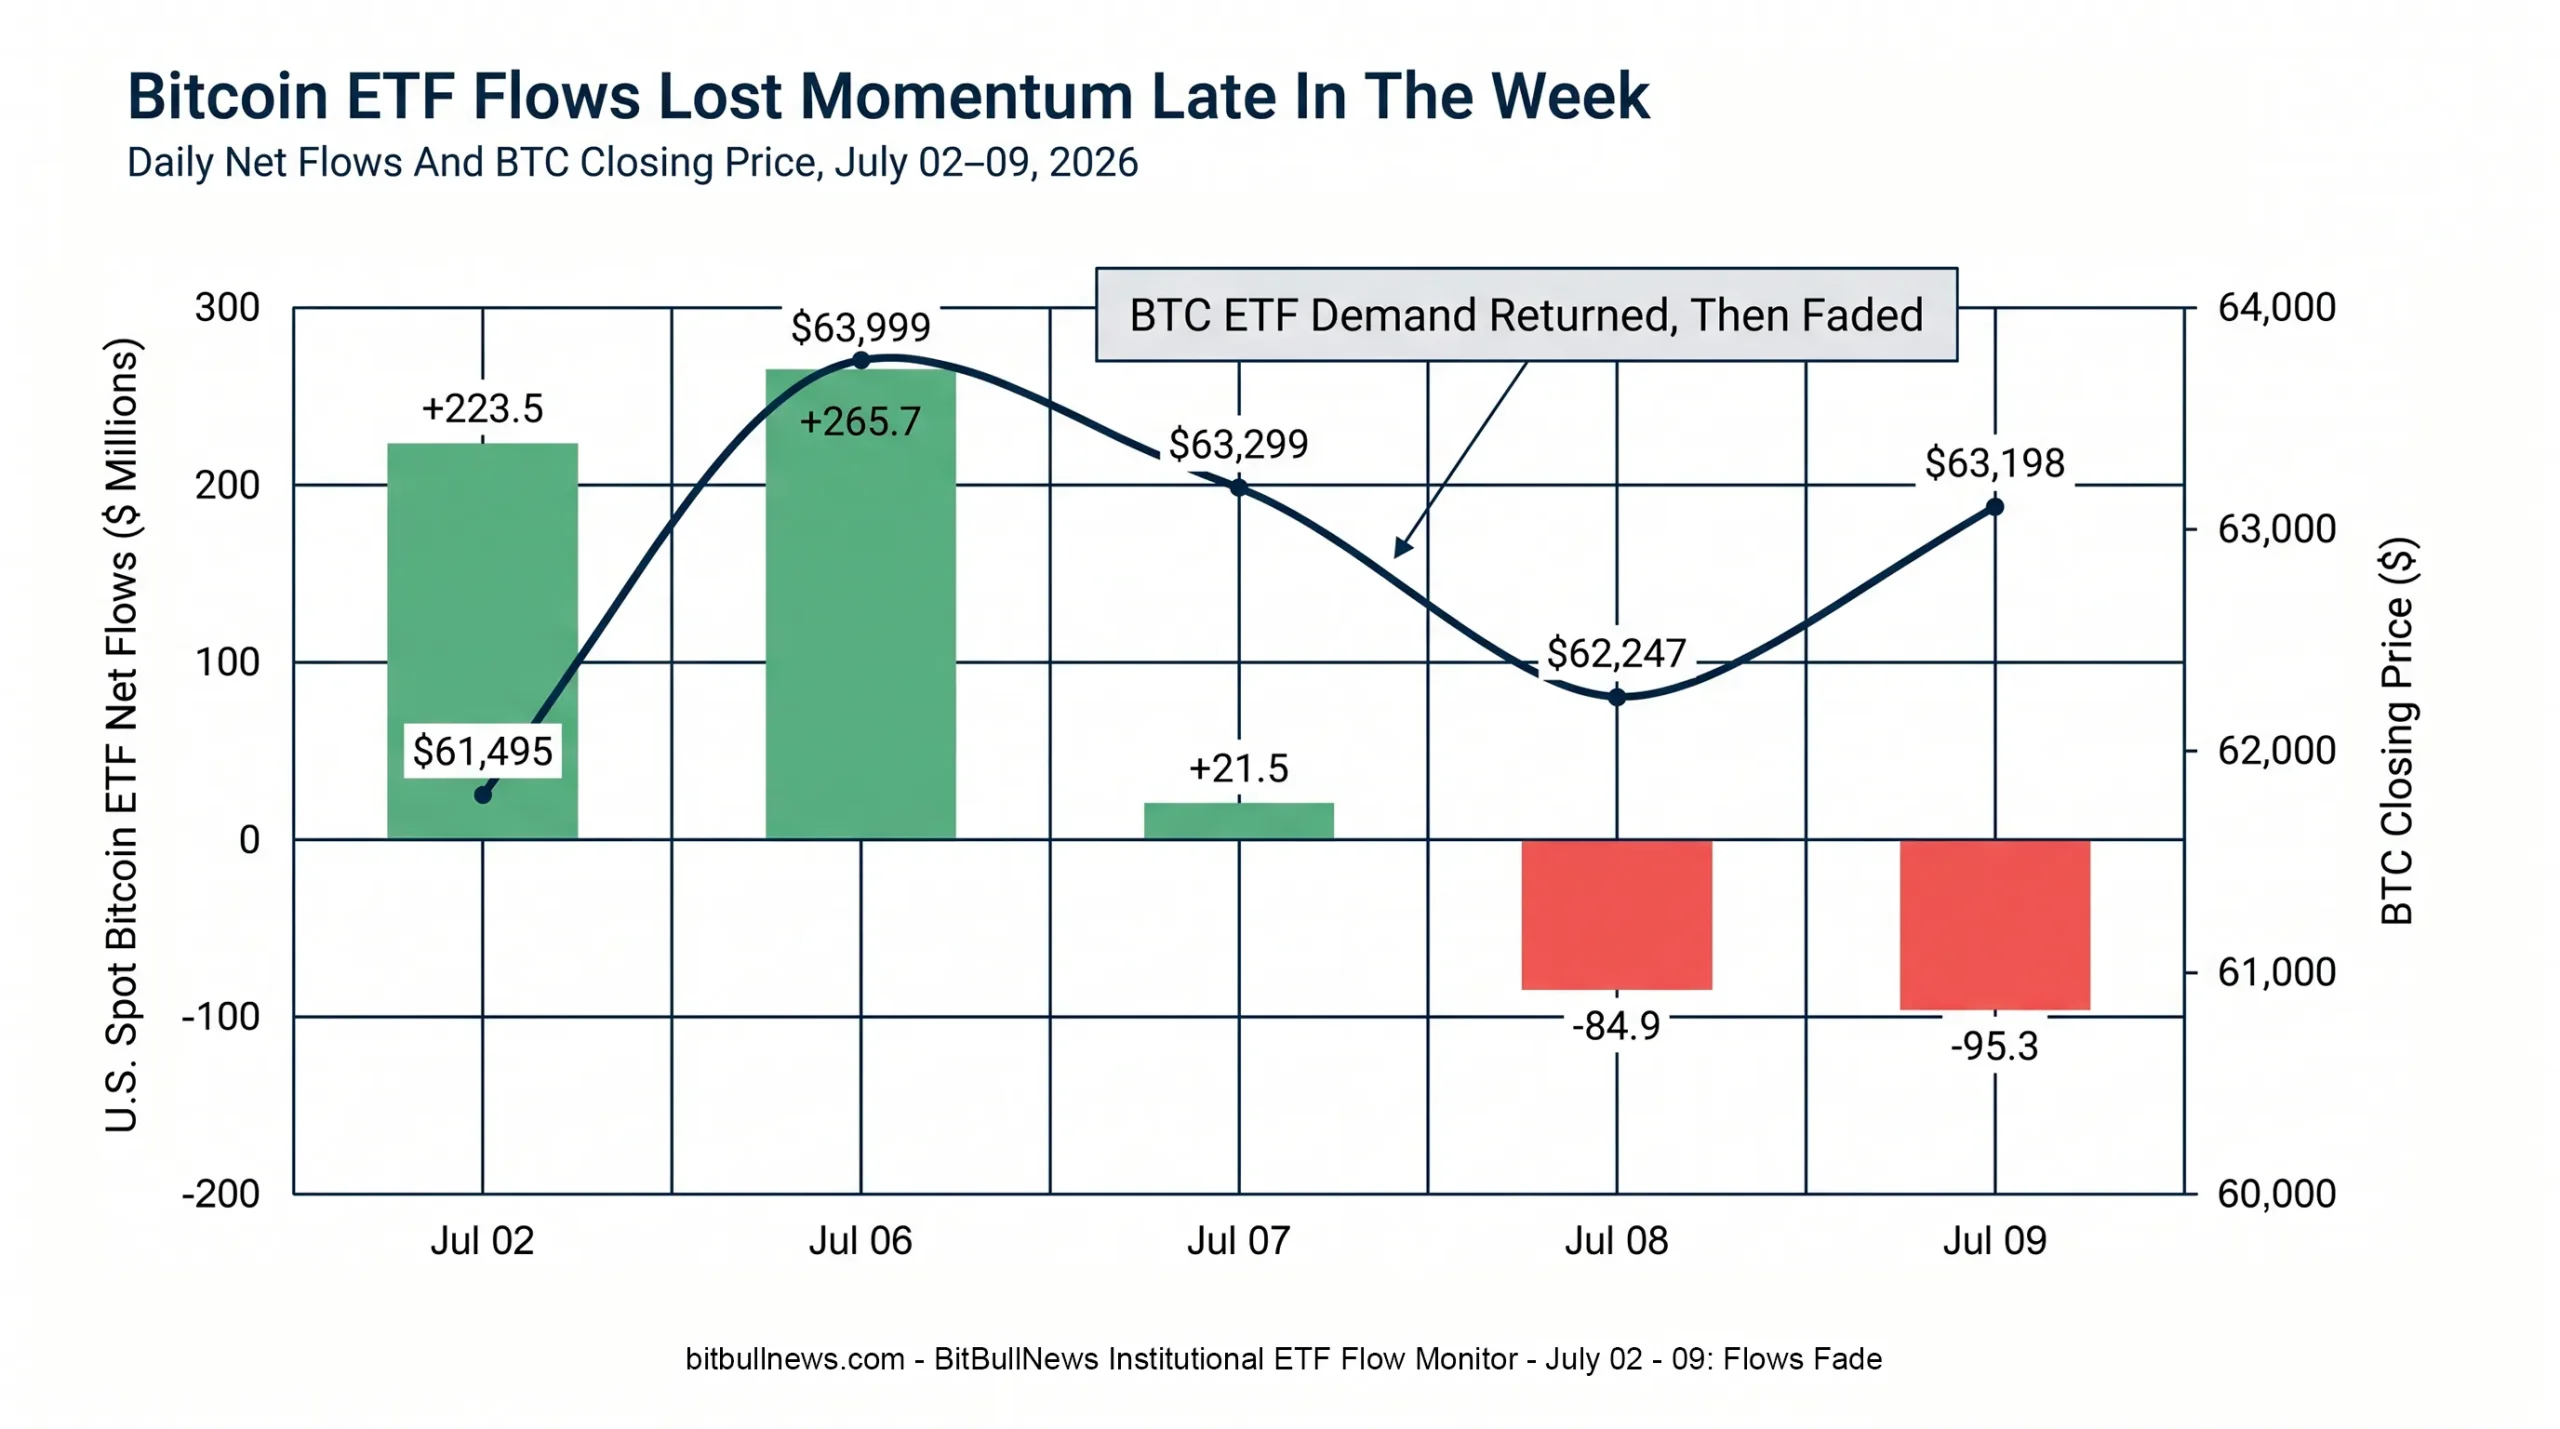
Chart: Line And Bar Combo Showing Daily Bitcoin ETF Net Flows From July 02 To July 09, 2026, Overlaid With BTC Closing Price. Highlight The Shift From July 02 And July 06 Inflows To July 08 And July 09 Outflows.
Market Structure Snapshot
| Metric | July 02 – July 09 Reading | Market Read |
|---|---|---|
| BTC ETF Net Flow | +$330.5M | Positive For The Window, But Reversed Late |
| ETH ETF Net Flow | +$94.9M | Smaller But Cleaner Momentum Until July 09 |
| BTC Price Change | $61,495 To $63,198 / +2.8% | Recovery Held, But Momentum Faded |
| ETH Price Change | $1,698.31 To $1,744.73 / +2.7% | Rebound Tracked BTC Closely |
| Cross-Asset Spot Crypto ETF 24H Flow | -$149.4M | Late-Week Redemption Pressure Returned |
| Tracked Spot Crypto ETF AUM | $64.9B | Institutional Wrapper Still Large |
| Crypto ETF YTD Net Flow | -$5.84B | 2026 Remains A Redemption Year |
CryptoETF.today tracked $64.9 billion in total AUM across BTC, ETH, SOL, XRP, and HYPE spot crypto ETF products, with a 24-hour net flow of -$149.4 million and YTD net inflow of -$5.84 billion as of its July 10 live dashboard. Its 24-hour asset breakdown showed BTC at -$95.3 million, ETH at -$52.2 million, SOL at +$0.4 million, XRP at -$6.6 million, and HYPE at +$4.3 million.
That cross-asset picture lines up with the Farside data. BTC and ETH ended the window under redemption pressure. Smaller products were mixed, but they were not large enough to change the institutional signal.
Bitcoin ETFs: Inflows Returned, Then Broke
Bitcoin ETFs started the window with a strong reversal. After a $296.0 million outflow on July 01, the BTC ETF complex posted +$223.5 million on July 02, +$265.7 million on July 06, and +$21.5 million on July 07. Then flows turned negative again: -$84.9 million on July 08 and -$95.3 million on July 09.
| Date | BTC ETF Net Flow | BTC Close | Market Read |
|---|---|---|---|
| July 02 | +$223.5M | $61,495 | Buyers Returned After Prior Outflow Shock |
| July 06 | +$265.7M | $63,999 | Strongest Flow Day Of The Window |
| July 07 | +$21.5M | $63,299 | Demand Slowed |
| July 08 | -$84.9M | $62,247 | Outflows Returned As Price Fell |
| July 09 | -$95.3M | $63,198 | Redemption Pressure Continued |
The shape is more important than the total. A clean institutional rebound would have produced consistent inflows as BTC recovered from the late-June low. Instead, the ETF bid faded after July 06. That means the week was not a simple “institutions bought the dip” story. It was a partial reallocation, followed by renewed caution.
BlackRock’s IBIT remained the anchor product. Its official iShares page showed $45.61 billion in net assets as of July 08, a 0.25% sponsor fee, 33.7 million shares in daily volume, 47.8 million in 30-day average volume, and a 0.03% 30-day median bid/ask spread. Those are still deep institutional liquidity numbers, even after a difficult year for BTC exposure.
IBIT’s own flow pattern was not one-way. It lost $40.4 million on July 02, absorbed $209.4 million on July 06, added $54.8 million on July 07, then lost $59.1 million on July 08 and showed no flow on July 09. Over the window, IBIT still finished positive at roughly +$164.7 million, but the late-week reversal mattered.
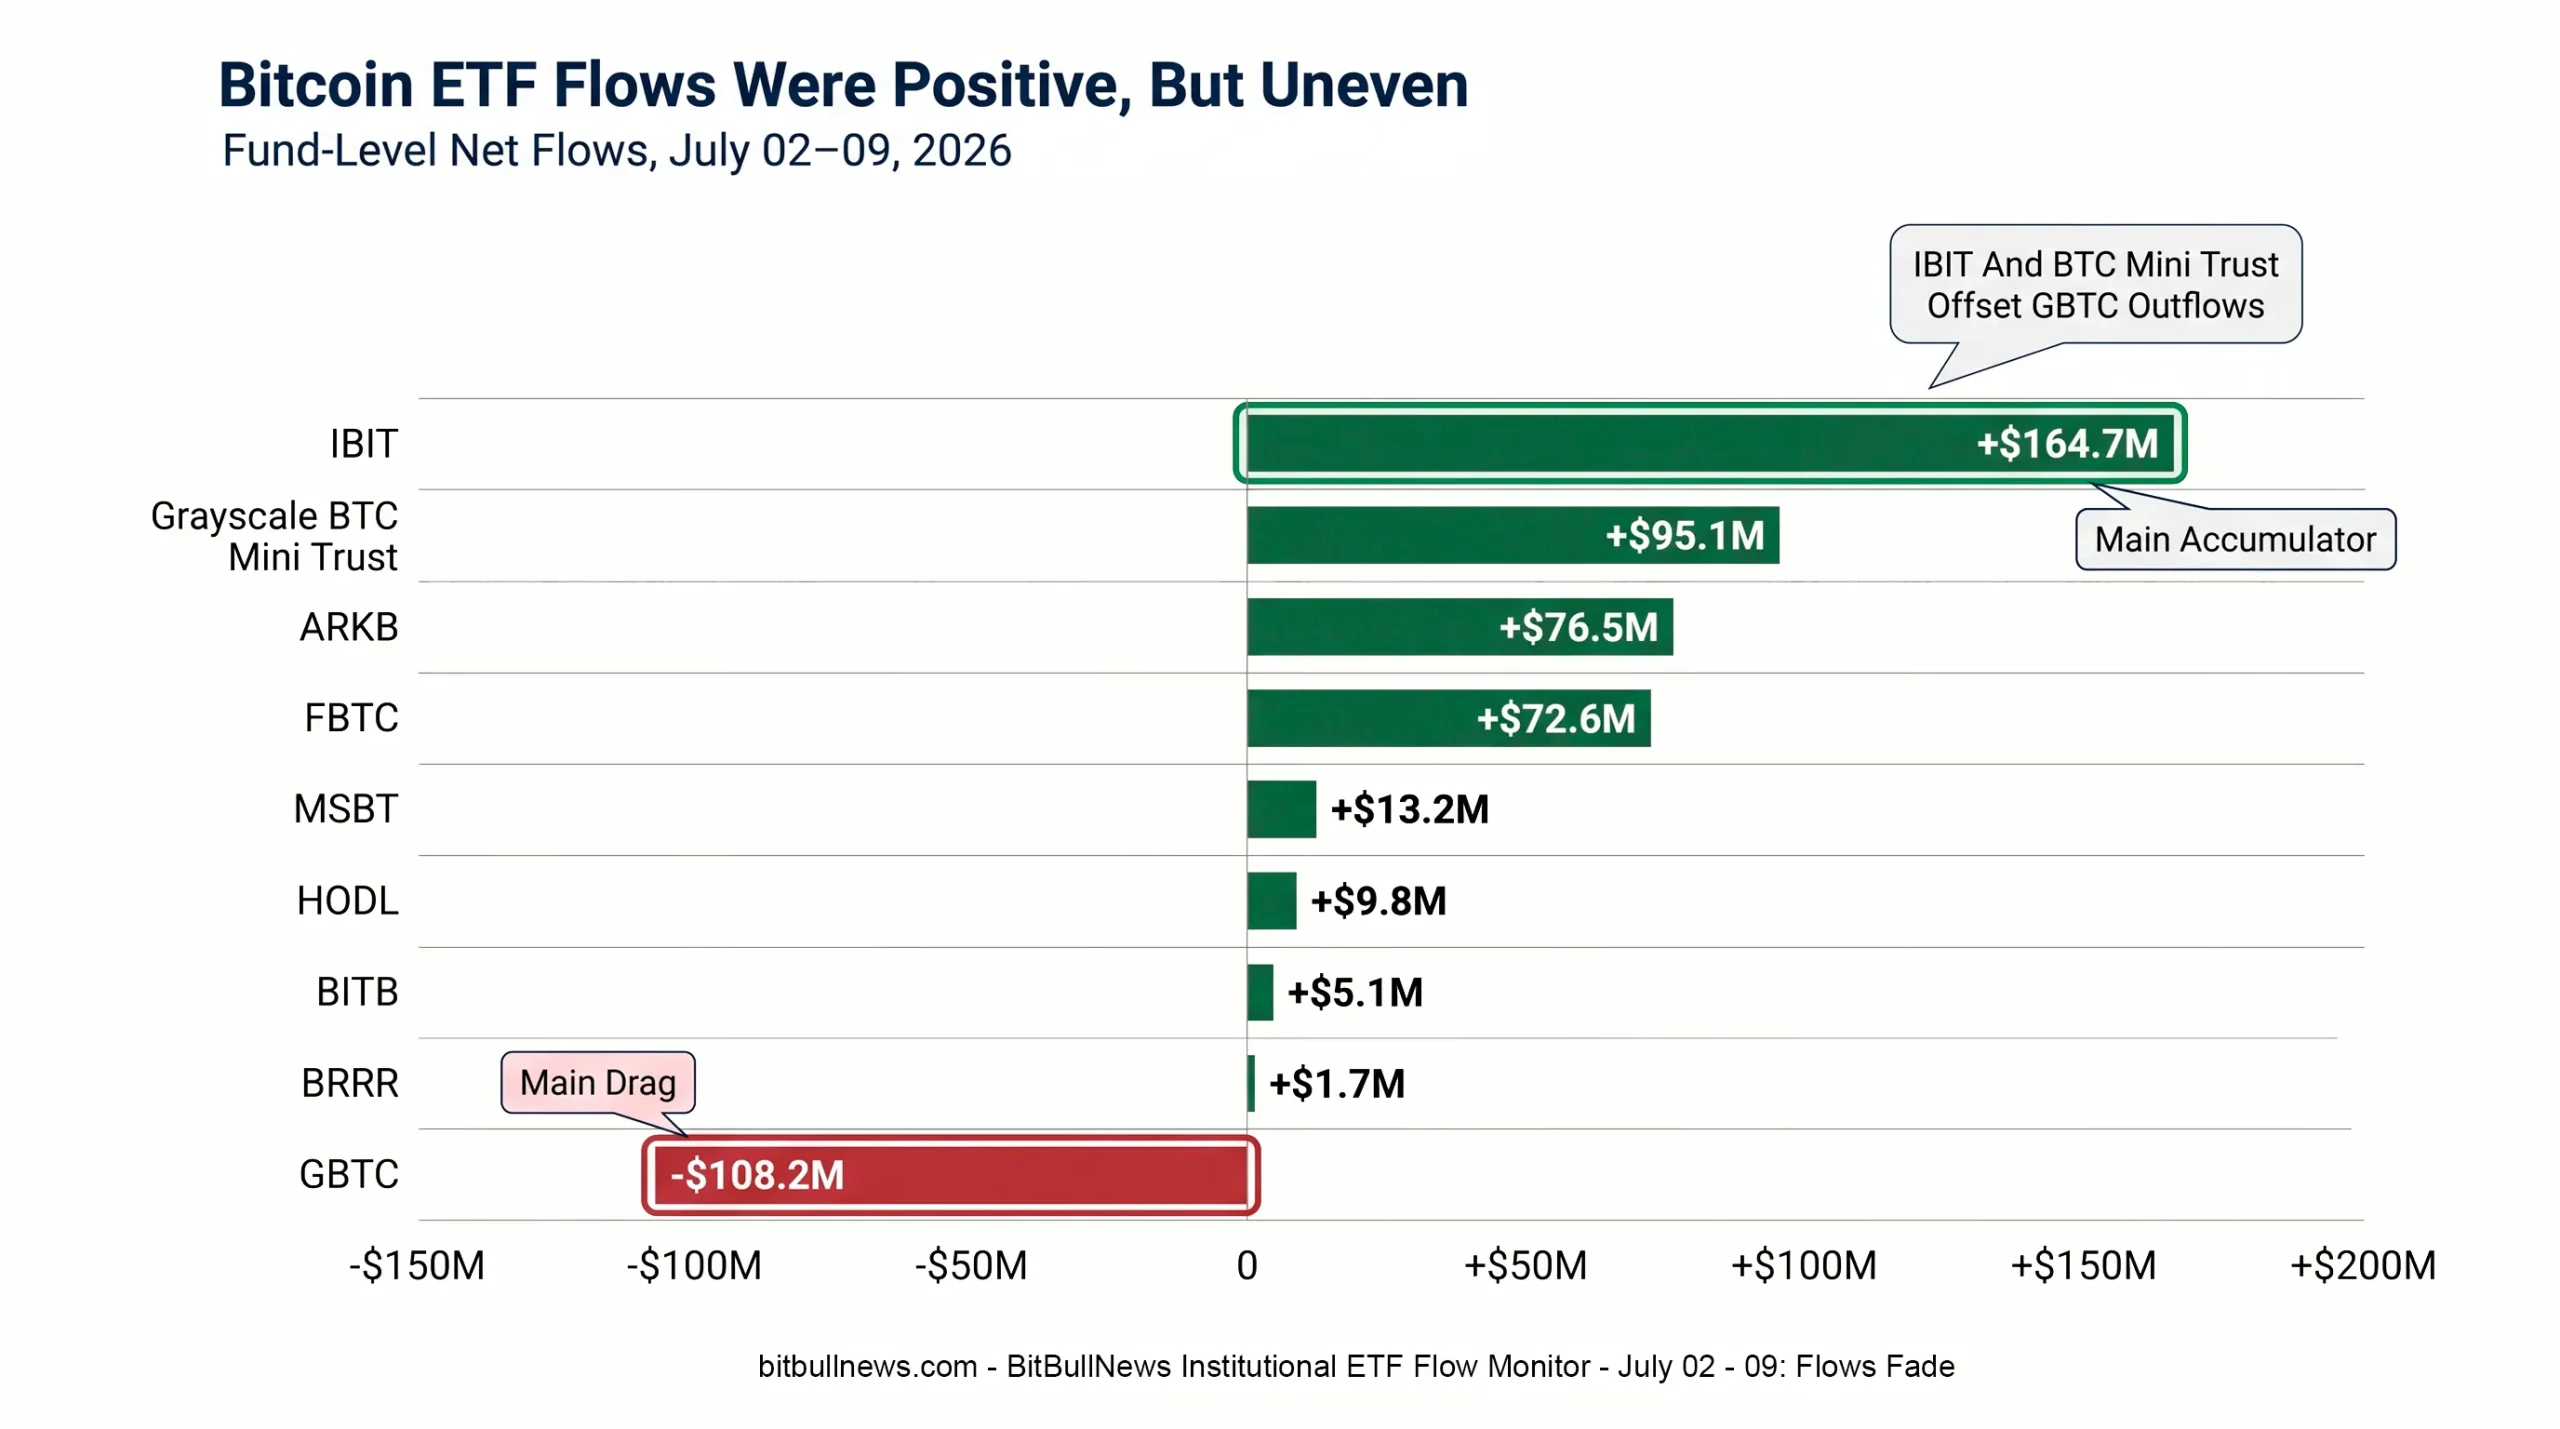
Chart: Stacked Bar Chart Showing Daily Bitcoin ETF Net Flows By Fund From July 02 To July 09. Highlight IBIT, FBTC, ARKB, GBTC, And Grayscale BTC Mini Trust As The Main Drivers.
Bitcoin Fund-Level Breakdown
| Fund | July 02 – July 09 Net Flow | Read |
|---|---|---|
| IBIT | +$164.7M | Still The Main Institutional Accumulator |
| Grayscale BTC Mini Trust | +$95.1M | Low-Fee Grayscale Vehicle Continued To Offset GBTC Bleed |
| ARKB | +$76.5M | Strong Early Inflow, Then July 09 Outflow |
| FBTC | +$72.6M | July 02 Strength Faded Into Late-Week Redemptions |
| MSBT | +$13.2M | Small Positive Contribution |
| HODL | +$9.8M | Modest Inflow |
| BITB | +$5.1M | Mostly Quiet |
| BRRR | +$1.7M | Marginal Inflow |
| GBTC | -$108.2M | Legacy-Fee Overhang Still Visible |
| Total BTC ETFs | +$330.5M | Positive Window, Weak Ending |
GBTC remains the structural outlier. It lost $44.5 million on July 06 and $63.7 million on July 08, while Grayscale’s lower-fee BTC product added $42.3 million on July 06 and $52.8 million on July 08. That is not broad Grayscale rejection. It is fee-sensitive migration inside the same issuer family.
The strongest BTC signal came from IBIT and the BTC Mini Trust. The weakest came from GBTC and late-week FBTC/ARKB redemptions. A durable institutional recovery would need the positive side to broaden again.
Ethereum ETFs: Cleaner Momentum, Smaller Scale
Ethereum ETF flows were steadier than Bitcoin flows until the final session.
Farside showed ETH ETF net flows of +$29.0 million on July 02, +$20.7 million on July 06, +$26.9 million on July 07, +$70.5 million on July 08, and -$52.2 million on July 09. The five-session net was +$94.9 million.
| Date | ETH ETF Net Flow | ETH Close | Market Read |
|---|---|---|---|
| July 02 | +$29.0M | $1,698.31 | Demand Returned |
| July 06 | +$20.7M | $1,798.43 | Inflows Continued Despite Price Strength |
| July 07 | +$26.9M | $1,768.38 | Steady Allocation |
| July 08 | +$70.5M | $1,742.15 | Strongest ETH Flow Day Of The Window |
| July 09 | -$52.2M | $1,744.73 | Momentum Broke Late |
ETH’s July 08 inflow is notable because it arrived on a day when BTC ETFs were already negative. That suggests some investors were still willing to add ETH exposure even as Bitcoin ETF demand softened. But the July 09 outflow erased part of that signal.
The market should not overread one good ETH flow day. ETH ETFs remain smaller than BTC ETFs, and the cross-asset dashboard still showed ETH’s 24-hour flow at -$52.2 million by the end of the window.
| Fund | July 02 – July 09 Net Flow | Read |
|---|---|---|
| ETHA | +$67.2M | Main ETH Accumulator |
| FETH | +$36.0M | July 08 Inflow Helped Offset July 09 Outflow |
| ETHV | -$0.1M | Essentially Flat |
| ETHB | -$2.7M | Small Outflow |
| ETHW | -$2.8M | Small Outflow |
| ETHE | -$2.7M | Legacy Product Still Dragged |
| Total ETH ETFs | +$94.9M | Positive Window, But Late Weakness Returned |
ETHA led the week. FETH also helped, mainly because of the $69.2 million inflow on July 08. ETHE remained a small drag, but the legacy-product bleed was not as dominant as GBTC was in Bitcoin.
The ETH complex looks more balanced than BTC from a fund-flow perspective. The problem is scale. A $94.9 million weekly ETH inflow is constructive, but it does not carry the same market-wide weight as a sustained BTC ETF bid.
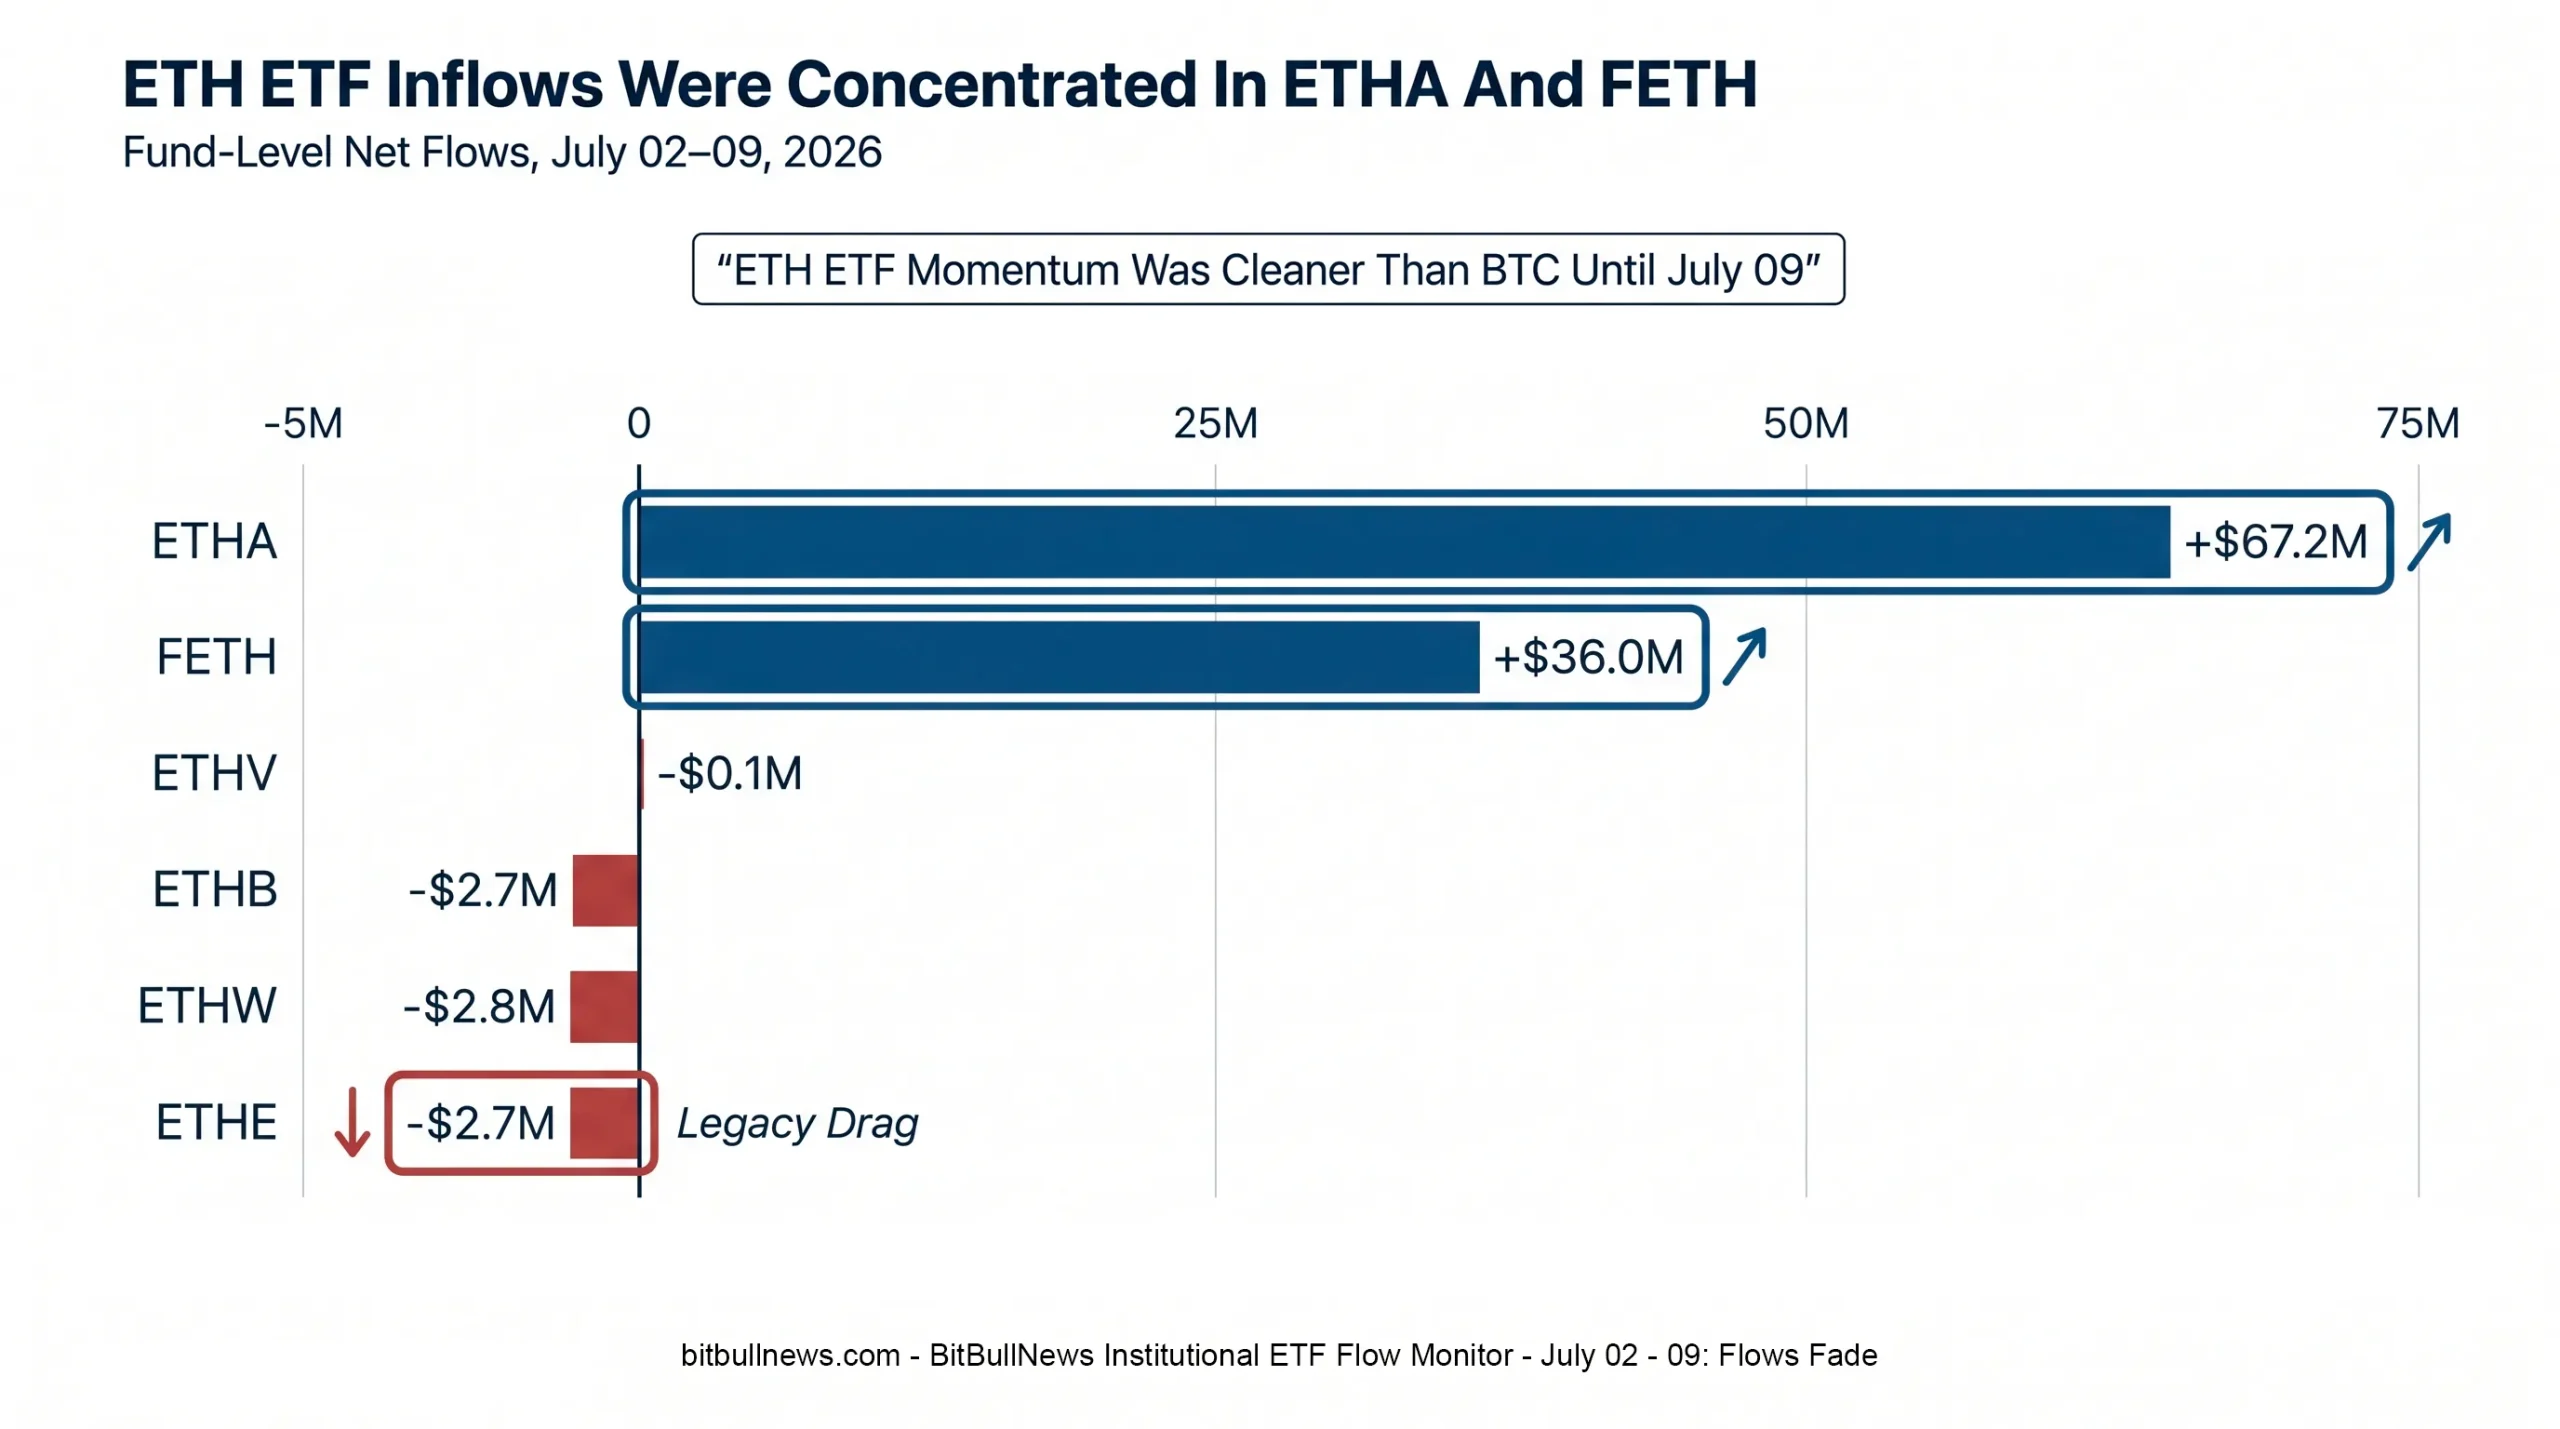
Chart: Horizontal Bar Chart Showing ETH ETF Net Flows By Fund For July 02 – July 09. Highlight ETHA And FETH As Positive Drivers And ETHE As A Small Drag.
Price Action: ETF Demand Helped, But Did Not Lead Cleanly
BTC and ETH both rose across the window, but price action peaked before the flow picture fully improved.
Bitcoin closed at $63,999 on July 06, then slipped to $63,299 on July 07 and $62,247 on July 08 before recovering to $63,198 on July 09. Ether closed at $1,798.43 on July 06, then moved down to $1,768.38, $1,742.15, and $1,744.73 over the next three sessions.
| Asset | July 02 Close | July 06 Close | July 09 Close | Window Change |
|---|---|---|---|---|
| BTC | $61,495 | $63,999 | $63,198 | +2.8% |
| ETH | $1,698.31 | $1,798.43 | $1,744.73 | +2.7% |
The pattern matters. ETF inflows were strongest early in the window, but price momentum did not expand after July 06. That means ETF demand provided support, not breakout fuel.
For traders, this is a different setup from a clean accumulation regime. In a stronger ETF-led tape, inflows tend to reinforce higher closes. This week, flows improved after the late-June washout, but market confidence did not broaden enough to keep BTC and ETH near their weekly highs.
Cross-Asset ETF Flows: BTC And ETH Still Set The Tone
The broader spot crypto ETF universe did not rescue the week.
CryptoETF.today’s live dashboard showed -$149.4 million in 24-hour net flow across BTC, ETH, SOL, XRP, and HYPE products, with BTC and ETH responsible for most of the pressure. SOL and HYPE were positive, but their inflows were too small to offset BTC and ETH redemptions.
| Asset ETF Complex | 24H Net Flow | YTD Net Flow | Read |
|---|---|---|---|
| BTC | -$95.3M | -$5.36B | Still The Main Source Of ETF Pressure |
| ETH | -$52.2M | -$1.36B | Late-Week Weakness Returned |
| SOL | +$0.4M | +$360.7M | Positive But Small |
| XRP | -$6.6M | +$326.3M | Daily Outflow, Still Positive YTD |
| HYPE | +$4.3M | +$193.7M | Small Positive Niche Flow |
| Total Tracked Crypto ETFs | -$149.4M | -$5.84B | Redemption Pressure Still Dominates 2026 |
The YTD numbers are the more important warning. BTC and ETH ETF complexes remain negative for 2026 on the CryptoETF.today dashboard, even after several short-term inflow windows. That makes every weekly rebound more fragile because it is still happening inside a broader redemption year.
What The Flows Actually Mean
This week delivered a recovery, not a regime shift.
The BTC ETF complex absorbed $330.5 million across the window, but more than $489 million came in on July 02 and July 06 alone. After that, demand faded sharply. ETH looked better on sequence, but the July 09 outflow interrupted what had been a clean four-session inflow streak.
ETF flows matter because they capture regulated creation and redemption activity, not just secondary-market trading. CryptoETF.today defines ETF flow as the net dollar value of shares created minus shares redeemed, with positive flows meaning new shares were issued and negative flows meaning redemptions exceeded creations.
That makes this week useful for market structure. It shows that institutional wrappers are still responsive to price weakness. Investors did come back after the late-June selloff. But the late-week reversal shows the bid is tactical, not yet persistent.
Key Anomalies To Watch
The first anomaly is the IBIT flow pattern. IBIT remains the dominant institutional wrapper by liquidity and AUM, yet it showed both a large inflow and sizable outflows inside the same window. That is not a broken product. It is a sign that institutional BTC exposure is being actively traded rather than steadily accumulated.
The second anomaly is the GBTC versus BTC Mini Trust split. GBTC lost $108.2 million across the window, while the lower-fee Grayscale BTC Mini Trust gained about $95.1 million. That looks like internal fee-driven migration rather than a pure issuer-level outflow.
The third anomaly is ETH’s July 08 strength. ETH ETFs took in $70.5 million on July 08 while BTC ETFs lost $84.9 million. That one-day divergence suggests some investors saw relative value in ETH exposure, but it did not survive the next session.
The fourth anomaly is smaller-asset resilience. HYPE and SOL posted positive 24-hour ETF flows on the CryptoETF.today dashboard while BTC and ETH were negative. The dollar amounts were small, but the direction shows that ETF demand is becoming more segmented by asset, not purely risk-on or risk-off across the entire crypto sleeve.
Actionable Signals For Traders, Investors, And Allocators
| Audience | Signal To Watch | Why It Matters |
|---|---|---|
| Traders | BTC ETF Daily Net Flow Versus BTC Close | Positive Flows Without Higher Closes Signal Weak Demand Quality |
| Institutional Allocators | IBIT, FBTC, ARKB, And GBTC Rotation | Shows Whether Demand Is Broad Or Concentrated |
| ETH Traders | ETHA And FETH Flow Momentum | ETH ETF Demand Is More Sensitive To A Few Funds |
| Risk Teams | Two-Day BTC ETF Outflow Streaks | Repeated Redemptions Can Pressure Spot Liquidity |
| Portfolio Managers | BTC / ETH ETF Flow Ratio | Helps Separate Broad Crypto Demand From Asset-Specific Rotation |
For traders, the cleanest signal is not one daily inflow print. It is persistence. BTC needs renewed inflows without heavy late-session redemptions. ETH needs to prove July 09 was a pause, not the start of another outflow sequence.
For allocators, fund-level dispersion matters more than total flow. If IBIT, FBTC, ARKB, and BTC Mini Trust all turn positive together while GBTC outflows shrink, the BTC ETF complex becomes healthier. If inflows depend on one fund while legacy redemptions continue, the structure remains uneven.
For risk teams, the July 08 and July 09 BTC outflows are the warning. The market can recover while ETF demand improves, but if price stalls and ETF redemptions continue, the next move becomes more flow-sensitive.
Key Findings
- U.S. spot Bitcoin ETFs recorded a net +$330.5 million flow across July 02, July 06, July 07, July 08, and July 09.
- Bitcoin ETF flows turned negative at the end of the window, with -$84.9 million on July 08 and -$95.3 million on July 09.
- Ethereum ETFs recorded a net +$94.9 million flow across the same five reported trading sessions.
- ETH ETF flows stayed positive for four reported sessions, then reversed with -$52.2 million on July 09.
- BTC closed at $63,198 on July 09, up from $61,495 on July 02.
- ETH closed at $1,744.73 on July 09, up from $1,698.31 on July 02.
- IBIT reported $45.61 billion in net assets, 33.7 million daily volume, and a 0.03% 30-day median bid/ask spread as of July 08.
- CryptoETF.today tracked $64.9 billion in total spot crypto ETF AUM and -$149.4 million in 24-hour cross-asset net flow.
What To Watch Next
The first watch item is whether BTC ETF flows can turn positive again after two negative sessions. Another outflow print would suggest the July 02 and July 06 inflows were a short-covering-style allocation rebound rather than a durable institutional bid.
The second watch item is ETHA and FETH. ETH ETF demand is still concentrated. If those two funds keep taking in assets, ETH can maintain a stronger ETF signal than BTC. If they weaken together, ETH’s July 08 inflow becomes a one-day anomaly.
The third watch item is GBTC. Continued GBTC outflows are less damaging if BTC Mini Trust inflows offset them. If GBTC outflows accelerate while BTC Mini Trust demand fades, the Grayscale rotation turns into net pressure again.
The fourth watch item is BTC price versus ETF flow. A healthy ETF-led rebound would show positive flow and higher closes. This week showed support, but not confirmation.
BitBullNews View
Institutional crypto ETF demand is not dead. It is cautious, tactical, and increasingly selective.
BTC ETFs took in money across the window, but the final two sessions were negative. ETH ETFs looked better until July 09, then also cracked. Smaller asset ETFs showed pockets of demand, but BTC and ETH still determine the tone because they carry the AUM and the liquidity.
The most important message is quality of flow. A headline weekly inflow can hide a weakening sequence. This week did exactly that. The market finished with positive BTC and ETH ETF totals, but the closing signal was redemption pressure.
That makes next week important. If inflows return quickly, July 08–09 will look like a risk-off interruption. If outflows continue, the early-July ETF recovery will look like a bounce inside a broader 2026 redemption cycle.
Data Sources & References
- Farside Investors — Bitcoin ETF Flow Data
- Farside Investors — Ethereum ETF Flow Data
- CryptoETF.today — Real-Time Spot Crypto ETF Flow Dashboard
- CoinGecko — Bitcoin Historical Market Data
- CoinGecko — Ethereum Historical Market Data
- iShares / BlackRock — iShares Bitcoin Trust ETF IBIT