



Content
The derivatives market ended the week in a stronger position than the spot chart alone suggests.

Bitcoin recovered toward $65,000 after briefly trading below $62,000, but the more important move occurred in Ether. ETH outperformed BTC, attracted a much faster increase in futures open interest and generated more forced liquidations despite its smaller market capitalization.
The structure was not uniformly bullish. Funding stayed only mildly positive, suggesting the market had not returned to an aggressive leveraged-long consensus. The latest CFTC data also showed leveraged funds carrying substantial net-short positions in both CME Bitcoin and Ether futures before the rebound.
That combination — rising prices, moderate funding and a large short base — created the conditions for a squeeze. It did not yet produce the kind of funding excess usually associated with a late-stage leverage chase.
Market Structure Scorecard
| Metric | Bitcoin | Ether | Market Read |
|---|---|---|---|
| Seven-Day Benchmark Return | +1.31% | +5.10% | ETH outperformed BTC by 3.79 percentage points |
| Three-Month Realized Volatility | 38.55% | 53.36% | ETH remained the higher-beta market |
| Aggregated Futures Open Interest | $21.4B | $11.9B | BTC retained the larger absolute derivatives base |
| 24-Hour Open Interest Change | +1.59% | +11.31% | New leverage accumulated much faster in ETH |
| Average Funding Snapshot | +0.0096% | +0.0077% | Longs paid shorts, but rates remained restrained |
| 24-Hour Futures Volume | $31.5B | $24.8B | ETH volume was unusually large relative to its open interest |
| 24-Hour Liquidations | $66.1M | $87.6M | ETH generated more leverage stress than BTC |
Coin Metrics recorded BTC at $64,543 and ETH at $1,877 at the latest available New York close. ETH gained 5.10% over seven days against BTC’s 1.31%, while its three-month volatility remained almost 15 percentage points higher. Coinalyze’s live snapshot showed ETH open interest rising 11.31% in 24 hours, more than seven times BTC’s 1.59% increase.
Data Note: Futures figures in the table use Coinalyze’s all-contract methodology for internal consistency. Open-interest totals from different aggregators should not be combined.
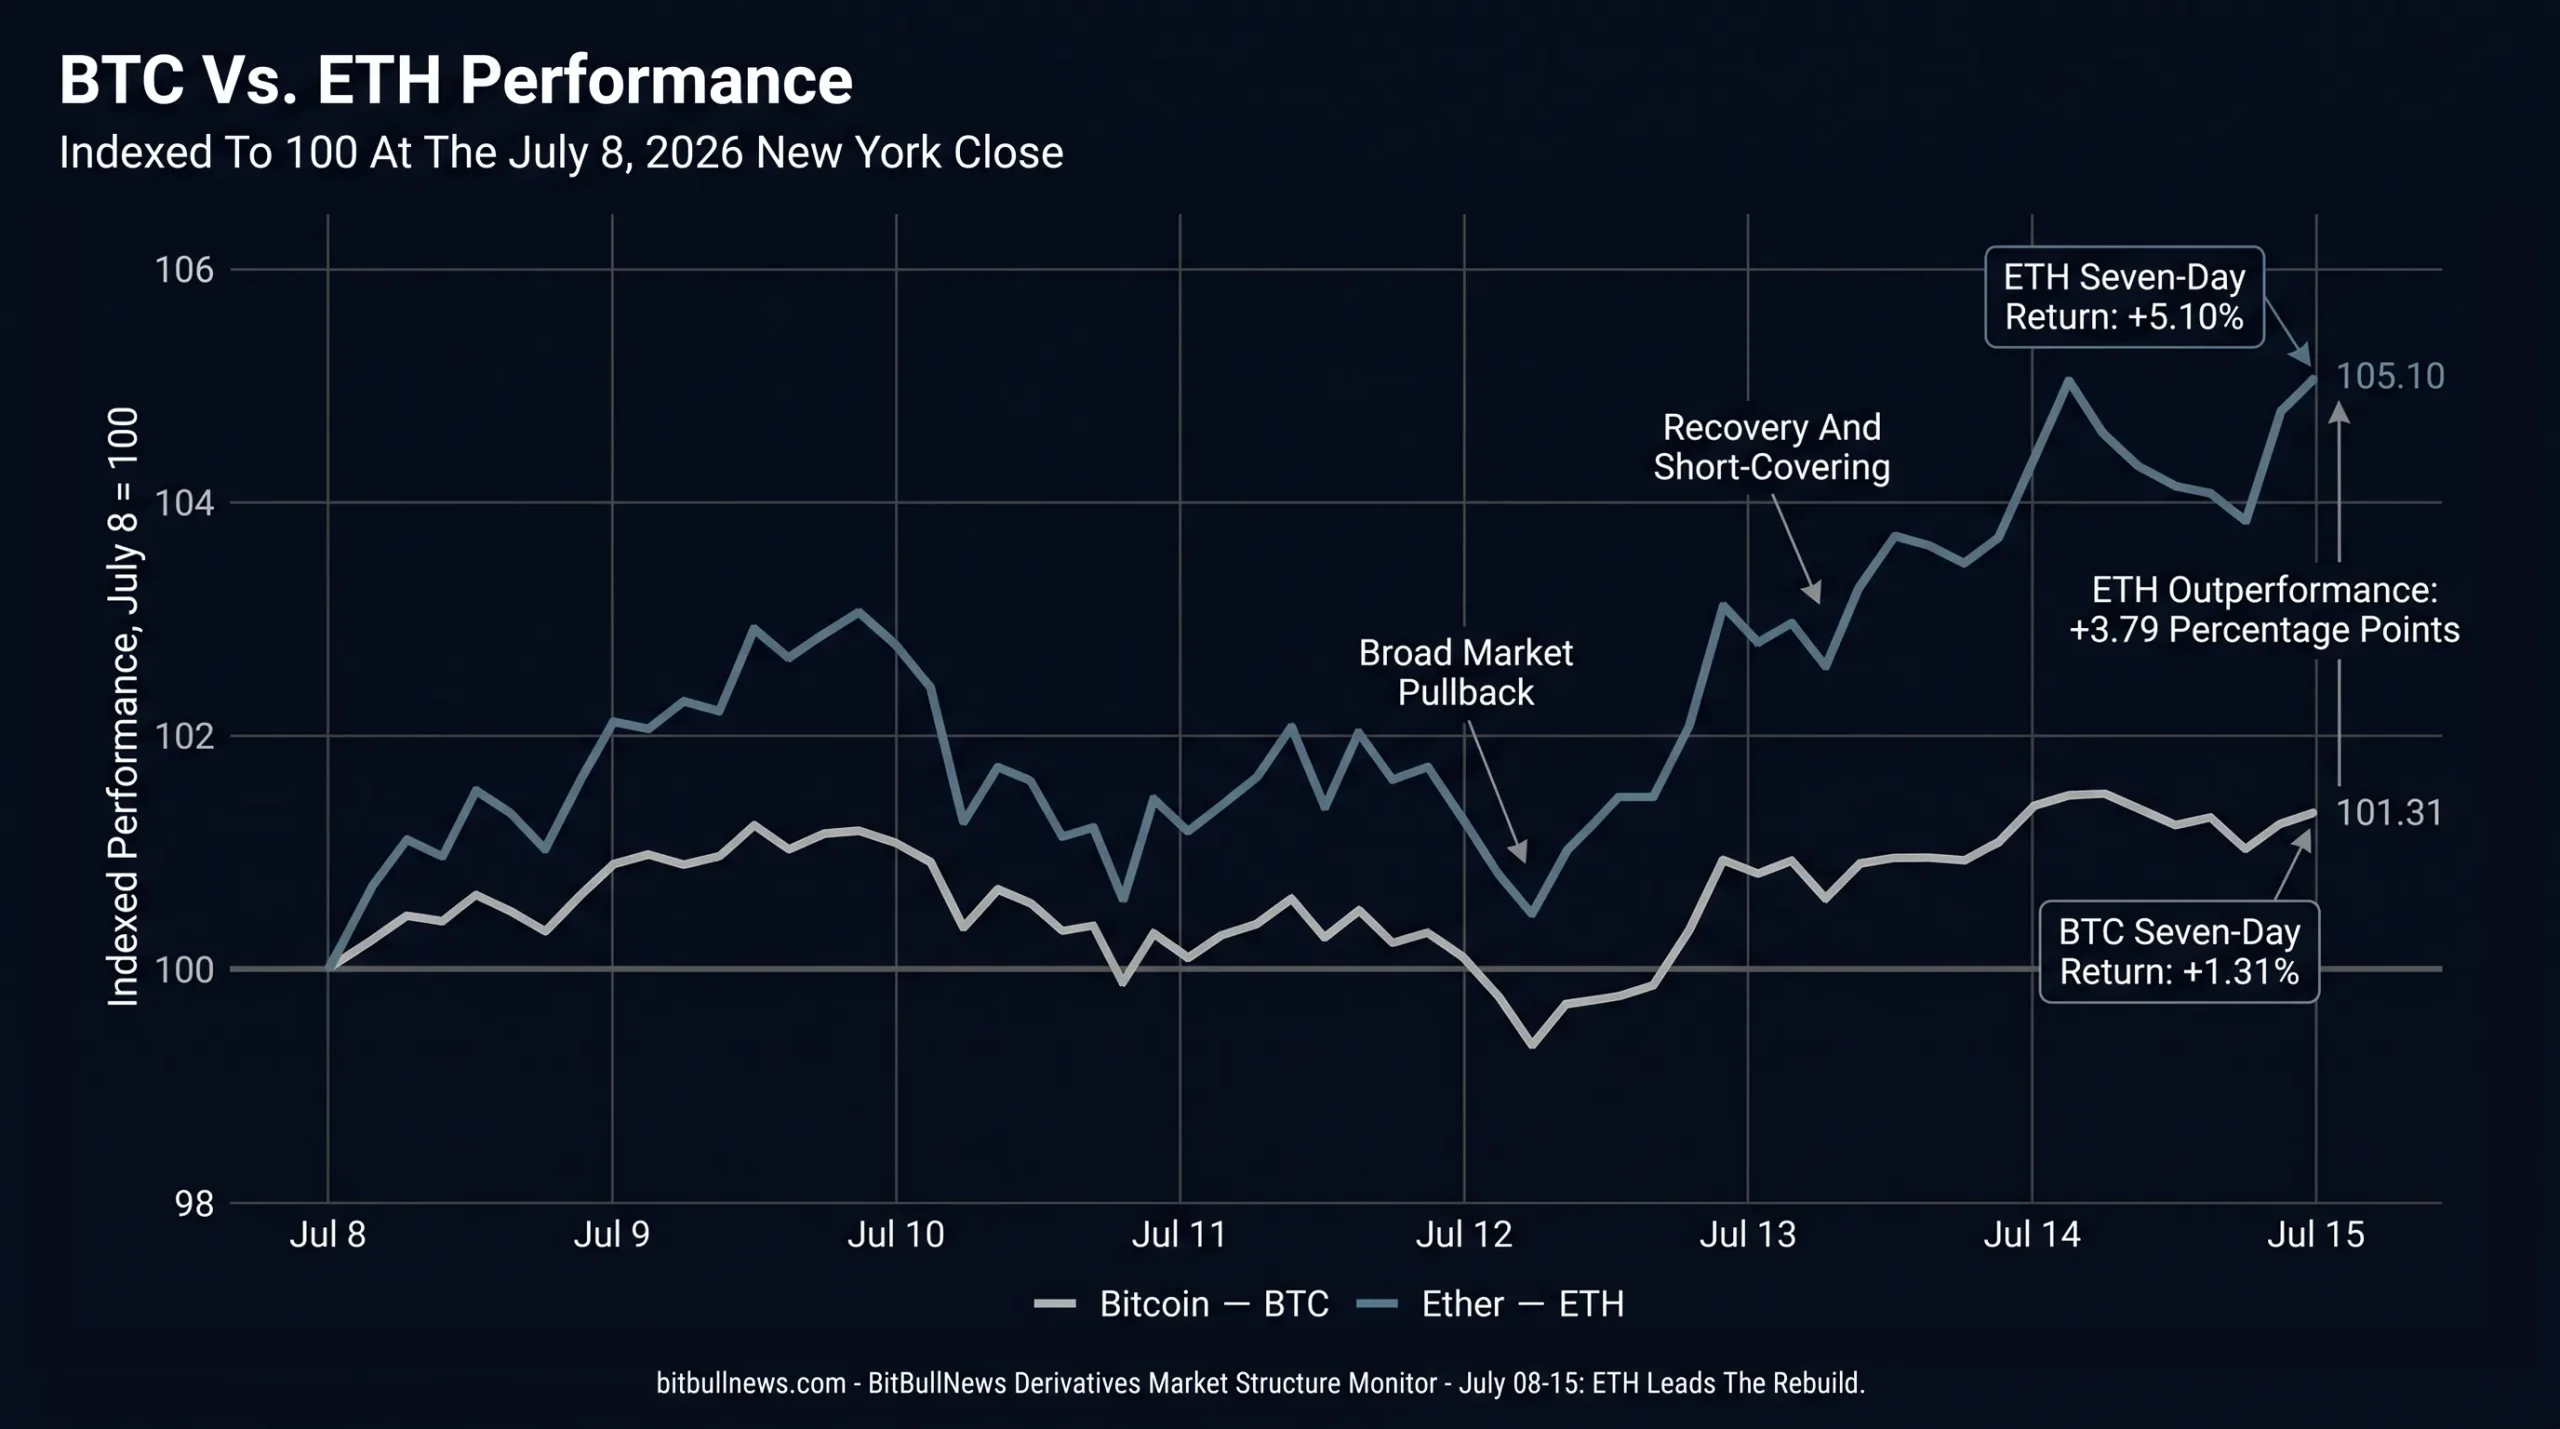
Indexed Line Chart Comparing Daily BTC And ETH Performance From July 8 To July 15, 2026. Set Both Assets To 100 At The July 8 New York Close. Annotate The July 12 Decline And The July 13–15 Recovery. Add A Small Callout Showing Seven-Day Returns Of +1.31% For BTC And +5.10% For ETH.
Ether Became The Center Of The Leverage Rebuild
ETH’s 5.10% seven-day gain was already stronger than Bitcoin’s move. The derivatives data widened that gap.
Coinalyze recorded $11.9 billion in ETH futures open interest, up 11.31% over 24 hours, alongside $24.8 billion in trading volume. The open-interest-to-volume ratio stood at 0.479, compared with 0.677 for Bitcoin. In practical terms, ETH positions were turning over faster while the outstanding contract base expanded sharply.
Three forces appear to have overlapped:
- Existing shorts were forced to cover as ETH moved through the upper end of its weekly range.
- New directional positions entered after the breakout.
- Market makers increased futures hedges against growing options activity.
The funding rate is the key restraint on the bullish interpretation. ETH’s average displayed funding rate was positive at 0.0077%, but it remained below Bitcoin’s 0.0096%. A market dominated by aggressive leveraged longs would usually show a more pronounced increase in the cost of holding perpetual exposure.
Instead, ETH recorded the week’s strongest combination of price gains and open-interest growth without a corresponding funding spike. That is more consistent with a mixture of short covering and balanced new risk than with a one-sided long trade.
The distinction matters. Price rising with open interest and moderate funding can sustain momentum longer than price rising with sharply elevated funding. The latter requires an increasing number of late entrants to keep paying for exposure. The former still has room for positioning to broaden.
The risk is that ETH’s leverage expanded faster than its underlying liquidity. Open interest rose 11.31% in one day while price gained just over 5%. If spot demand stalls, that newly accumulated leverage becomes a source of forced selling rather than support.
Bitcoin Recovered Without A Funding Blowout
Bitcoin’s rebound was less aggressive but arguably cleaner.
The Coin Metrics benchmark closed at $63,182 on July 8, advanced above $64,000 by July 10, dropped to $62,222 on July 12 and recovered to $64,538 on July 13. That sequence produced a rapid deleveraging and rebuilding cycle inside a relatively narrow price band.
By July 15, Coinalyze showed BTC futures open interest at $21.4 billion, up 1.59% over 24 hours. Futures volume reached $31.5 billion and average funding stood at 0.0096%.
The price recovery therefore ran ahead of the leverage recovery. That is generally healthier than a rally in which open interest grows faster than the underlying asset.
CoinGlass’s contemporaneous snapshot produced a higher source-defined open-interest total of approximately $48.5 billion, reflecting different contract coverage and aggregation methods. It also showed futures volume near $64.8 billion. The direction was consistent across providers: BTC activity increased, but its rate of open-interest expansion remained far below ETH’s.
Liquidations were heavily concentrated on traders positioned for further downside. CoinGlass data showed roughly $109.6 million in BTC short liquidations out of $117.6 million total, meaning shorts represented about 93% of the forced closures in that snapshot. ETH showed a similar imbalance, with approximately $116.7 million in shorts liquidated out of $132.7 million.
That explains part of the speed of the rebound. Once price moved through clustered short stops, forced buying added to organic spot demand.
It does not prove that a durable trend reversal has occurred. Short-covering rallies can lose momentum after the vulnerable positions have been removed. The next confirmation must come from sustained spot buying while funding remains controlled.
The Inflation Release Accelerated The Squeeze
The final leg of the move followed the June U.S. inflation report released on July 14.
The Bureau of Labor Statistics reported that headline CPI fell 0.4% month over month, largely because of lower gasoline prices. Core CPI was unchanged during June and rose 2.6% over the prior 12 months. The softer monthly reading reduced immediate rate-pressure concerns and supported a wider recovery in risk assets.
Crypto entered the release with a meaningful bearish futures position still in place. The timing suggests that the inflation surprise acted as a trigger rather than the sole source of demand: the macro catalyst moved prices higher, while derivatives positioning amplified the move through forced covering.
This is why the distinction between a catalyst and market structure matters. The CPI report created the initial impulse. The accumulated short exposure determined how violently futures markets responded.
CME Positioning Shows A Split Institutional Market
The latest CFTC report available during the monitoring period covered positions held on July 7 and was released on July 10.
It showed a clear divide between asset managers and leveraged funds.
| CME Contract | Open Interest | Weekly OI Change | Asset Manager Net | Weekly Net Change | Leveraged Fund Net | Weekly Net Change |
|---|---|---|---|---|---|---|
| Bitcoin Futures | 18,832 | +496 | +2,385 | +385 | -6,717 | -1,404 |
| Ether Futures | 21,746 | +271 | -2,109 | +929 | -7,309 | -2,618 |
Net positions are calculated as reported long contracts minus reported short contracts. Weekly changes are calculated from the CFTC’s June 30 comparison.
Asset managers held 4,790 long and 2,405 short standard CME Bitcoin futures, leaving the category net long by 2,385 contracts. Leveraged funds held 4,406 longs against 11,123 shorts, creating a net-short position of 6,717 contracts. Leveraged funds made that short position 1,404 contracts more negative during the week.
Ether positioning was even more defensive. Asset managers remained net short by 2,109 contracts, although their net exposure improved by 929 contracts. Leveraged funds were net short by 7,309 contracts after increasing their bearish imbalance by another 2,618 contracts.
The data predates the July 13–15 rebound, so it cannot show how much of that exposure survived. It does reveal the starting point.
A large leveraged-fund short does not automatically represent a directional bet against crypto. Some positions hedge spot holdings, ETFs, options books or offshore exposure. Still, a growing net short creates buying pressure when prices rise and risk limits force those positions to be reduced.
The positioning also explains why ETH reacted more sharply. Leveraged funds had expanded their net Ether short almost twice as much as their Bitcoin short during the reporting week. ETH then produced the larger spot gain and the faster increase in open interest.
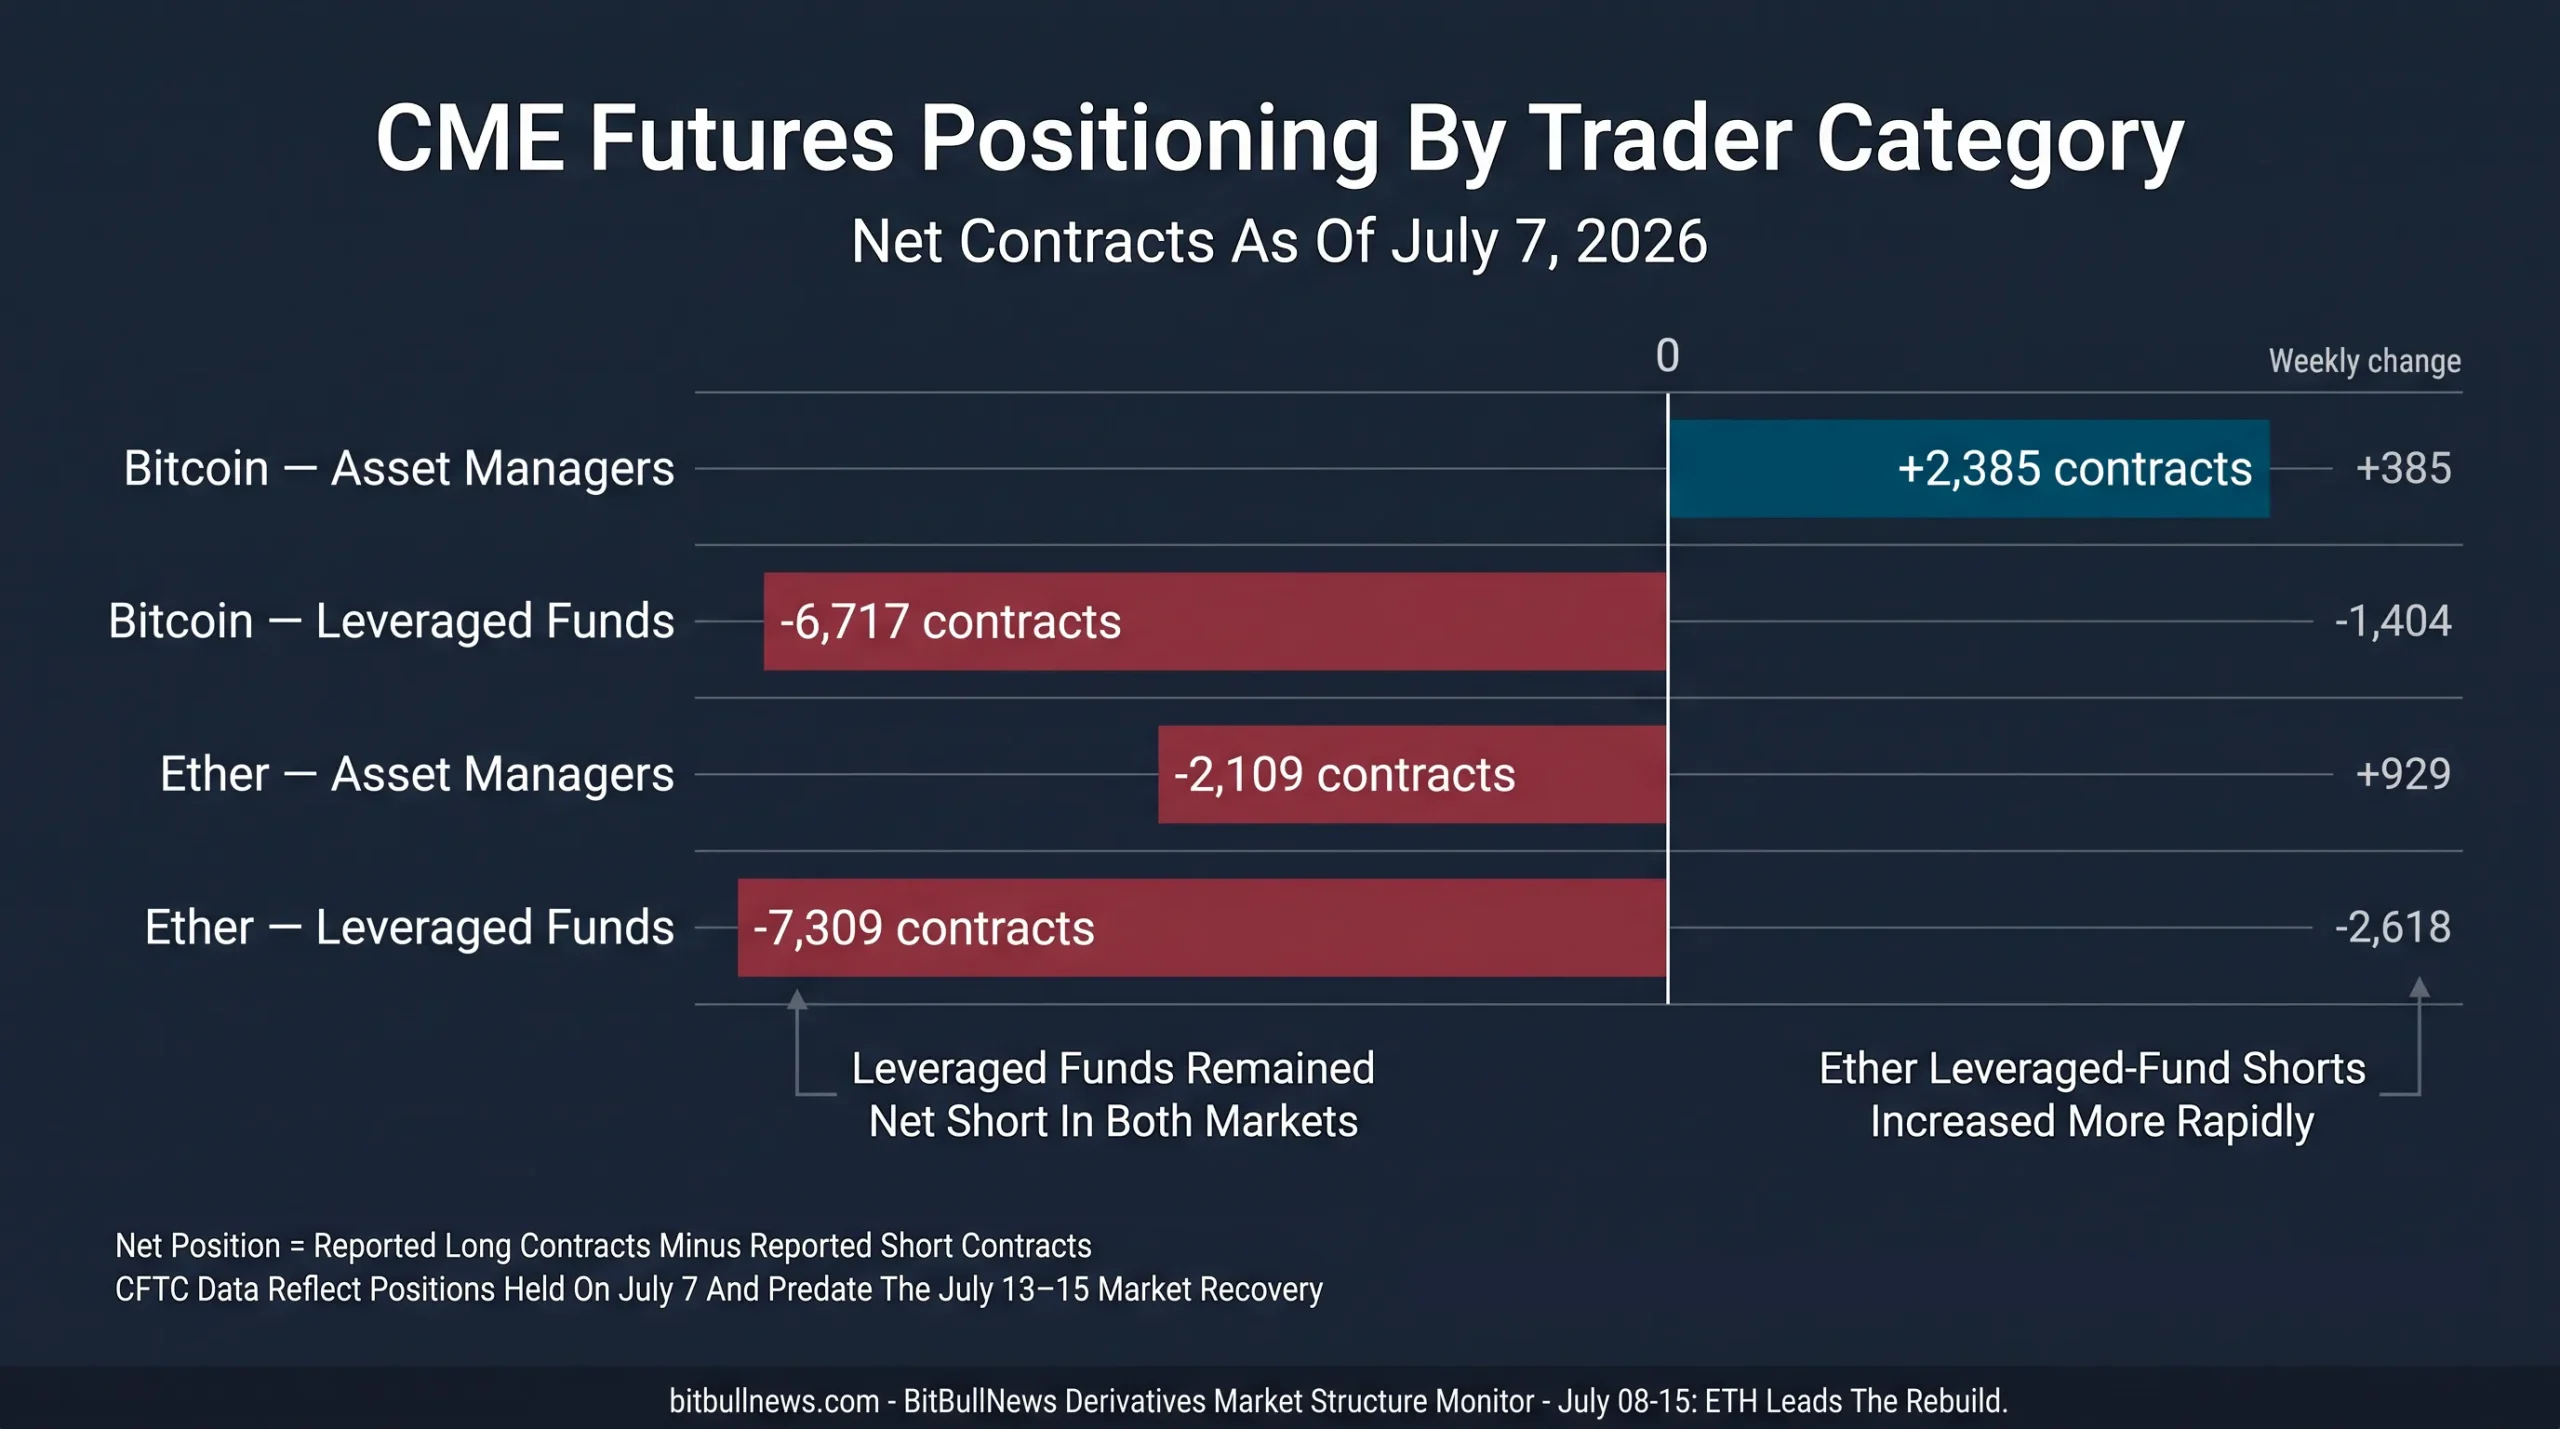
Grouped Horizontal Bar Chart Showing Net CME Futures Positions As Of July 7, 2026. Display Asset Managers And Leveraged Funds Separately For Bitcoin And Ether. Use Positive Bars For Net Long Exposure And Negative Bars For Net Short Exposure. Add Weekly Net Changes Beside Each Bar.
Options Shifted Toward Upside Participation
The July 10 options expiry removed roughly $1.7 billion in combined BTC and ETH notional exposure. Available snapshots placed Bitcoin’s put-to-call ratio close to 0.97 and its maximum-pain level around $62,000, indicating a relatively balanced near-term book before expiration.
The post-expiry structure was considerably more call-heavy.
Loris Tools recorded $27.05 billion in total Deribit options open interest, with BTC accounting for $24.13 billion and ETH for $2.90 billion. BTC and ETH put-to-call ratios stood at 0.55 and 0.56 respectively.
| Options Metric | Bitcoin | Ether |
|---|---|---|
| Deribit Open Interest | $24.13B | $2.90B |
| 24-Hour Options Volume | $1.83B | $286.50M |
| At-The-Money Implied Volatility | 30.68% | 39.55% |
| Put-To-Call Ratio | 0.55 | 0.56 |
| Active Expiries | 11 | 11 |
| Active Instruments | 846 | 678 |
ETH options priced almost 8.9 volatility points above BTC. That premium broadly matches the underlying market: Coin Metrics showed ETH’s three-month realized volatility at 53.36%, against 38.55% for Bitcoin.
Calls outnumbering puts does not mean every option trader is positioned for higher prices. Calls may be sold, used in spreads or offset against futures and spot exposure. The ratio nevertheless shows where gross demand and dealer hedging requirements are concentrated.
BTC options exposure was also highly concentrated by maturity:
- July 31: $6.37 billion
- December 25: $5.94 billion
- September 25: $5.85 billion
- August 28: $2.01 billion
- March 26, 2027: $1.55 billion
The three largest expiries represented approximately $18.16 billion, or 75.3% of Deribit’s BTC options open interest.
That concentration increases the importance of dealer gamma and hedge adjustments around the end of July and the September quarterly expiry. It also means headline options open interest overstates how evenly risk is distributed across the calendar.
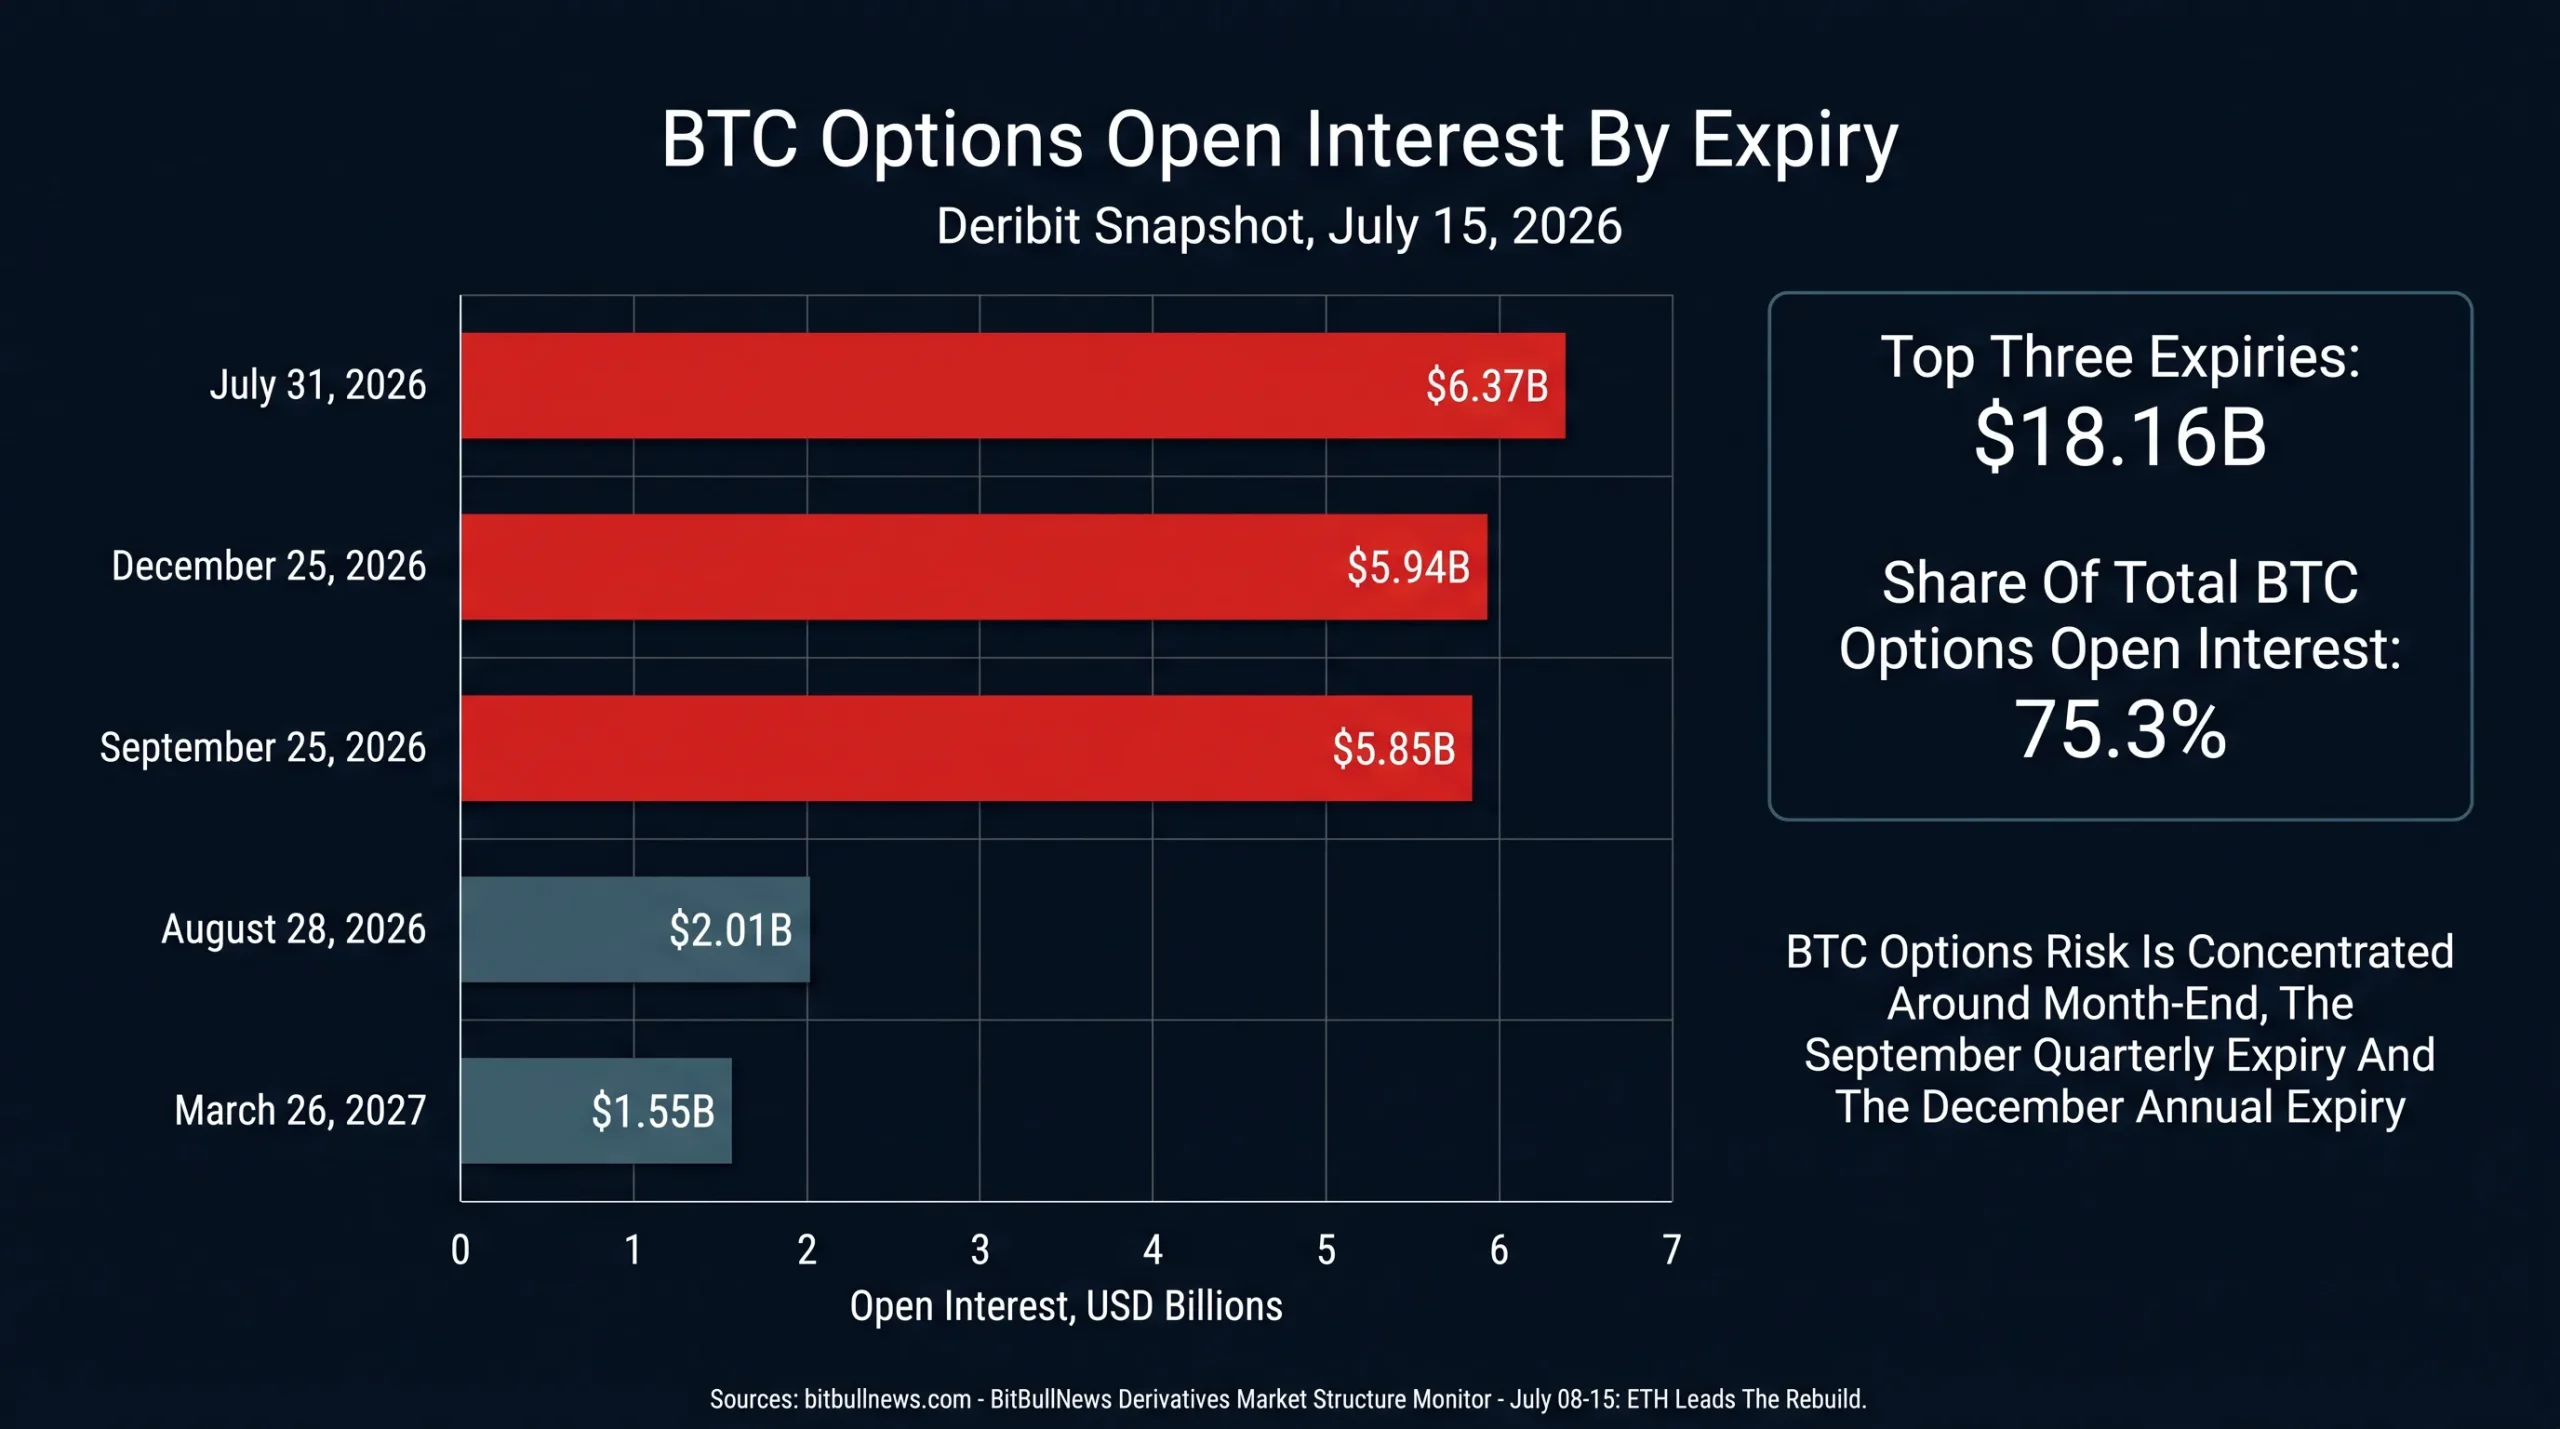
Horizontal Bar Chart Showing Deribit BTC Options Open Interest By Expiry. Highlight July 31 At $6.37B, September 25 At $5.85B And December 25 At $5.94B. Add A Callout Showing That The Three Expiries Account For 75.3% Of Total BTC Options Open Interest.
Implied Volatility Still Prices A Controlled Market
BTC at-the-money implied volatility of 30.68% was below its three-month realized volatility of 38.55%. ETH showed the same relationship, with 39.55% implied against 53.36% three-month realized volatility.
The comparison is not perfectly matched because the displayed ATM measure reflects an options term-structure snapshot rather than a fixed three-month maturity. Still, the gap indicates that options were not pricing a repeat of the volatility experienced over the previous quarter.
That creates two possible readings.
First, the market may expect volatility to continue declining after the severe first-half drawdown. In that case, current option pricing is reasonable.
Second, option sellers may be underpricing the interaction between concentrated expiries, geopolitical risk and a large futures short base. Under that scenario, volatility could reprice quickly if BTC breaks out of the recent $62,000–$65,000 range or ETH establishes itself above the week’s highs.
The structure does not justify a simple “options are cheap” conclusion. Traders must compare implied volatility against the specific holding period, strike and expected catalyst set. The current data only shows that the market is not charging an extreme premium for uncertainty.
Open Interest Is Not A Universal Number
One of the week’s largest apparent anomalies was the difference between data providers.
Coinalyze reported $21.4 billion in BTC open interest and $11.9 billion in ETH open interest. CoinGlass displayed approximately $48.5 billion and $27.1 billion respectively.
That does not mean one provider observed a sudden doubling of leverage.
Aggregated totals vary because providers make different choices around:
- Exchange coverage.
- Perpetual and dated-futures inclusion.
- Coin-margined contract conversion.
- Contract multipliers.
- Stablecoin-denominated markets.
- Duplicate or economically similar products.
- Refresh times and inactive contracts.
Historical academic work has also identified inconsistencies in open-interest and liquidation reporting across some crypto derivatives venues. A 2023 tick-level study found that changes reported by several exchanges could not always be reconciled with the trading volume required to produce them.
The practical rule is simple: compare trends within the same provider and methodology. Do not calculate weekly changes using one source’s opening value and another source’s closing value.
For BitBullNews monitoring, Coinalyze provides the consistent cross-asset snapshot used in the principal tables. CoinGlass is used separately for venue distribution and directional liquidation data.
Regulated And Offshore Carry Remain Fragmented
CME futures, ETF options and offshore perpetuals do not operate as one fully unified pool of collateral.
A May 2026 working paper comparing implied carry in IBIT options with CME Bitcoin futures found an average wedge of 2.58 percentage points across 386 observations. The authors linked the gap to segmented margin systems, balance-sheet costs and limits on cross-market arbitrage.
That helps explain why CME positioning can look heavily short while offshore perpetual funding remains only mildly positive.
A fund may hold spot or ETF exposure and hedge through CME futures. An offshore trader may hold the opposite position through a stablecoin-margined perpetual. Without efficient cross-margining, the difference can persist longer than a textbook cash-and-carry model would imply.
The market should therefore avoid treating CME leveraged-fund shorts as equivalent to unhedged directional shorts on Binance, Bybit or OKX. Both can amplify price moves, but their economic motivations and liquidation mechanics differ.
Key Signals For The Next Monitoring Period
Bitcoin Funding Versus Open Interest
Funding near 0.01% remains manageable. The risk signal would be open interest continuing to rise while funding moves several multiples above the current range. That would indicate that traders are paying increasingly high carrying costs to maintain long exposure.
Ether Open Interest Versus Spot Volume
ETH open interest expanded 11.31% in one day. Continued price gains supported by spot volume would validate the buildup. Flat or declining spot volume alongside further futures growth would indicate leverage running ahead of underlying demand.
The $62,000–$65,000 Bitcoin Range
The July 10 options expiry centered close to $62,000, while BTC repeatedly traded around $64,000–$65,000 later in the week. A sustained move outside that zone would force a new round of hedge adjustments. Remaining inside it would allow implied volatility and funding to normalize.
July 31 Options Concentration
The July 31 BTC expiry carried $6.37 billion in open interest, the largest single maturity on Deribit. Strike-level positioning within that expiry should be watched more closely as month-end approaches. Large call concentrations can accelerate a rally through dealer hedging, but they can also suppress price if dealers are long gamma.
The Next CFTC Report
The July 7 CFTC snapshot captured the short buildup before the rebound. The next release will show whether leveraged funds covered exposure or continued adding shorts into higher prices. That change will be more informative than the absolute net position alone.
Derivatives Risk Dashboard
| Signal | Current Reading | Interpretation | Risk Trigger |
|---|---|---|---|
| BTC Funding | Mildly Positive | Long demand present but not crowded | Funding rises sharply while price stalls |
| ETH Funding | Positive And Below BTC | ETH rally not yet driven by extreme long costs | Funding accelerates after OI has already expanded |
| BTC Open Interest | Moderate 24-Hour Growth | Leverage rebuilding behind price | OI rises faster than spot demand |
| ETH Open Interest | +11.31% In 24 Hours | Strong re-risking and short covering | Price weakens while OI remains elevated |
| CME Leveraged Funds | Net Short BTC And ETH | Short base can amplify upward moves | Shorts cover after price has already extended |
| BTC Options Concentration | 75.3% In Three Expiries | Hedge risk concentrated in a few dates | Rapid spot move near July 31 or quarterly expiry |
| ATM Implied Volatility | Below Recent Realized Volatility | Market expects calmer conditions | New macro or geopolitical shock reprices volatility |
A Fragile Recovery
Ether led this week’s derivatives recovery.
Its price outperformed Bitcoin, open interest expanded more than seven times faster and liquidations exceeded BTC’s total. Funding remained contained, which argues against describing the move as a fully crowded leveraged-long trade. The cleaner interpretation is a combination of short covering, fresh positioning and increased options hedging.
Bitcoin’s structure was steadier. Price recovered faster than leverage, funding remained close to its standard positive range and the short-heavy liquidation profile showed that bearish positioning supplied part of the buying pressure.
The principal risk has now shifted. At the start of the week, the immediate threat came from downside momentum and defensive positioning. By July 15, the more relevant question was whether newly created ETH leverage and concentrated BTC options exposure could absorb another reversal.
The next durable move will require confirmation from spot markets. If price rises while funding remains moderate and open interest grows at a controlled pace, the derivatives structure can support further recovery. If open interest keeps expanding without corresponding spot demand, the market will have rebuilt the same fragility that the July rebound just punished.
Data Sources & References
- Coin Metrics CMBI Bitcoin Benchmark
- Coin Metrics CMBI Ethereum Benchmark
- Coinalyze Cryptocurrency Futures Market Data
- CoinGlass Bitcoin Futures Data
- CoinGlass Ethereum Futures Data
- CoinGlass Options Market Data
- Deribit Bitcoin Options
- Deribit Ether Options
- Loris Tools Deribit Options Dashboard
- CFTC Commitments Of Traders Reports
- CFTC Traders In Financial Futures Report
- U.S. Bureau Of Labor Statistics — June 2026 CPI
- Reconciling Open Interest With Traded Volume In Perpetual Swaps
- Implied ETF Carry Rates And The Limits Of Arbitrage In Segmented Bitcoin Markets