


BBN Data: Oil Shock Breaks Bitcoin’s Benchmark Recovery As Gold And Emerging Markets Fall Behind (July 10–17)

Content
Bitcoin’s two-week clean sweep across the BitBullNews benchmark family ended abruptly between July 10 and July 17.
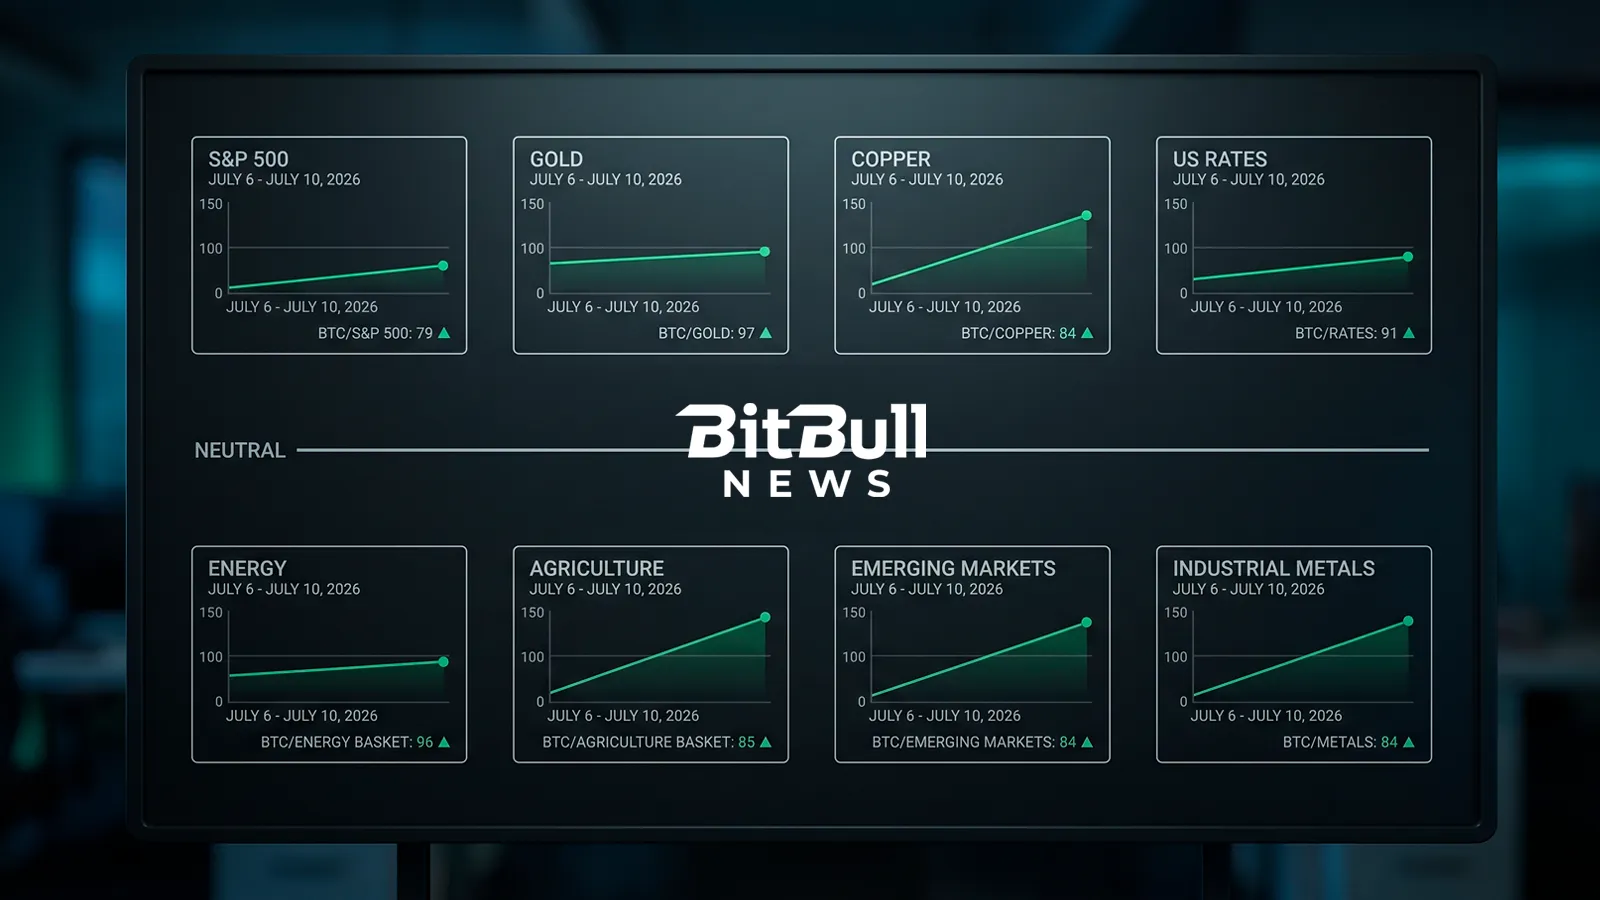
Only two of the eight readings improved. BTC/Gold rose from 97 to 99, while BTC/Emerging Markets advanced from 84 to 86. Bitcoin lost relative ground against equities, copper, industrial metals, rates and agriculture, but the dominant move came from energy.
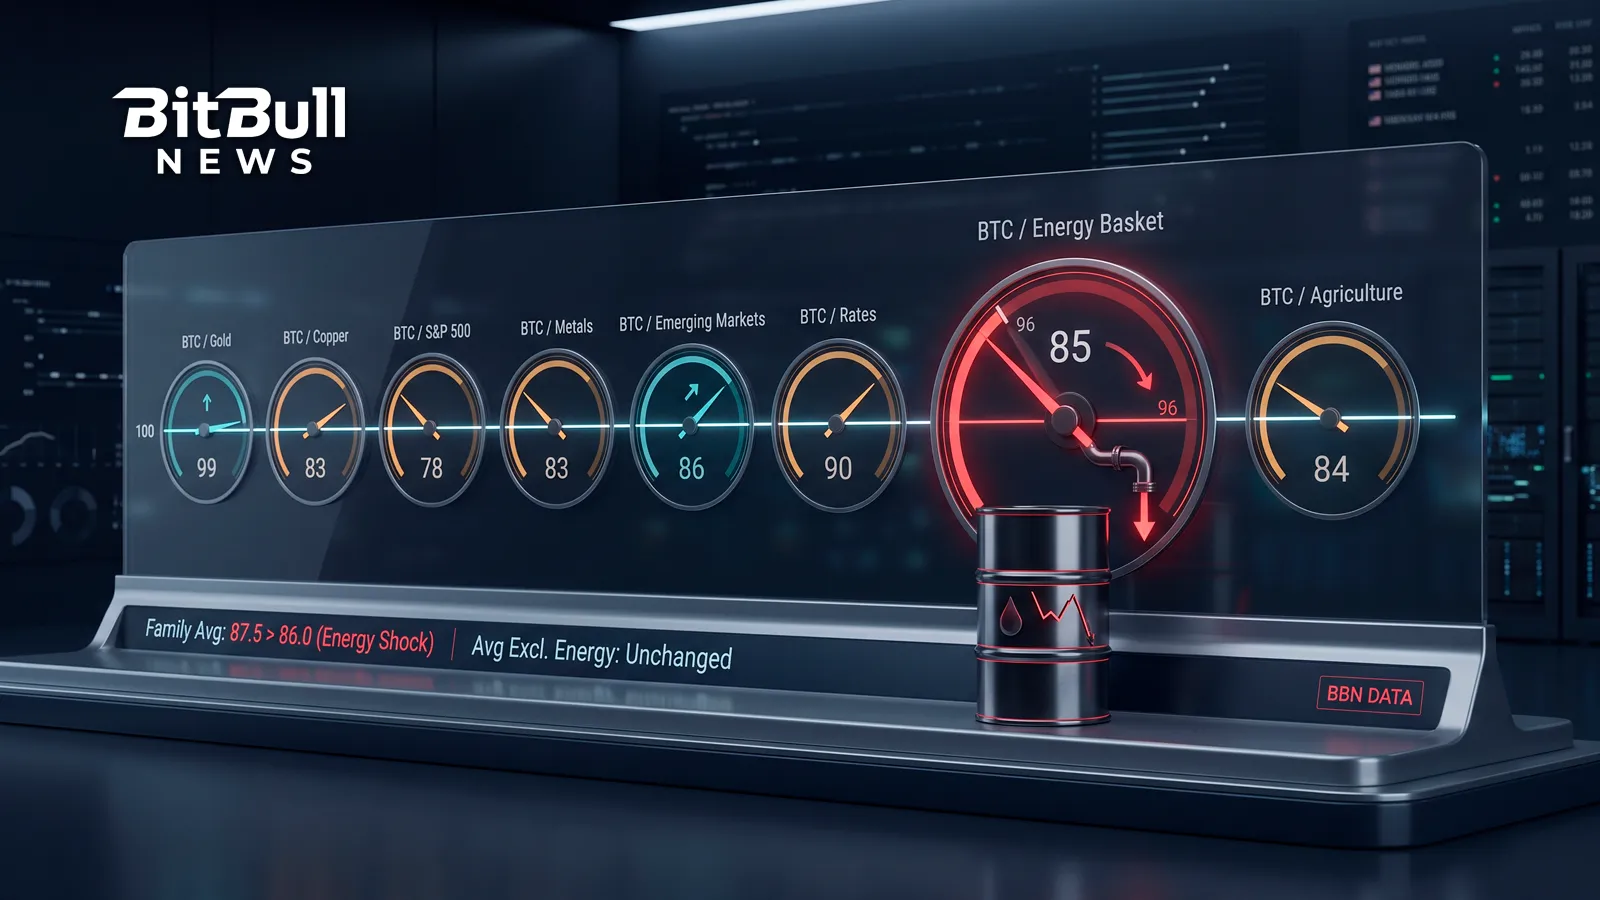
BTC/Energy Basket collapsed from 96 to 85, a weekly decline of 11.5%. That single benchmark accounted for 11 of the 12 net index points lost across the entire family.
The distinction matters. The average BBN benchmark reading declined from 87.5 to 86.0, or 1.7%. Excluding energy, however, the average of the other seven benchmarks barely moved, slipping from 86.3 to 86.1.
This was not a broad Bitcoin capitulation against every macro asset. It was an energy shock surrounded by several narrow relative reversals.
Bitcoin briefly recovered above $65,000 after softer U.S. inflation data, but it could not hold the move. By July 17, BTC was trading near $63,000 as renewed geopolitical tension, firmer oil prices and a global technology sell-off reduced risk appetite.
The Scoreboard
The BBN benchmark family compares Bitcoin with hard money, industrial demand, U.S. equities, emerging-market risk, interest rates and broad commodity baskets. The neutral reference level is 100. Above 100, Bitcoin is ahead of the comparison asset. Below 100, the other asset remains stronger on the benchmark’s fixed-base framework.
| Benchmark | July 17 | July 10 | Point Change | Weekly Change | Gap From 100 |
|---|---|---|---|---|---|
| BTC/Gold | 99 | 97 | +2 | +2.1% | −1 |
| BTC/Copper | 83 | 84 | −1 | −1.2% | −17 |
| BTC/S&P 500 | 78 | 79 | −1 | −1.3% | −22 |
| BTC/Metals | 83 | 84 | −1 | −1.2% | −17 |
| BTC/Emerging Markets | 86 | 84 | +2 | +2.4% | −14 |
| BTC/Rates | 90 | 91 | −1 | −1.1% | −10 |
| BTC/Energy Basket | 85 | 96 | −11 | −11.5% | −15 |
| BTC/Agriculture Basket | 84 | 85 | −1 | −1.2% | −16 |
| Family Average | 86.0 | 87.5 | −1.5 | −1.7% | −14.0 |
The percentage changes are calculated against the July 10 reading for each benchmark. Because the starting levels differ, an identical one-point decline produces a 1.3% drop in BTC/S&P 500 but a 1.1% decline in BTC/Rates.
The previous BBN review recorded gains across all eight comparisons. The new update replaces that broad recovery with a much more divided picture: Bitcoin strengthened against defensive monetary exposure and emerging-market equities but lost ground against assets tied to energy, physical supply and financing conditions.
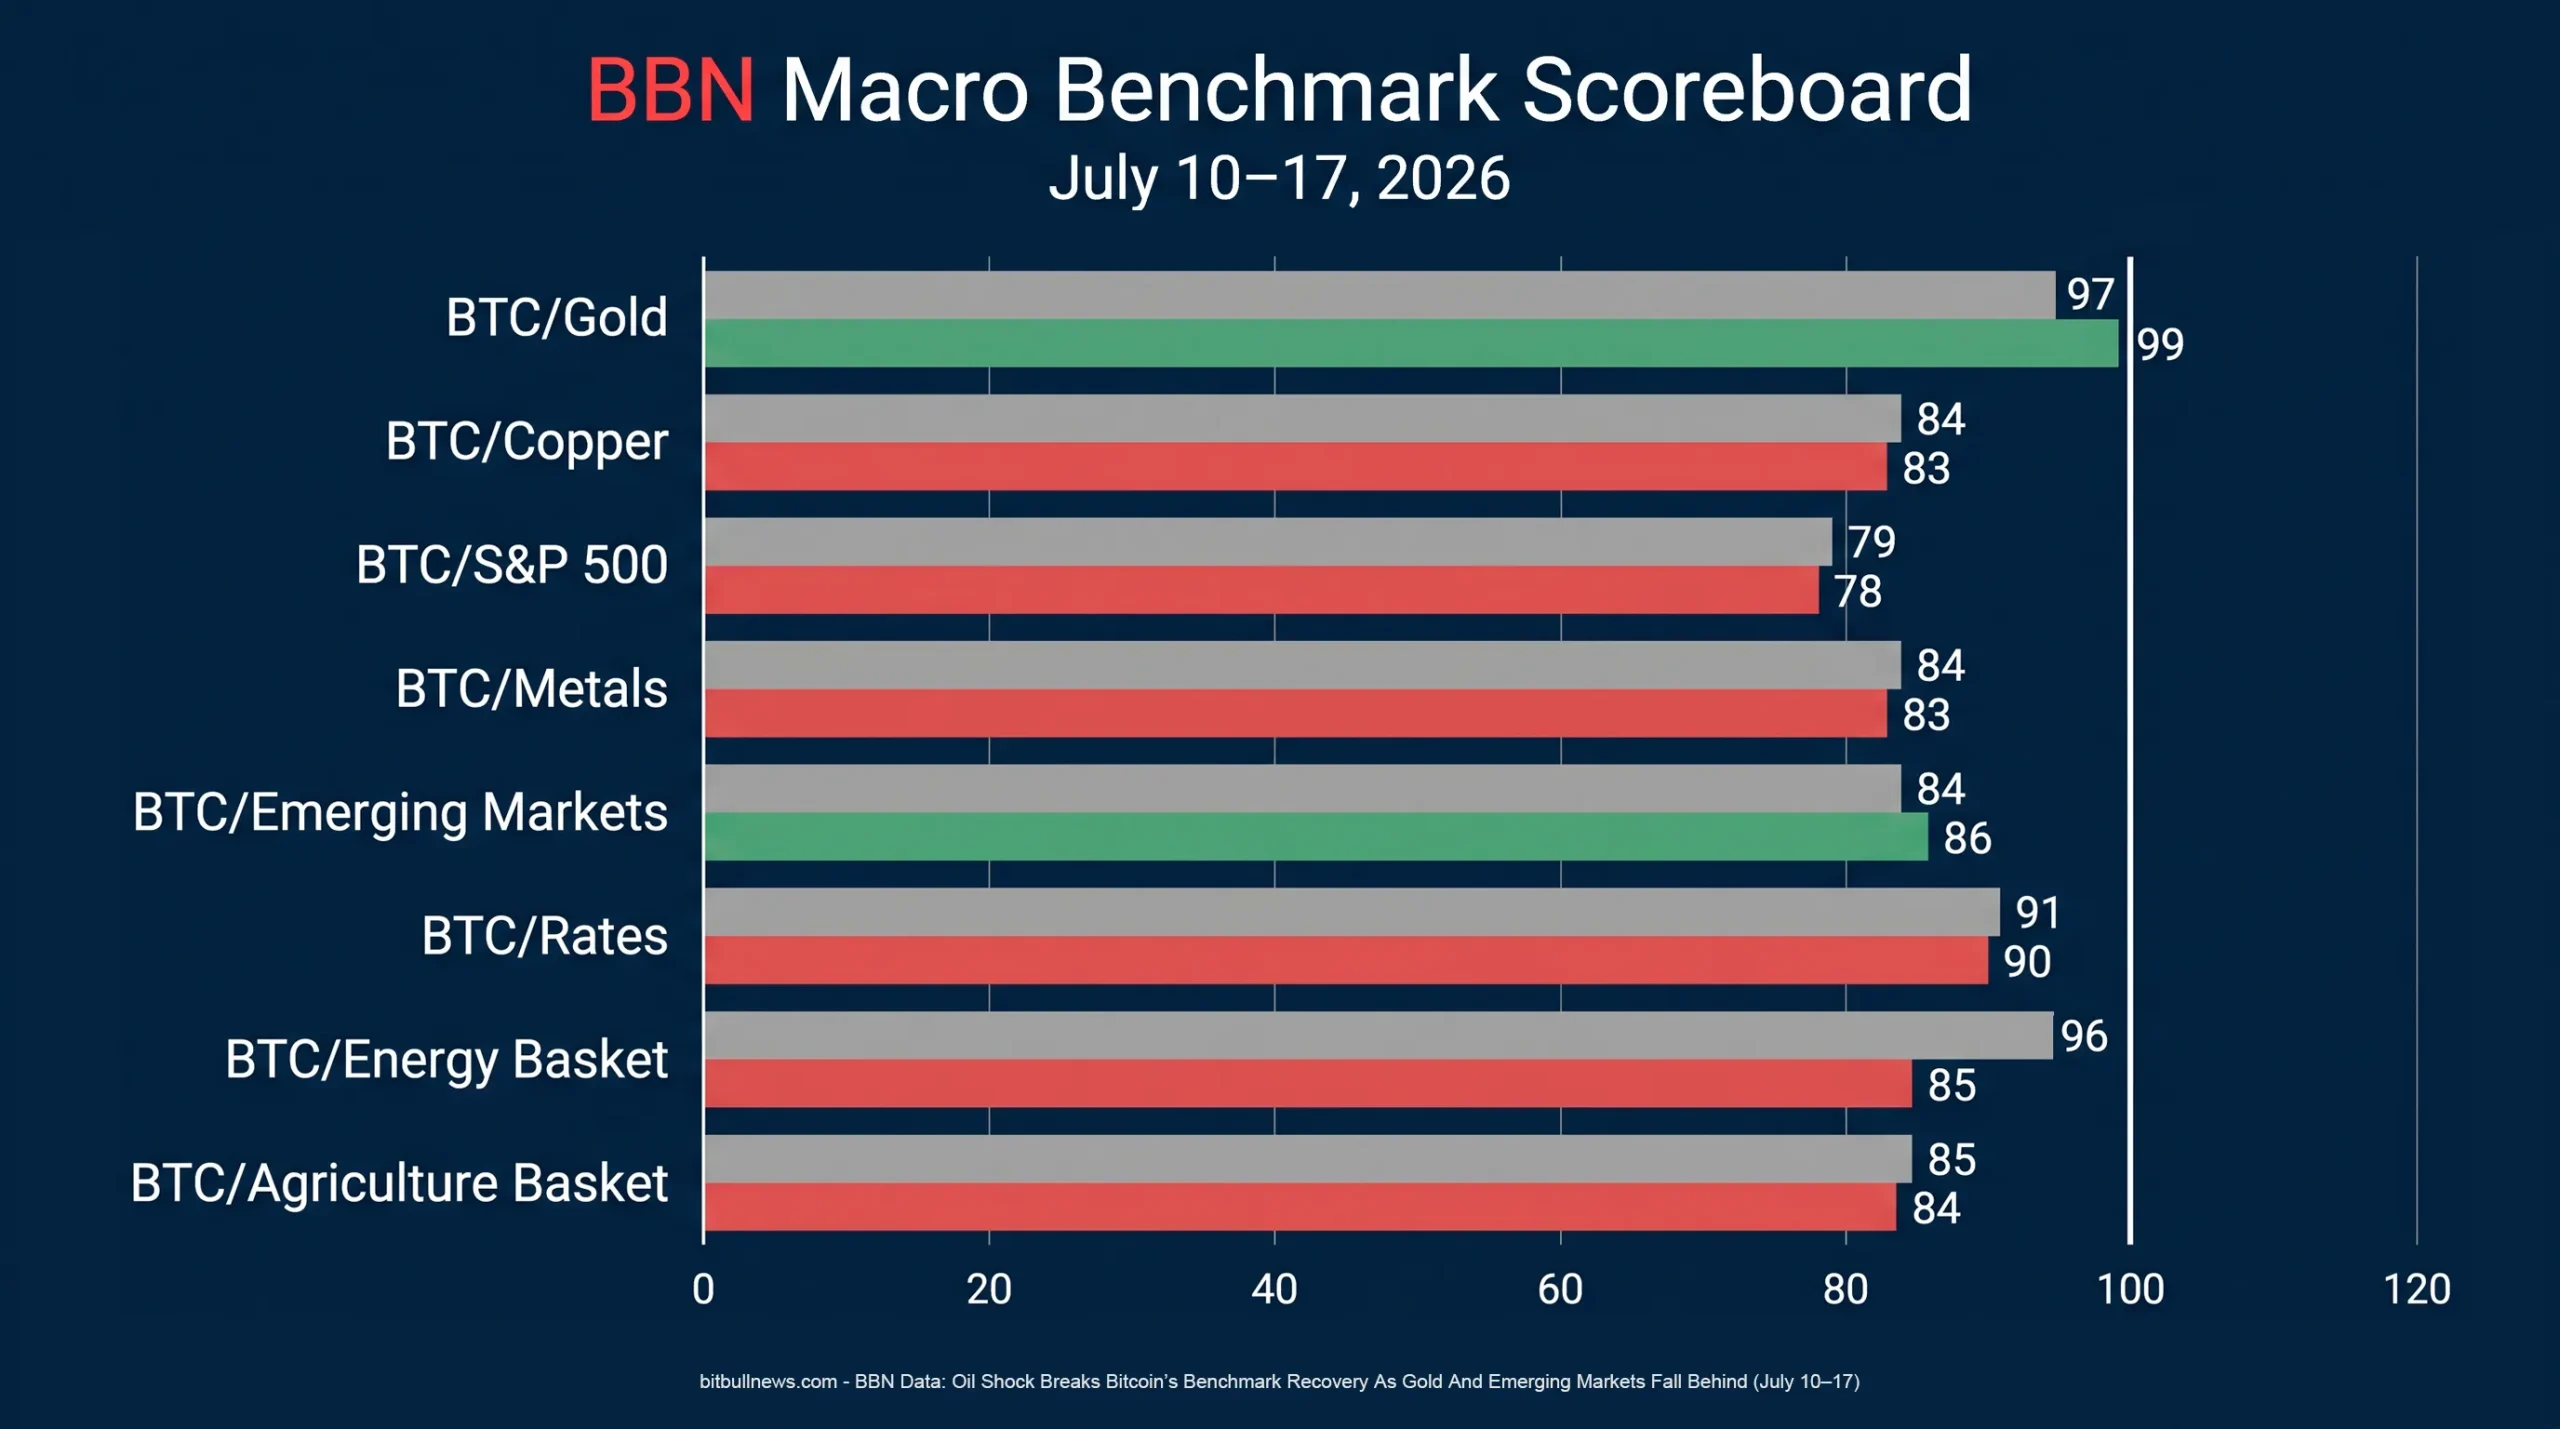
BBN Benchmark Scoreboard — July 10 Versus July 17
Energy Was The Entire Week
The fall in BTC/Energy from 96 to 85 was not a marginal adjustment. It was the family’s largest move by a wide margin and transformed energy from the second-closest benchmark to neutral into one of Bitcoin’s larger relative deficits.
The BBN Energy Basket methodology gives crude oil 55% of the basket: 30% WTI and 25% Brent. Another 25% comes from refined products, split between RBOB gasoline and ultra-low-sulfur diesel. Natural gas accounts for the remaining 20%.
That construction left the benchmark highly exposed to the week’s oil shock.
Brent and WTI posted double-digit weekly gains as renewed U.S.–Iran hostilities threatened shipping and energy infrastructure around the Strait of Hormuz. Brent moved above $86 per barrel during Friday trading, while WTI climbed above $80. Refined products also strengthened as traders priced higher transport risk and tighter fuel supply.
The move was particularly sharp because the market had entered the week with lower inflation pressure in the rear-view mirror. The June Consumer Price Index showed a 0.4% monthly decline, driven largely by a 5.7% fall in energy prices. The June Producer Price Index fell 0.3%, with final-demand energy down 6.4% and gasoline prices down 12%.
Oil’s July reversal challenged that disinflationary story almost immediately. Markets had to consider whether higher crude and refined-product prices would feed back into headline inflation, transport costs and Federal Reserve expectations.
Bitcoin did not receive comparable safe-haven demand. It traded as a volatile risk asset, falling during the first geopolitical escalation, recovering on softer inflation data and weakening again as the conflict intensified.
The mechanics of the benchmark are therefore straightforward. The majority of the energy basket rose sharply while Bitcoin finished the period near where it started, and below its midweek high. BTC did not need to collapse for BTC/Energy to lose 11.5%. It only needed to stand still while oil and fuel prices surged.
The energy benchmark supplied 11 of the family’s 12 net lost points. Without it, the benchmark family would have been almost unchanged.
That is the week’s central finding.
Bitcoin Moved To Within One Point Of Gold
BTC/Gold delivered the strongest constructive signal, rising 2.1% from 97 to 99.
The reading is now only one point below the neutral reference level. No other BBN benchmark is as close to 100.
The improvement did not come from a powerful Bitcoin rally. It came because gold fell faster.
Gold dropped below $4,000 per ounce and was heading for a weekly loss of more than 3%. The decline was unusual for a period of heightened geopolitical risk, but the market’s logic was consistent: surging oil revived inflation concerns, Treasury yields remained elevated and the dollar received defensive demand. Those forces increased the opportunity cost of holding non-yielding bullion.
Bitcoin faced many of the same headwinds but proved more resilient in relative terms. Softer CPI and PPI data briefly pushed BTC above $65,000, and the recovery in spot ETF inflows helped the market rebound from Monday’s decline. Bitcoin later gave back much of that advance, but gold’s deeper weekly loss was enough to lift the benchmark by two points.
This is an important but limited victory.
A reading of 99 means Bitcoin has almost repaired its relative deficit against gold. It does not yet mean that the market has decisively selected BTC over the traditional monetary hedge.
The next move will carry more significance than the last one. A rise above 100 would place BTC/Gold on the positive side of the benchmark for the first time in the current recovery. A reversal would show that the approach to parity was caused mainly by temporary weakness in bullion.
Emerging Markets Fell Harder Than Bitcoin
BTC/Emerging Markets recorded the largest positive percentage change, rising 2.4% from 84 to 86.
The benchmark uses the MSCI Emerging Markets Net Total Return Index in U.S. dollars. It therefore measures Bitcoin against a broad equity universe exposed to global liquidity, the dollar, commodity prices and country-specific risk rather than against a simple basket of emerging-market currencies. The index also includes reinvested dividends after withholding taxes.
The week was difficult for that universe.
Asian equity markets were hit by a deepening semiconductor sell-off as investors reassessed crowded AI and memory-chip positions. On July 17, Taiwan Semiconductor Manufacturing fell sharply, Japan’s Nikkei lost around 4%, the Shanghai Composite declined more than 3% and Hong Kong’s Hang Seng dropped roughly 2%.
China added another source of pressure. Concerns that a large domestic semiconductor listing could drain liquidity from the existing market contributed to the steepest weekly losses for major Chinese equity benchmarks in more than two years.
Higher oil prices also created an uneven burden across emerging economies. Energy exporters gained a potential terms-of-trade benefit, but import-dependent markets faced the prospect of higher inflation, weaker currencies and reduced room for monetary easing.
Bitcoin did not perform well in absolute terms, but it fell less than the broad emerging-market complex. That was enough to lift BTC/Emerging Markets by two points.
As with gold, the interpretation requires discipline. The increase to 86 represents relative resilience, not a confirmed return of broad risk appetite toward Bitcoin. BTC won because emerging-market equities suffered a more severe shock.
ETF Flows Supported Bitcoin, But Not Enough
Institutional demand improved after a difficult start to the week, but the flow sequence never became strong enough to sustain Bitcoin above $65,000.
According to Farside Investors, U.S. spot Bitcoin ETFs recorded a $424.7 million net outflow on July 13. The market then received three consecutive inflow sessions worth a combined $367.9 million through July 16. The four-session balance remained negative at $56.8 million.
| Date | Net U.S. Spot Bitcoin ETF Flow |
|---|---|
| July 13 | −$424.7 million |
| July 14 | +$181.1 million |
| July 15 | +$107.7 million |
| July 16 | +$79.1 million |
| Four-Session Balance | −$56.8 million |
The composition was more encouraging than the total. Investors returned after Monday’s liquidation, and the $181.1 million inflow on July 14 arrived alongside softer inflation data. That demand helped Bitcoin recover above $65,000.
The follow-through weakened, however. Daily inflows declined from $181.1 million to $107.7 million and then $79.1 million. Bitcoin had buyers, but not enough of them to overpower renewed geopolitical selling and the broader retreat from high-beta technology assets.
That incomplete institutional recovery helps explain the benchmark pattern. BTC was stable enough to beat gold and emerging markets, but not strong enough to outperform assets with direct support from physical supply shocks or elevated yields.
Copper And Industrial Metals Held Their Ground
BTC/Copper and BTC/Metals both declined 1.2%, with each benchmark moving from 84 to 83.
These were modest moves compared with energy, but they carry a different message. Copper and the broader industrial-metals complex did not need a major rally to beat Bitcoin. They only needed to hold their value slightly better.
Copper retained support from tight long-term supply conditions, declining ore grades and limited near-term mine expansion. Production challenges at major Chilean operations have reinforced the view that new supply may struggle to keep pace with demand from power grids, electrification and data-center construction.
The broad metals benchmark is also less dependent on one contract than BTC/Copper. The BBN Industrial Metals methodology assigns 40% to LME copper, 25% to aluminum, 15% to nickel, 10% to zinc and 5% each to lead and tin. Copper and aluminum therefore represent 65% of the basket.
That structure dampens single-metal volatility. Weakness in zinc or lead can be offset by firmer copper, aluminum or nickel pricing, producing a broader measure of industrial demand.
The one-point declines in both benchmarks show that Bitcoin’s relative recovery against the industrial cycle has stalled. BTC/Copper and BTC/Metals now sit 17 points below neutral, tied as the second-weakest readings after equities.
Bitcoin is not losing heavily against industrial metals. It simply is not gaining enough to close the structural gap.
Equities Remained Bitcoin’s Hardest Comparison
BTC/S&P 500 fell from 79 to 78, leaving it 22 points below neutral and firmly at the bottom of the benchmark family.
The decline may look surprising because U.S. technology stocks also suffered during the week. The S&P 500 closed at 7,575.39 on July 10 and had fallen to 7,533.77 by July 16, while the Nasdaq recorded deeper losses as semiconductor and AI-linked shares came under pressure.
Bitcoin nevertheless weakened slightly more over the benchmark’s aligned observation window.
This continues a pattern visible in earlier BBN updates. Bitcoin may rally alongside high-growth equities, but it has struggled to outperform a broad U.S. index supported by earnings, share buybacks, financial stocks, healthcare companies and defensive sectors.
The late-week semiconductor rout did not produce an immediate rotation into crypto. Investors reduced exposure to crowded technology positions, but much of that capital moved toward cash, the dollar, energy and lower-volatility assets rather than toward Bitcoin.
At 78, BTC/S&P 500 remains the clearest sign that Bitcoin has not regained institutional leadership within the global risk trade.
A one-point weekly decline is not severe. The level is.
Rates Refused To Become A Tailwind
BTC/Rates slipped from 91 to 90, reversing the previous week’s one-point improvement.
The macro data initially favored Bitcoin. June CPI fell 0.4% month over month, while core prices were unchanged. Producer prices declined 0.3%. Those reports weakened the immediate case for another Federal Reserve rate increase and briefly supported bonds and risk assets.
The relief did not last.
The U.S. ten-year Treasury yield moved from 4.56% on July 10 to 4.62% on July 13 before retreating. It stood at 4.57% on July 16, almost unchanged over the period but still high enough to compete with non-yielding and high-volatility assets.
Oil was the reason the rates story remained uncomfortable. Softer backward-looking inflation data pointed toward easing price pressure, but a new energy shock raised the risk that headline inflation could accelerate again.
Bitcoin therefore received only a short-lived benefit from the CPI and PPI releases. Yields did not fall far enough, or remain low long enough, to create a durable liquidity tailwind.
A BTC/Rates reading of 90 shows that financing conditions remain a meaningful obstacle. Bitcoin is no longer being crushed by the rate environment, but it is still not outperforming it.
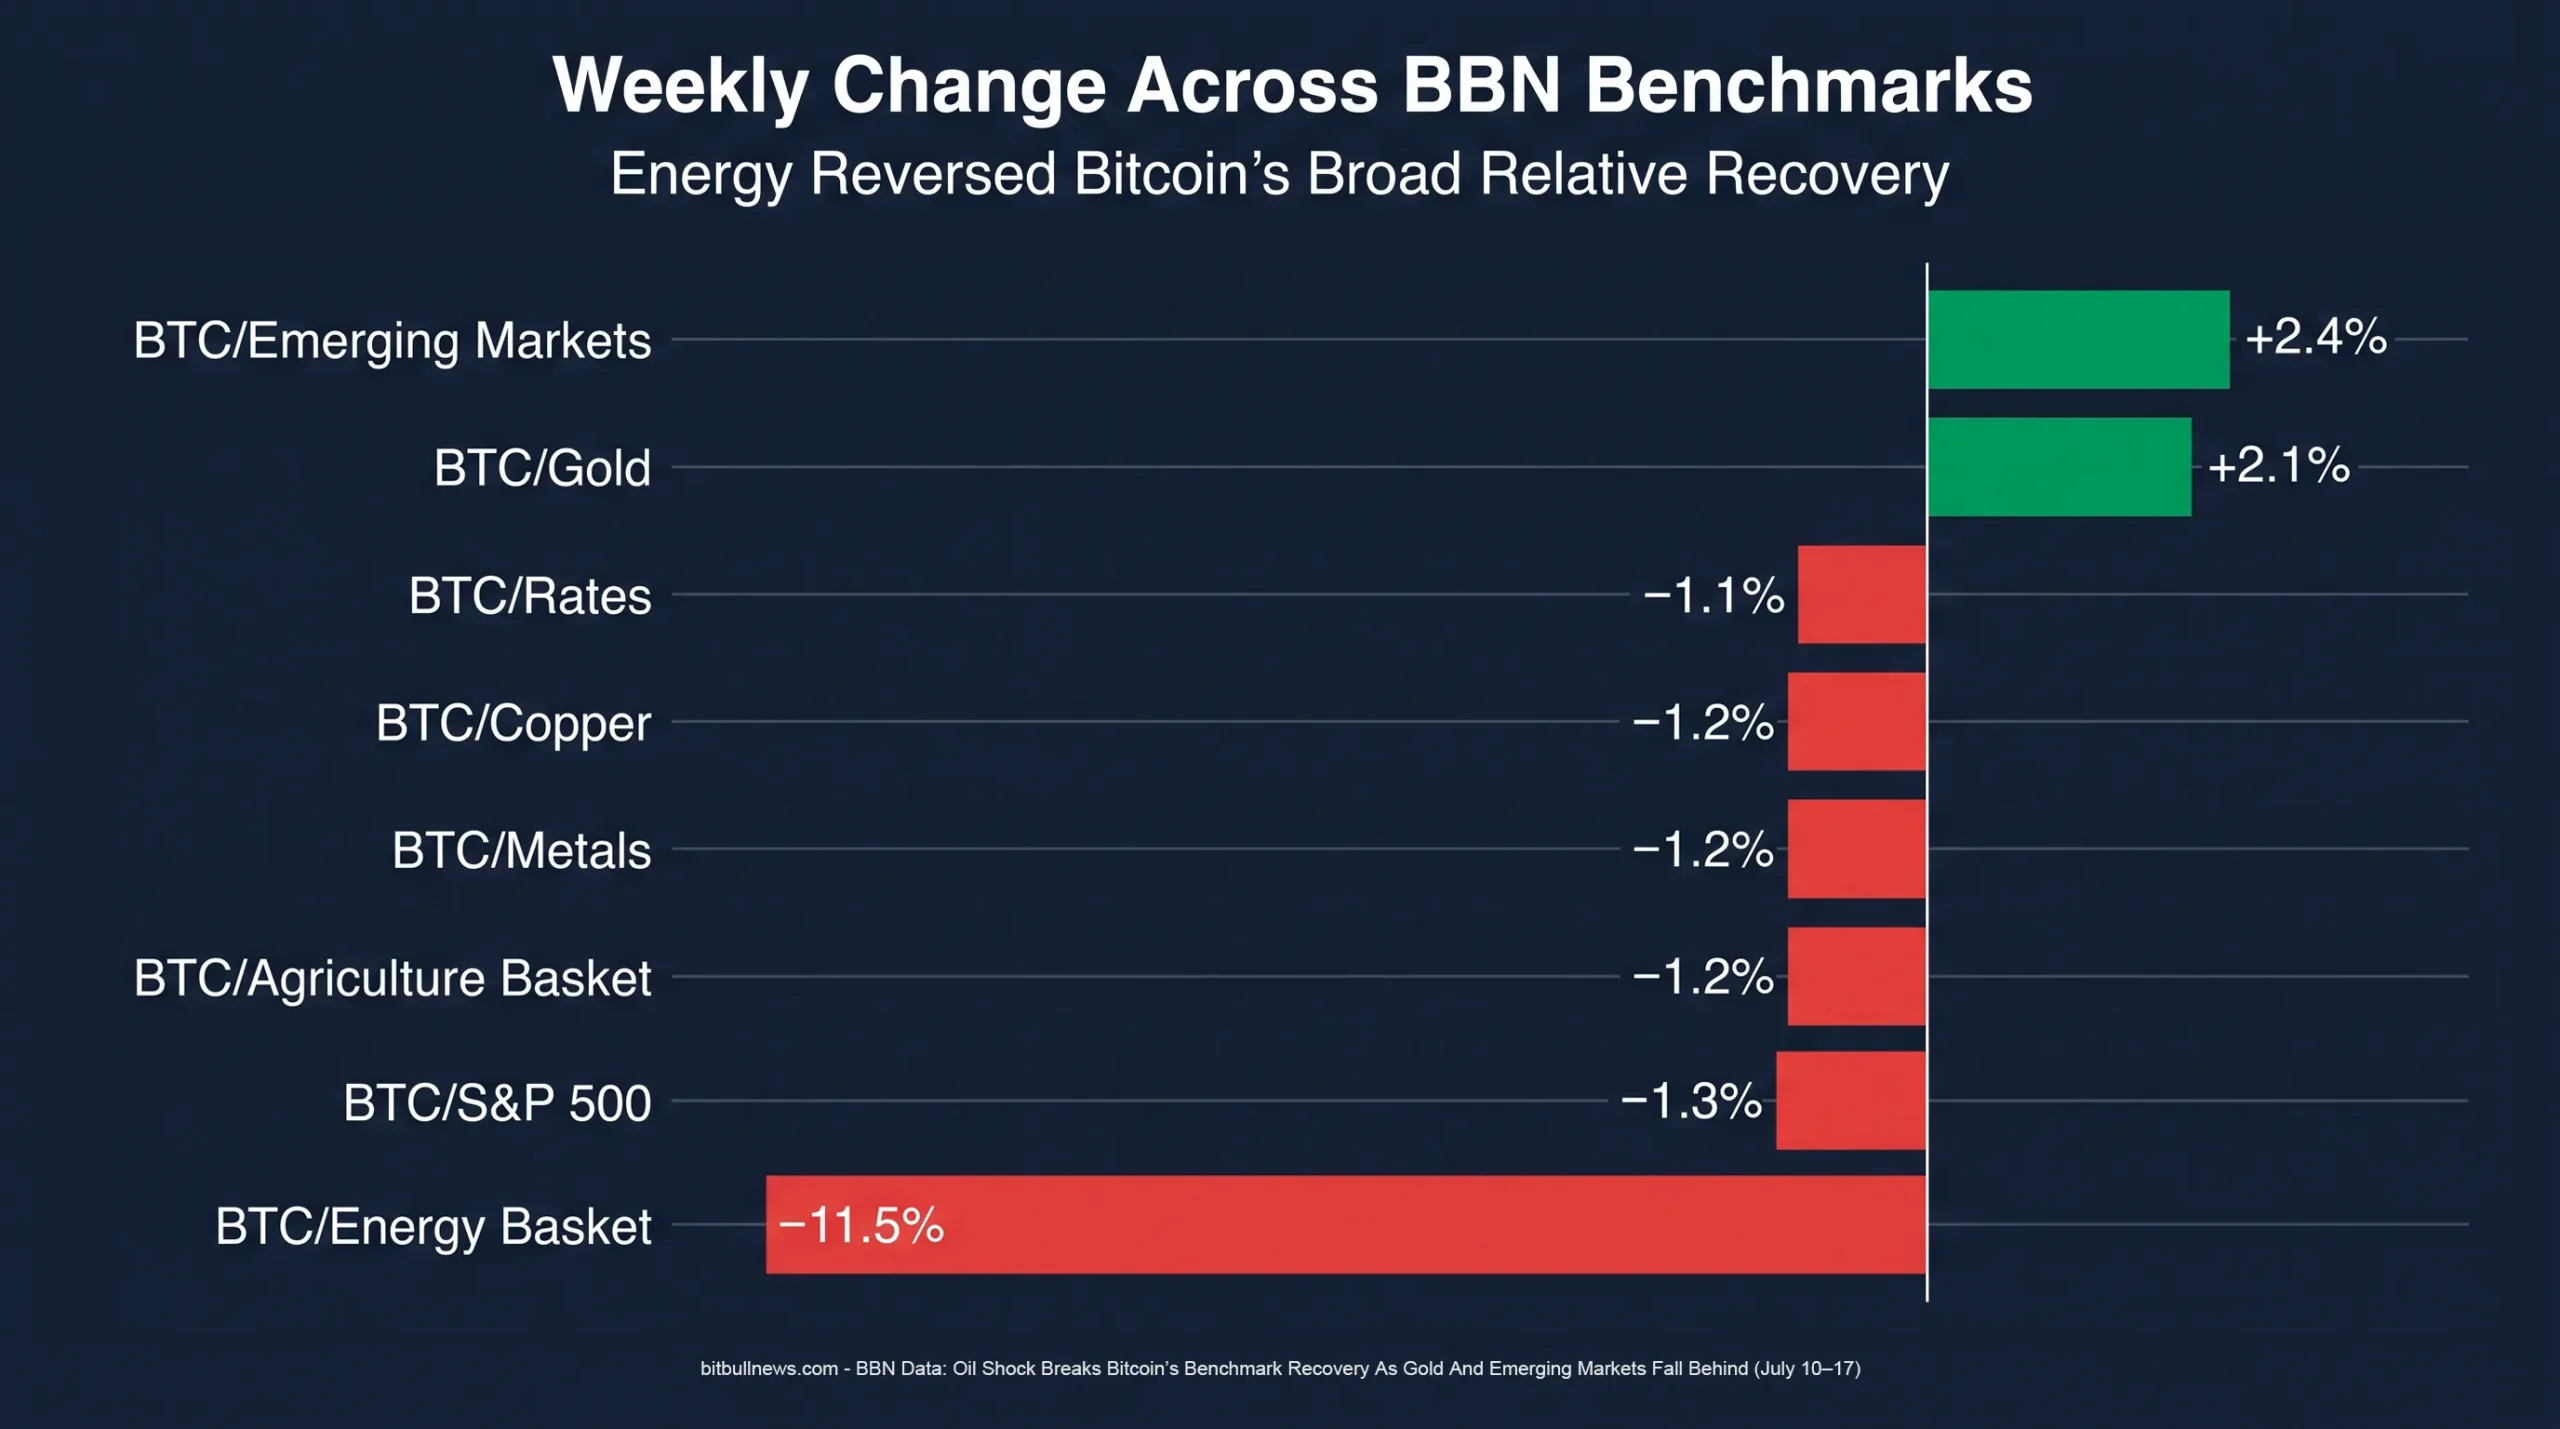
Weekly Percentage Change Across The BBN Benchmark Family
Agriculture Quietly Beat Bitcoin
BTC/Agriculture declined from 85 to 84, a weekly change of 1.2%.
The move was small, but the internal composition explains why the basket held up.
The BBN Agriculture Basket methodology assigns 70% of the basket to wheat, corn and soybeans. Wheat and corn each carry 25%, while soybeans account for 20%. Sugar, cotton, coffee and cocoa make up the remaining 30%.
Wheat prices reached their highest level in more than two years during the week as renewed attacks around Black Sea port infrastructure raised concerns about global grain exports. Western Australia also projected a materially smaller wheat harvest because of hotter and drier conditions.
Corn and soybeans received support from tighter U.S. supply expectations, higher energy prices and the July agricultural balance sheets, even as improving Midwest weather and weaker export sales limited the gains.
That grain strength mattered more than weakness in several soft commodities because of the basket’s weights. The three core contracts represent more than two-thirds of the benchmark.
BTC/Agriculture’s fall to 84 does not indicate an agricultural boom. It shows that a grain-heavy basket preserved slightly more value than Bitcoin during a week shaped by supply risk and geopolitical disruption.
The Benchmark Family Has Split Into Three Groups
The new readings divide the BBN family into three distinct groups.
Gold stands alone at 99. Bitcoin is almost back at parity with the traditional defensive monetary asset.
Rates at 90 and emerging markets at 86 form the middle tier. Bitcoin remains behind both comparisons over the benchmark horizon, but the gaps are no longer extreme. Rates are still a headwind, while the emerging-market result is improving because global equity stress has become more severe.
Energy, agriculture, copper, metals and the S&P 500 occupy the lower tier, between 78 and 85. These readings show that Bitcoin continues to struggle against physical supply exposure, industrial demand and broad U.S. equity performance.
The energy benchmark deserves separate treatment within that group. It is not the family’s lowest reading, but it produced by far the largest weekly deterioration.
This structure is more informative than the family average alone. An average reading of 86 suggests broad Bitcoin underperformance, but the underlying causes are not uniform.
Against gold, BTC is almost even. Against emerging markets, it is recovering. Against energy, it was hit by a sudden external shock. Against equities and industrial assets, the deficit is more persistent.
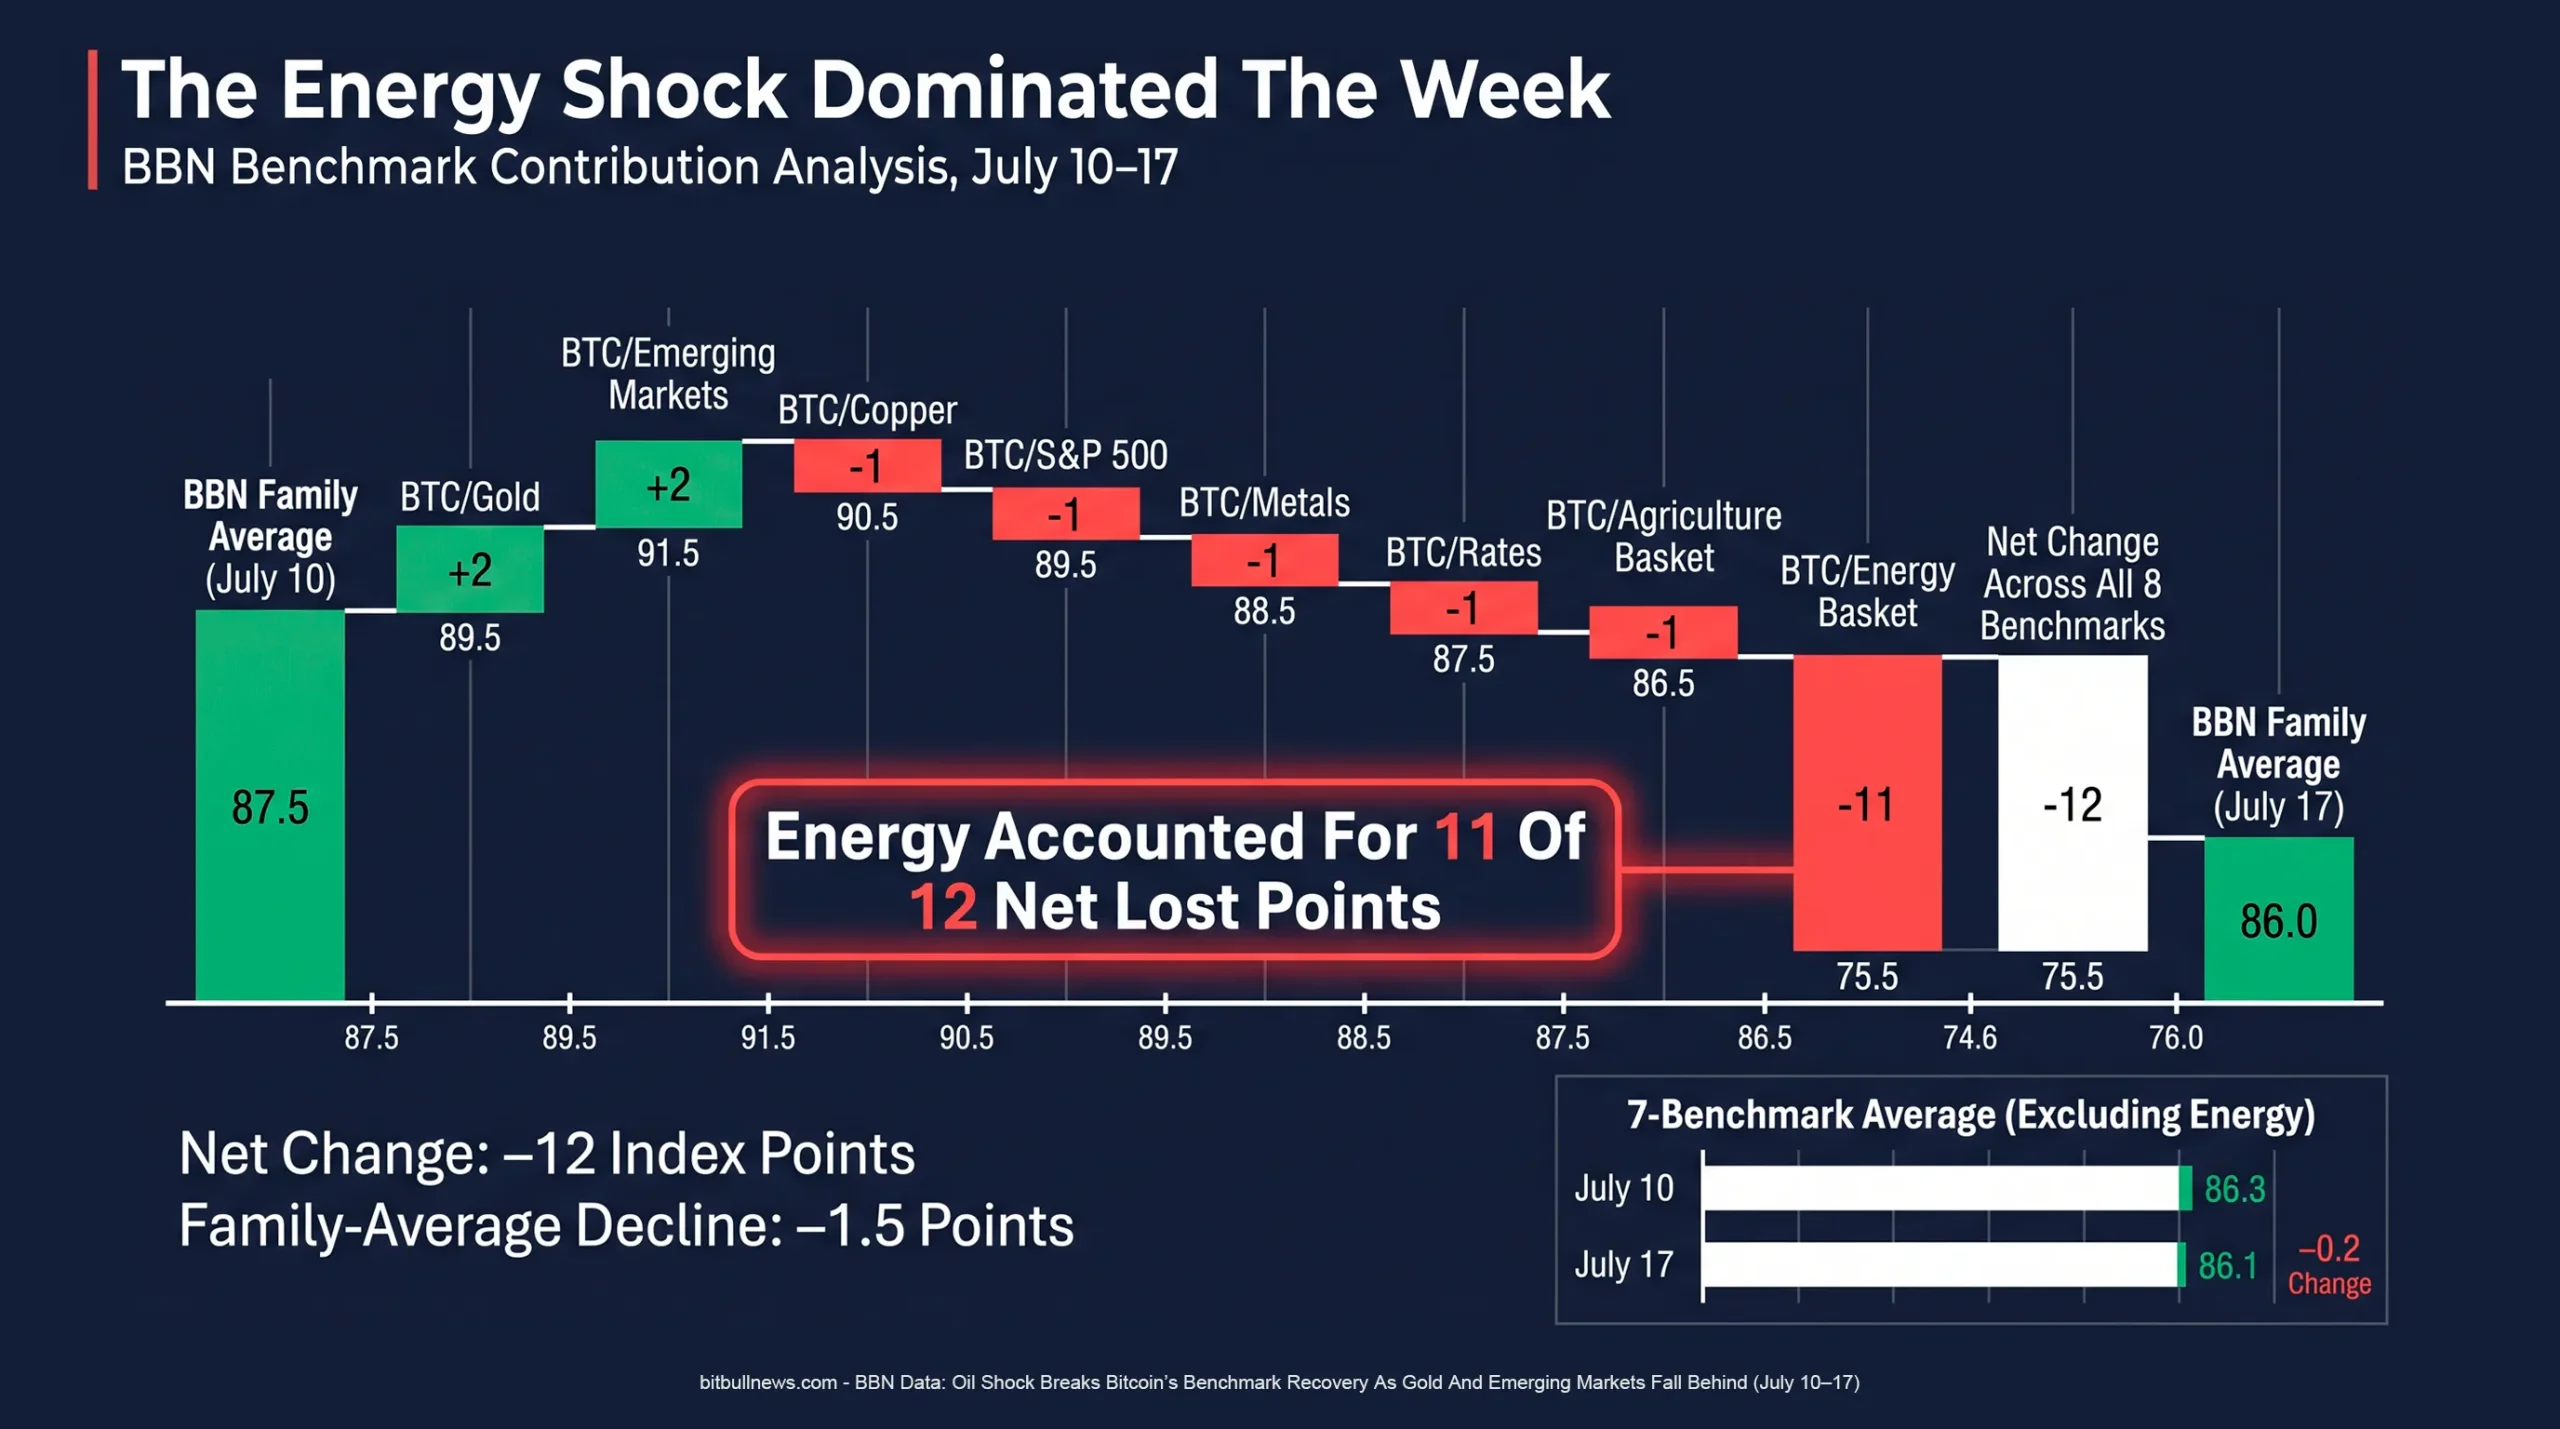
Energy’s Contribution To The Family-Wide Decline
What To Watch Next
Energy will remain the immediate driver.
If Brent, WTI and refined products retain their geopolitical premium, BTC/Energy may remain under pressure even if Bitcoin stabilizes in dollar terms. A reopening of shipping routes or a credible de-escalation would create the opposite effect: the benchmark could rebound quickly because its decline was concentrated rather than gradual.
BTC/Gold is the clearest potential breakout. At 99, only a small relative move is required to cross 100. Whether that happens through a stronger Bitcoin market or another decline in gold will determine the quality of the signal.
ETF flows are the next confirmation point. Three consecutive inflow days repaired much of Monday’s damage, but the declining daily totals showed limited conviction. A return to sustained nine-figure inflows would give Bitcoin a better chance of moving beyond a temporary macro rebound.
Rates remain the constraint beneath every risk comparison. Softer CPI and PPI data created room for lower yields, but oil has complicated the path. Bitcoin will struggle to regain ground against the S&P 500, copper and industrial metals if the ten-year Treasury yield remains around or above 4.5%.
The July 10–17 update did not erase Bitcoin’s earlier recovery. It exposed its limits.
Bitcoin proved resilient enough to outperform gold and emerging-market equities. It was not strong enough to beat physical supply shocks, elevated yields or broad U.S. equity exposure.
The market has moved from a clean, synchronized recovery into a more demanding phase. Relative performance now depends less on Bitcoin’s direction alone and more on which part of the macro system is setting the price of risk.
Disclaimer
This article is for informational purposes only and does not constitute investment advice, a recommendation or a solicitation to buy or sell any asset. Digital assets, equities, commodities and fixed-income instruments can be highly volatile and involve substantial risk. Conduct independent research and consult a licensed financial professional before making investment decisions.