



Content
Bitcoin’s first move above gold did not survive the following week.
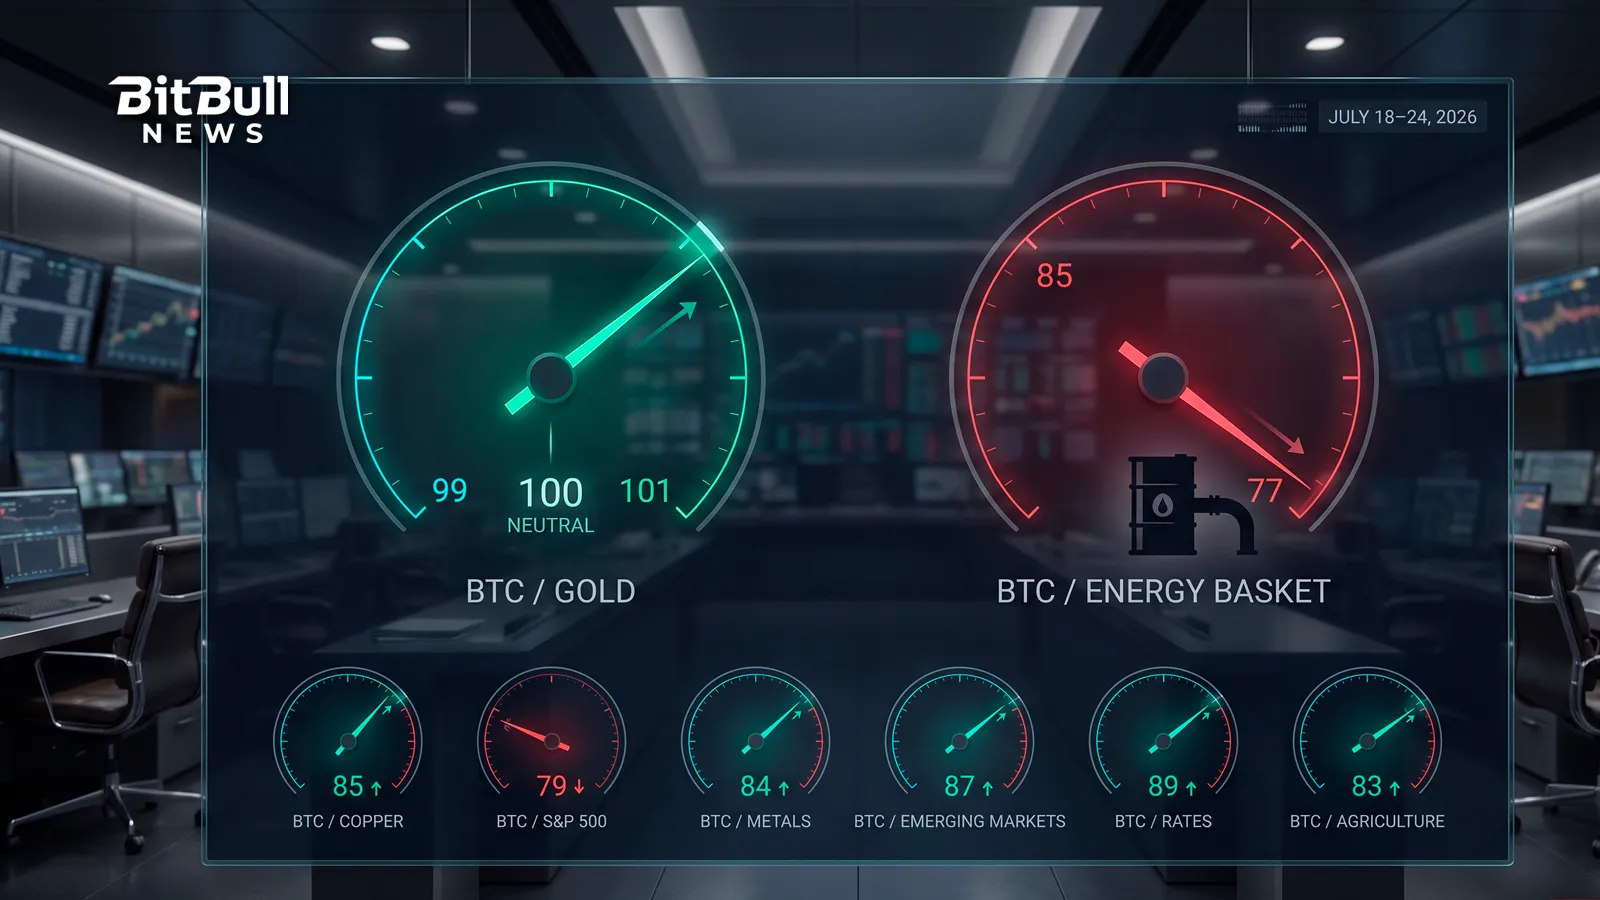
The BBN BTC/Gold benchmark fell from 101 to 99 between July 24 and July 31, returning Bitcoin to the weaker side of the family’s neutral 100 reference level. The reversal came as gold recovered after the Federal Reserve left interest rates unchanged, while Bitcoin spent most of the week trapped near $64,000.
Gold was not the only asset to regain ground.
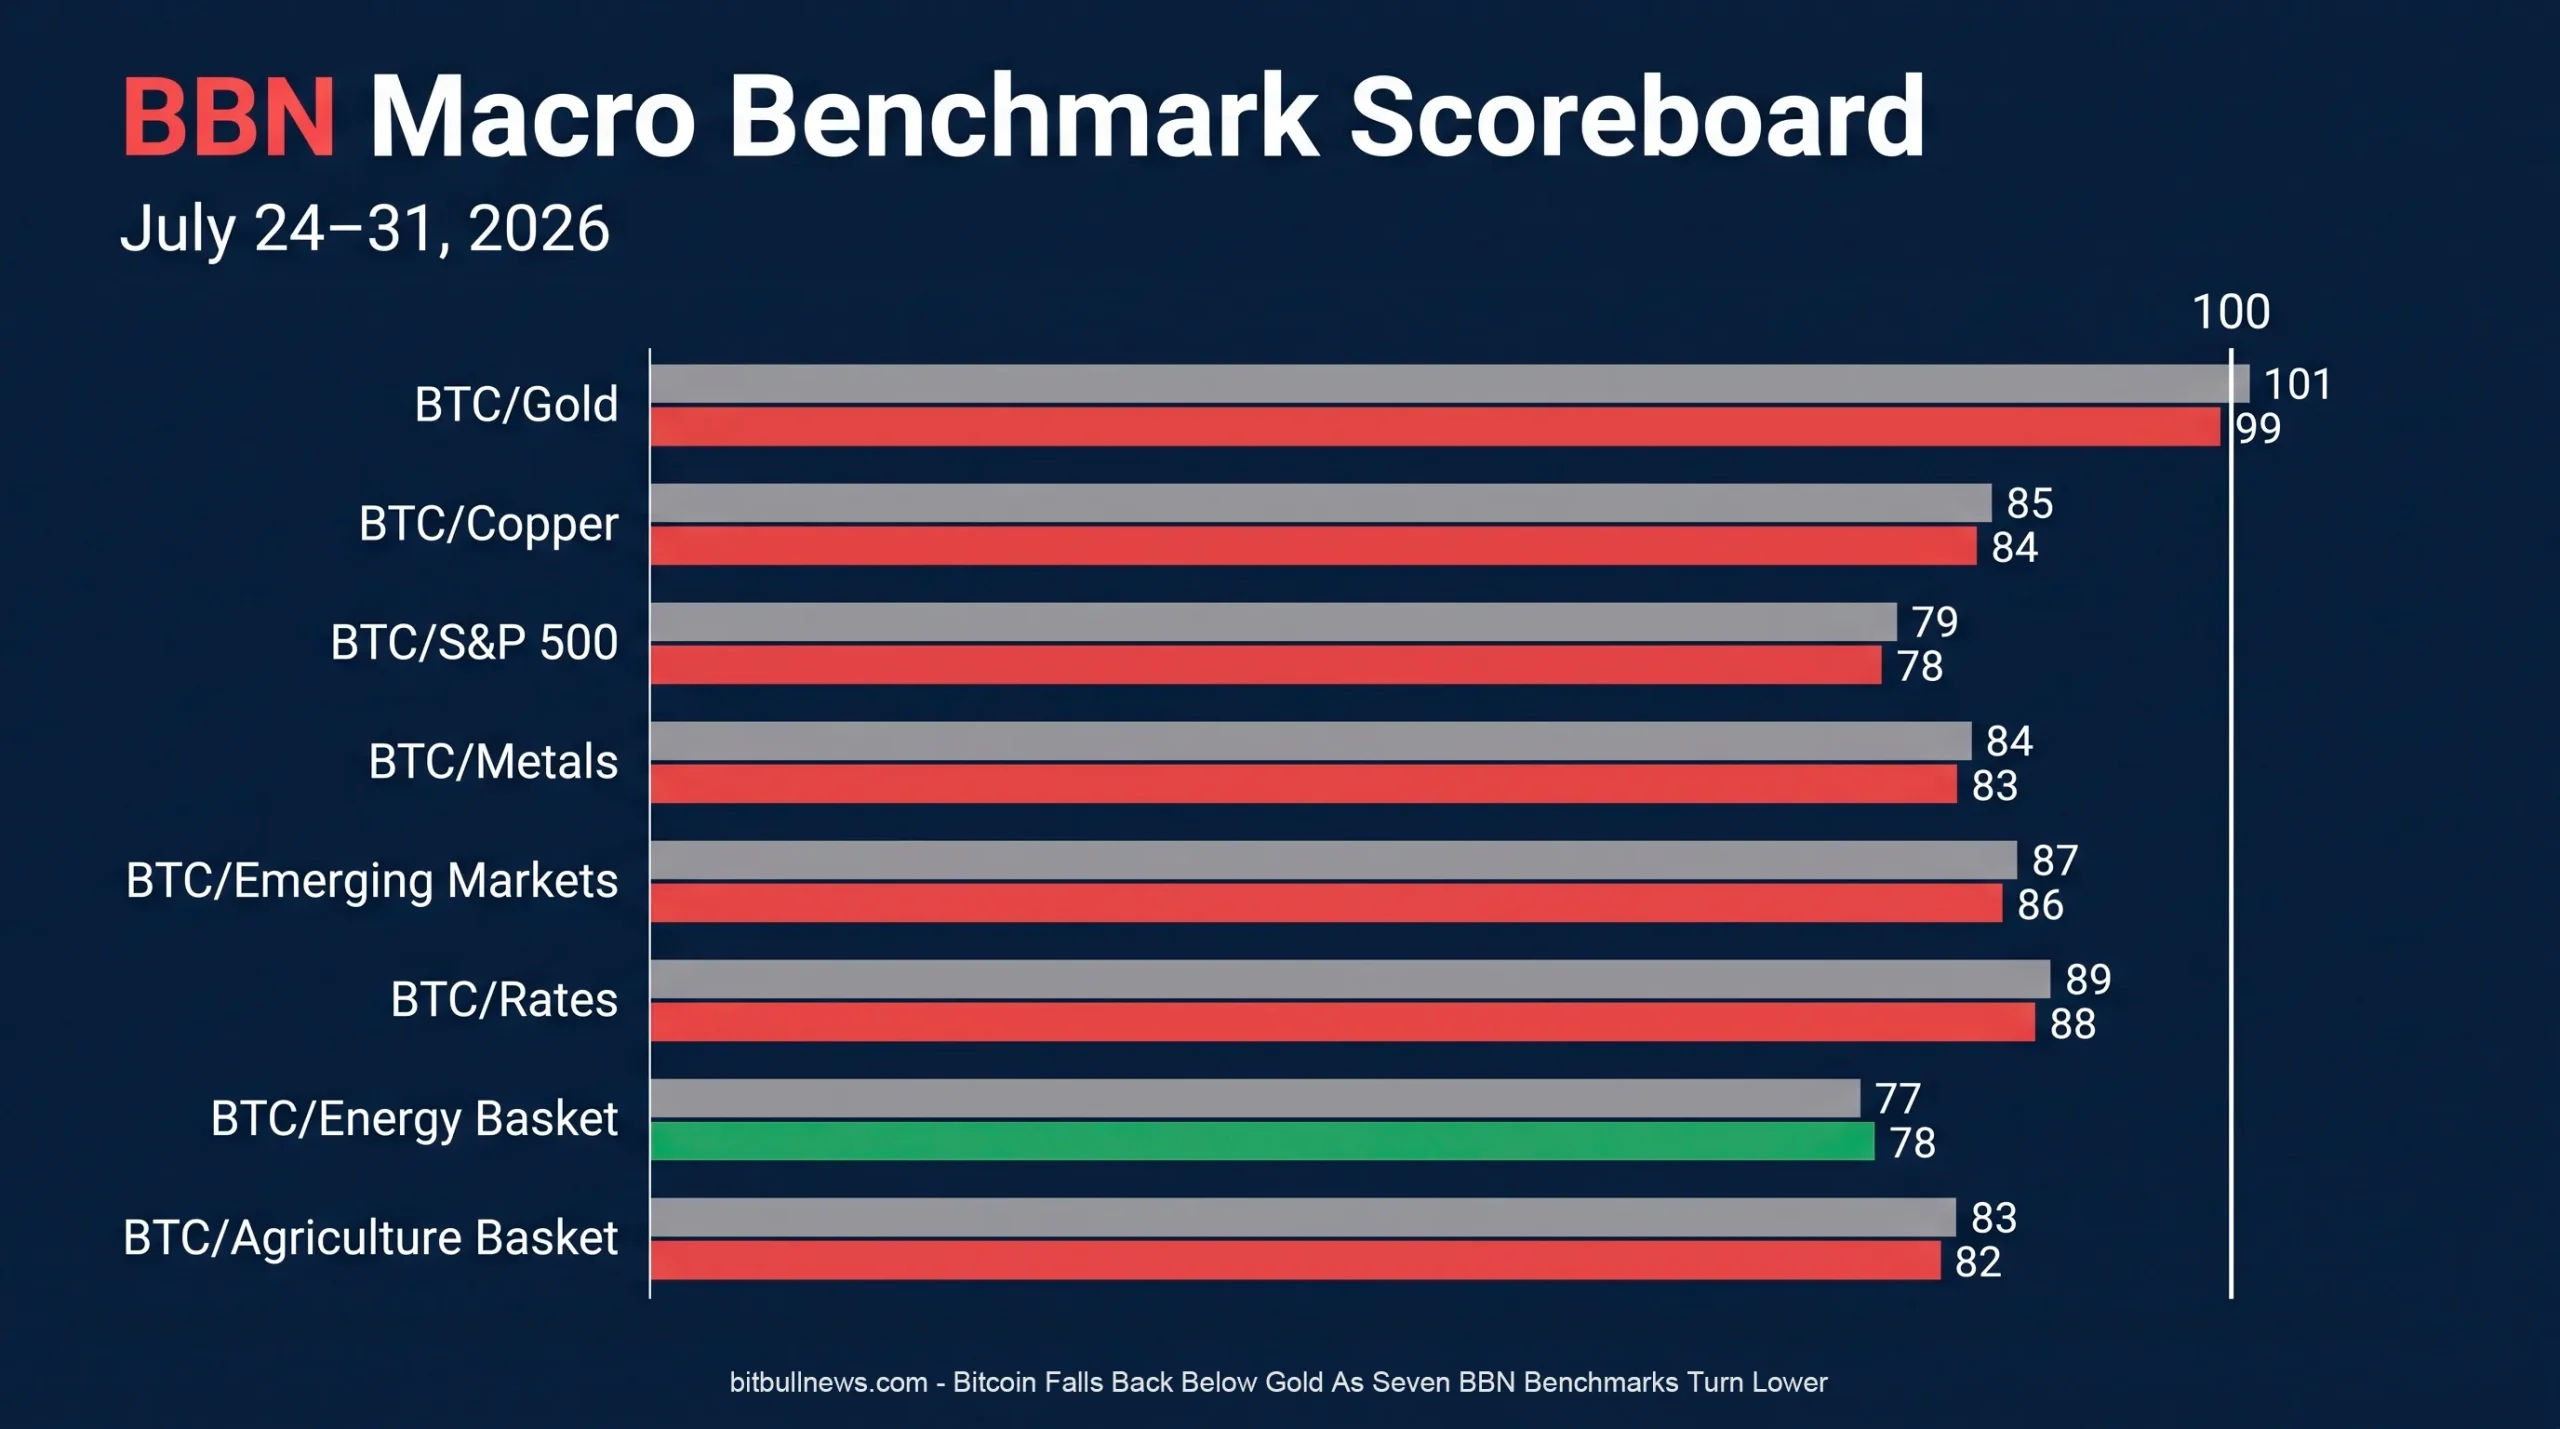
Seven of the eight BBN benchmarks declined. Bitcoin underperformed copper, the S&P 500, industrial metals, emerging markets, rates and agriculture. The only improvement came against energy, where the benchmark rose by one point from 77 to 78 as crude oil surrendered part of the geopolitical premium accumulated during the previous two weeks.
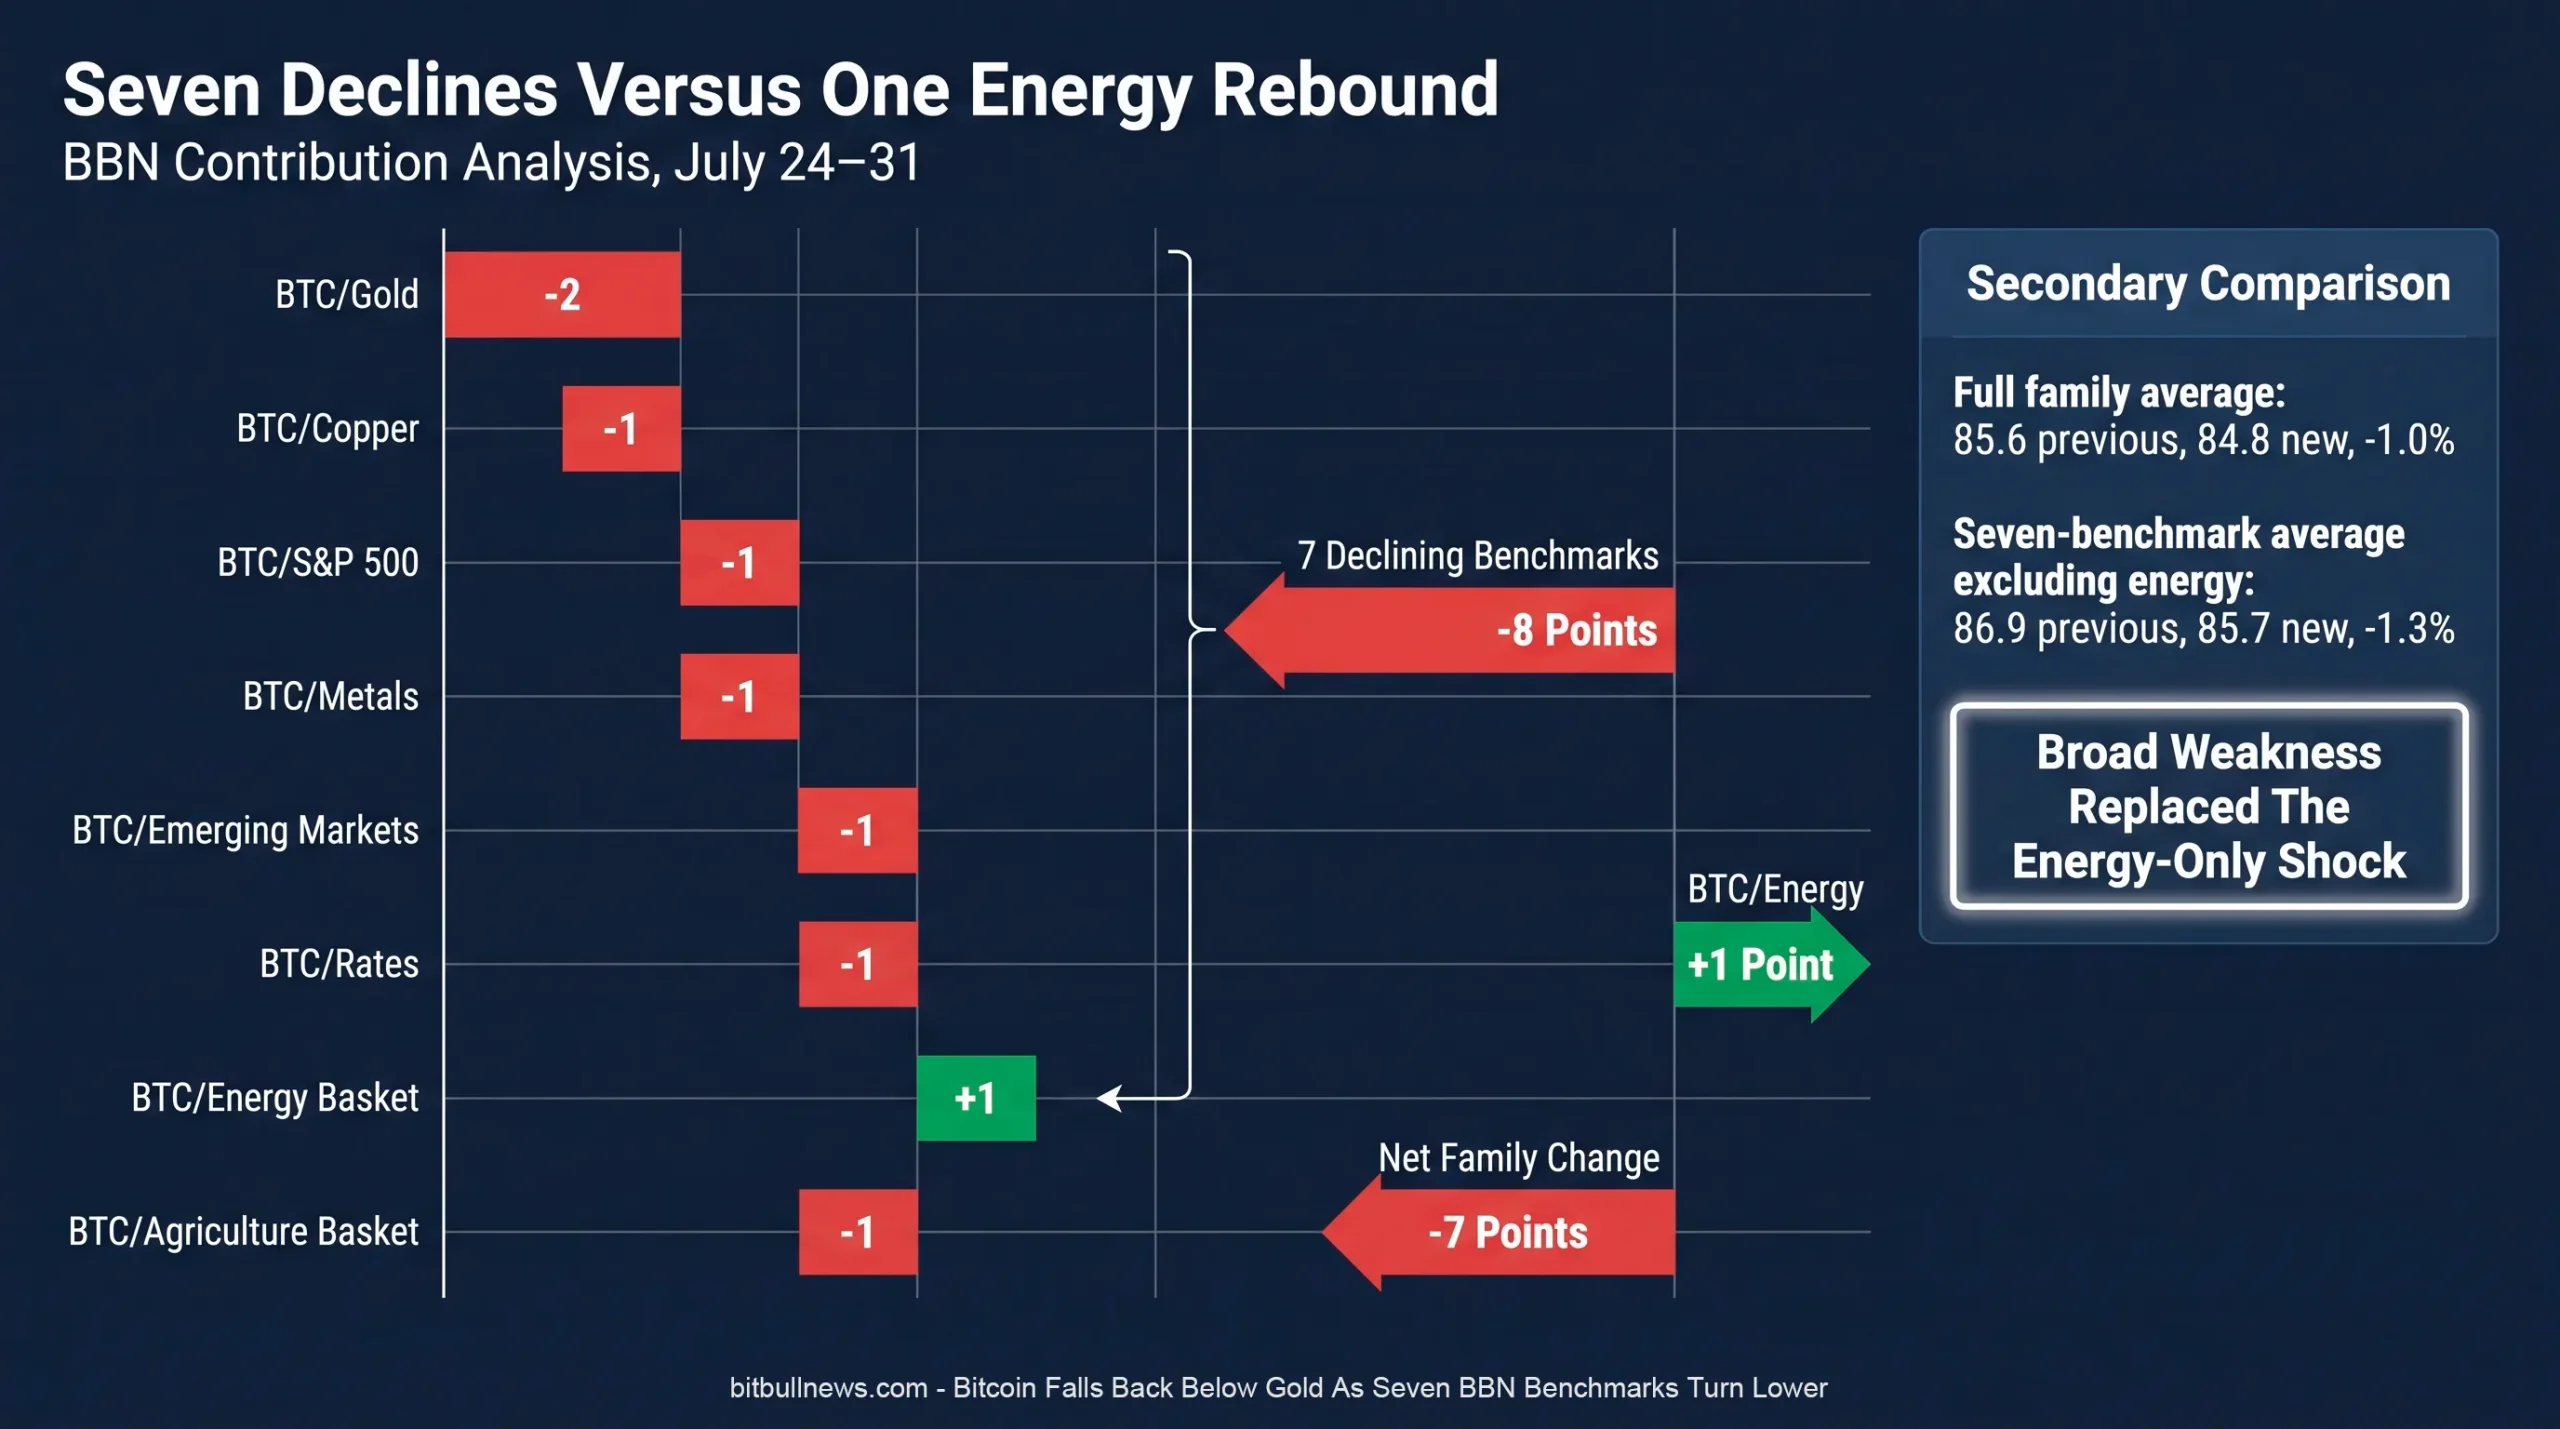
The family average fell from 85.6 to 84.8, a weekly decline of 1.0%.
Unlike the previous update, this was not a scoreboard distorted by one violent commodity move. Excluding energy, the seven-benchmark average declined from 86.9 to 85.7, or 1.3%.
The distinction is important. During July 18–24, Bitcoin improved against five macro comparisons while energy dragged down the headline average. During July 24–31, energy stabilised, but almost everything else moved against Bitcoin.
The BBN benchmark family is now describing broad relative stagnation rather than a single external shock. Bitcoin held its dollar price reasonably well, but it did not generate enough momentum to outperform assets supported by yields, corporate earnings, constrained physical supply or defensive demand.
The Scoreboard
The BBN benchmarks compare Bitcoin with monetary assets, industrial demand, broad equity risk, emerging markets, interest-rate conditions and inflation-sensitive commodity baskets.
A reading above 100 means Bitcoin has outperformed the comparison asset from the benchmark’s fixed historical anchor. A reading below 100 means the comparison asset remains ahead.
| Benchmark | July 31 | July 24 | Point Change | Weekly Change | Gap From 100 |
|---|---|---|---|---|---|
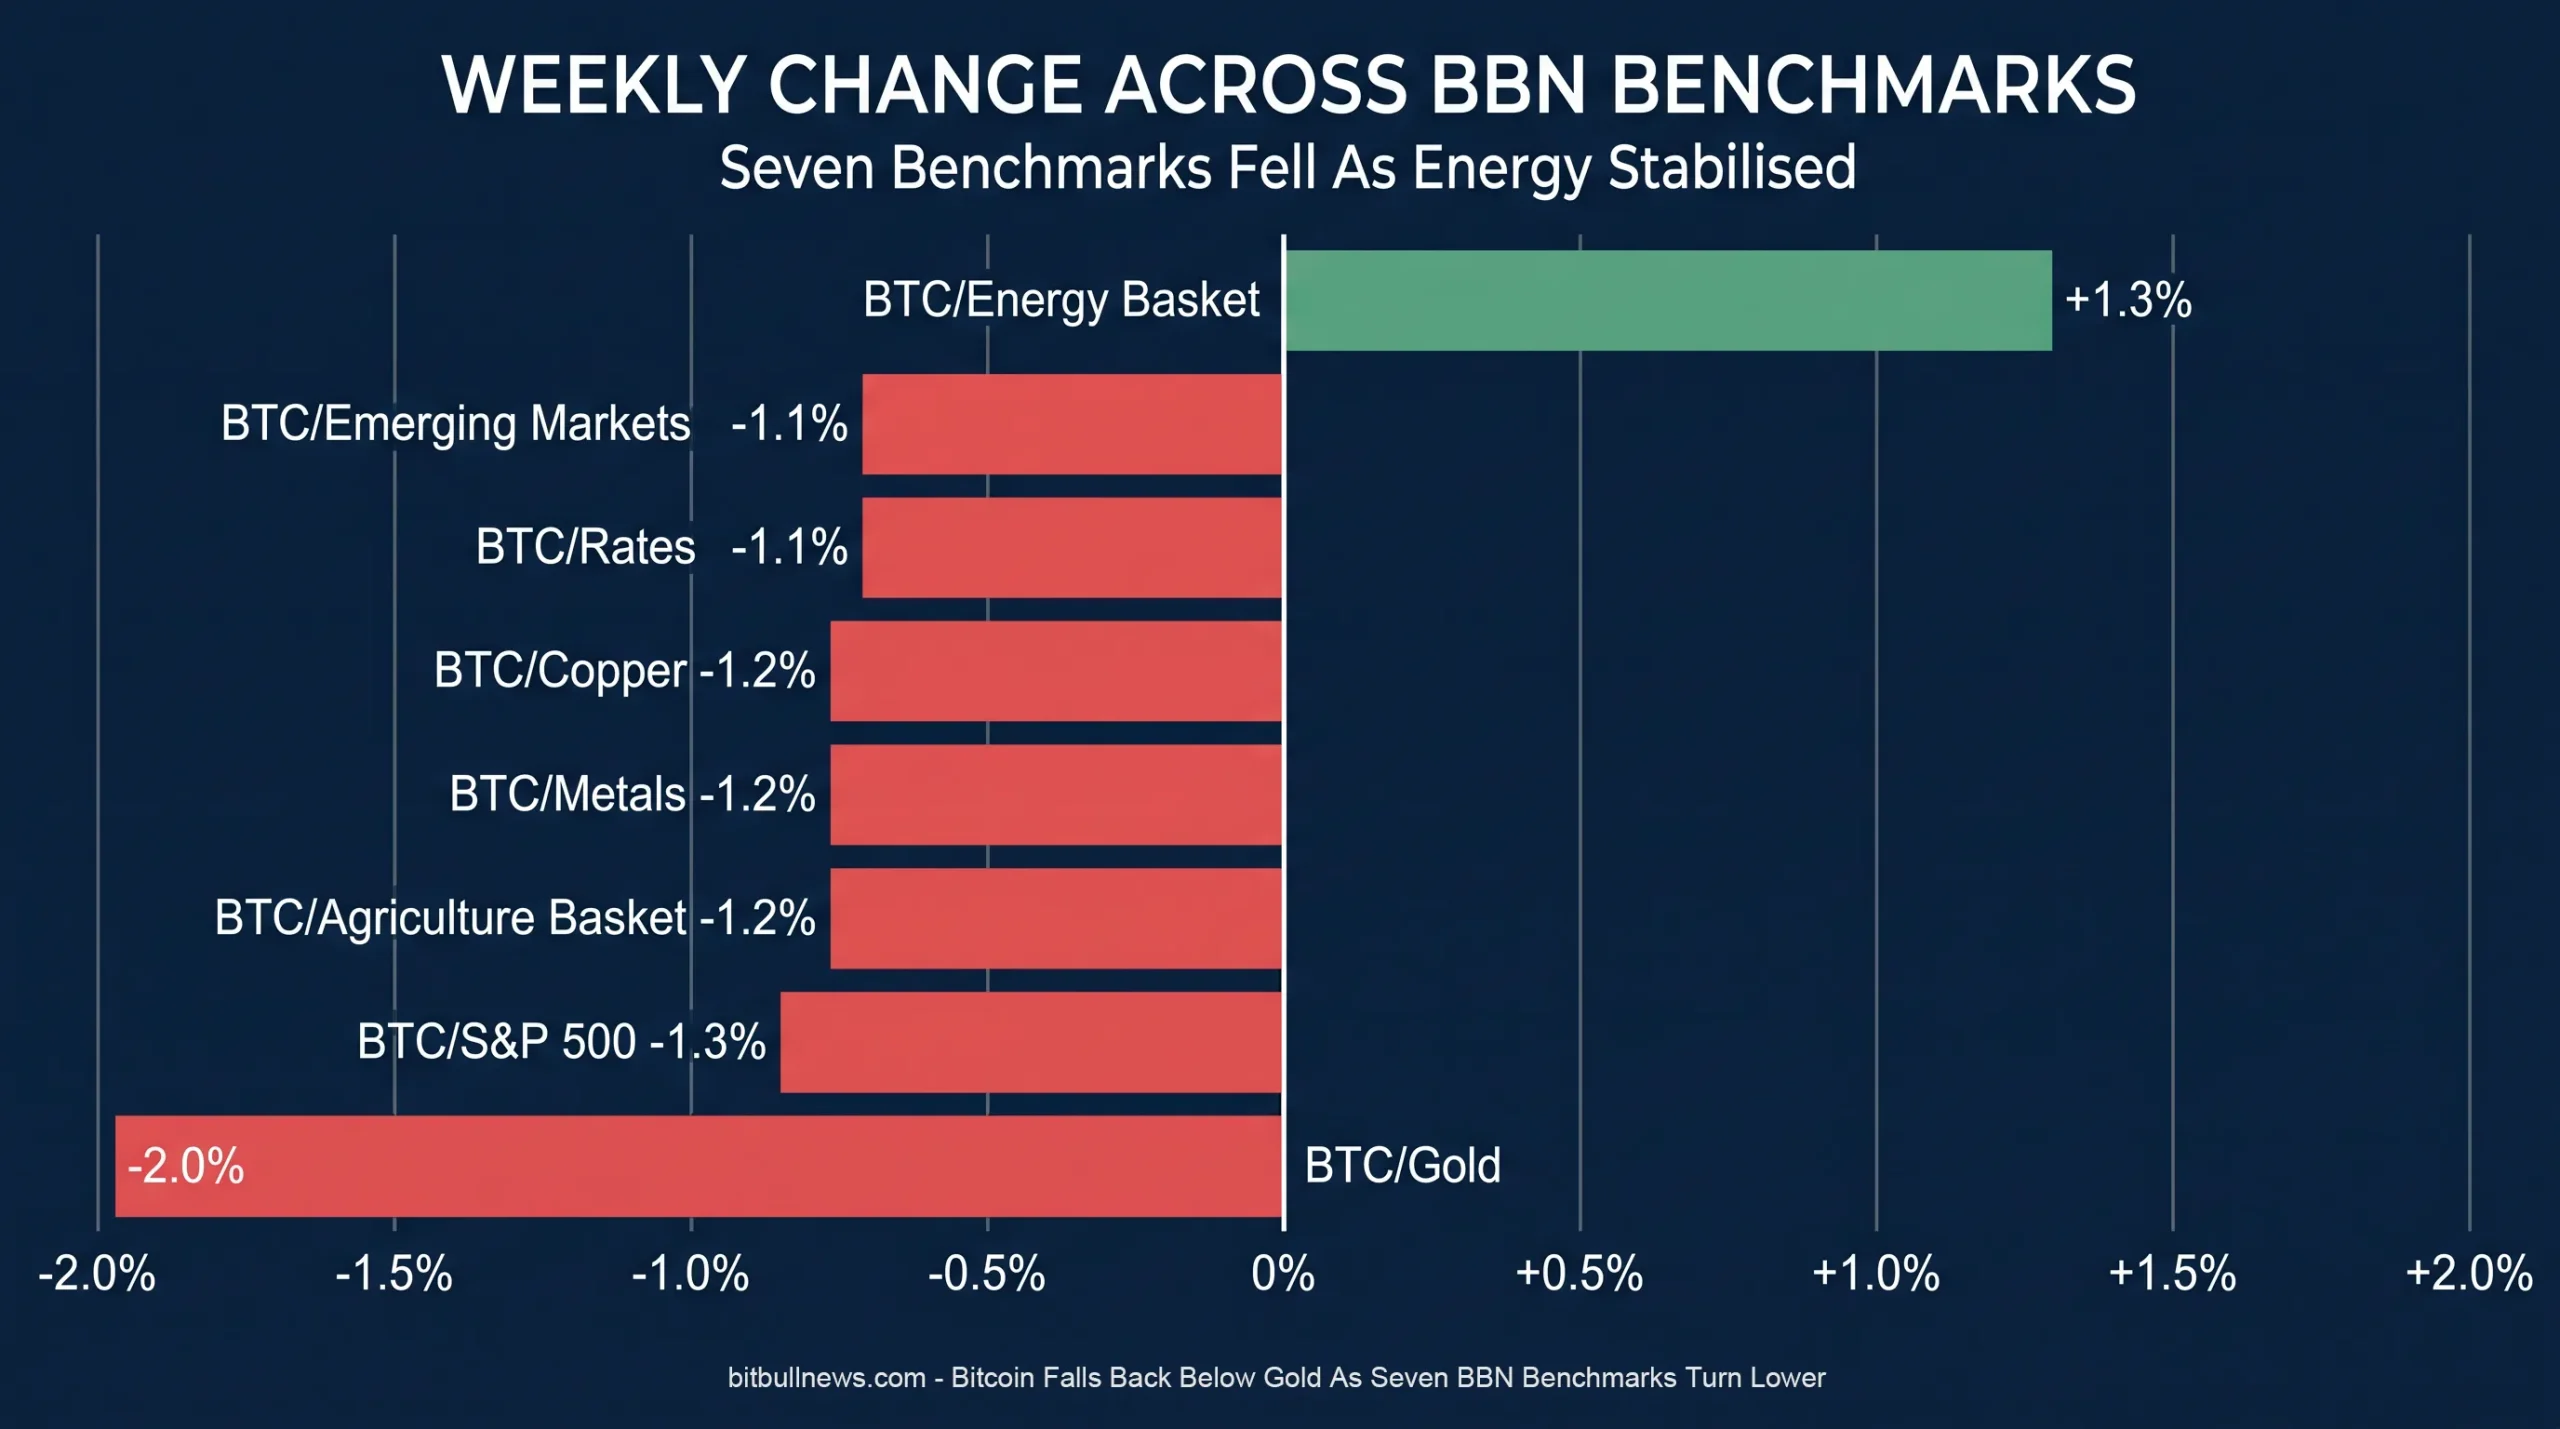
| BBN BTC/Gold | 99 | 101 | −2 | −2.0% | −1 |
| BBN BTC/Copper | 84 | 85 | −1 | −1.2% | −16 |
| BBN BTC/S&P 500 | 78 | 79 | −1 | −1.3% | −22 |
| BBN BTC/Metals | 83 | 84 | −1 | −1.2% | −17 |
| BBN BTC/Emerging Markets | 86 | 87 | −1 | −1.1% | −14 |
| BBN BTC/Rates | 88 | 89 | −1 | −1.1% | −12 |
| BBN BTC/Energy Basket | 78 | 77 | +1 | +1.3% | −22 |
| BBN BTC/Agriculture Basket | 82 | 83 | −1 | −1.2% | −18 |
| BBN Family Average | 84.8 | 85.6 | −0.9 | −1.0% | −15.2 |
Seven declining benchmarks produced a combined loss of eight index points. The one-point improvement in BTC/Energy reduced the net family loss to seven points.
| BBN Benchmark Group | Combined Point Change |
|---|---|
| Seven Declining BBN Benchmarks | −8 |
| BBN BTC/Energy Basket | +1 |
| Net BBN Family Change | −7 |
This was almost the mirror image of the previous BBN update, when energy overwhelmed an otherwise relatively stable scoreboard.
Bitcoin Held Near $64,000 Without Building A New Trend
Bitcoin entered the reporting period near $64,100 after falling from an earlier July high above $66,000.
It briefly moved above $65,000 during the week but could not convert the recovery into a durable breakout. Bitcoin closed July 30 near $64,725 before trading around $64,000 again on July 31.
The result was a market that looked stable in dollar terms but weak in relative terms. Bitcoin did not collapse, yet most competing assets needed only modest gains—or smaller losses—to outperform it.
ETF demand improved after two weak sessions.
According to Farside Investors’ daily flow data, U.S. spot Bitcoin ETFs recorded $203.9 million of net inflows across the four completed sessions from July 27 through July 30.
| Date | Net U.S. Spot Bitcoin ETF Flow |
|---|---|
| July 27 | −$11.6 million |
| July 28 | −$49.7 million |
| July 29 | +$32.1 million |
| July 30 | +$233.1 million |
| Four-Session Total | +$203.9 million |
The pattern was constructive but late.
The first two sessions extended the withdrawals that began at the end of the previous week. Positive flows returned after the Federal Reserve meeting, culminating in a strong $233.1 million inflow on July 30.
That demand helped prevent a deeper Bitcoin decline. It did not arrive early enough, or with enough continuity, to reverse the week’s relative-performance trend.
Bitcoin’s market structure also faced renewed pressure from the corporate sector. Strategy reported a large quarterly loss tied primarily to the decline in the value of its Bitcoin holdings, while Coinbase missed earnings and revenue expectations as trading activity remained weak. Those reports reinforced the difference between a stable BTC price and a healthy crypto risk environment.
Bitcoin’s Gold Breakout Lasted One Week
BTC/Gold recorded the largest negative move, falling 2.0% from 101 to 99.
The previous reading had carried clear symbolic weight. Bitcoin had crossed above the neutral reference line and moved ahead of the traditional defensive monetary asset.
The new update removes that breakout.
Gold strengthened after the Federal Reserve left the federal funds target range unchanged at 3.50%–3.75%. COMEX gold rose 1.58% on July 30 to settle at $4,100.10 per ounce, its strongest close in more than a week. Bitcoin also reacted positively to the Fed decision but failed to hold a comparable move.
Gold received support from several directions.
The Fed did not deliver the rate increase preferred by three members of the Federal Open Market Committee. Geopolitical risk remained elevated. Physical and official-sector demand also continued to provide a floor, with second-quarter central-bank purchases reported at 289 tonnes.
Bitcoin, by contrast, remained dependent on renewed ETF buying and broad risk appetite. It attracted neither the full defensive demand flowing into gold nor the earnings-based demand supporting equities.
The decline from 101 to 99 should not be interpreted as a complete breakdown in Bitcoin’s monetary position. It remains only one point below neutral and materially stronger against gold than against every other comparison in the family.
It does show that the first move above 100 lacked confirmation.
Bitcoin did not establish a sustained lead over gold. It briefly reached parity during a favourable week and then surrendered it when defensive demand returned.
The Federal Reserve Hold Was Not A Liquidity Signal
BTC/Rates declined from 89 to 88, even though the Federal Reserve left its policy rate unchanged.
The direction may initially appear counterintuitive. A rate hold is normally less restrictive than an increase, and Treasury yields did not rise materially across the full observation period.
The ten-year Treasury yield moved from 4.69% on July 24 to 4.68% on July 30. The two-year yield declined from 4.33% to 4.30%.
| Treasury Maturity | July 24 | July 30 | Change |
|---|---|---|---|
| 2-Year Yield | 4.33% | 4.30% | −3 bps |
| 10-Year Yield | 4.69% | 4.68% | −1 bp |
The problem for Bitcoin was that the Fed’s hold did not amount to a pivot.
The FOMC statement described economic activity as solid and inflation as elevated. Three policymakers voted for a 25-basis-point increase—the first three-way dissent in favour of tighter policy in a decade. Chair Kevin Warsh emphasised price stability and declined to provide a clear signal that easier policy was approaching.
The economic data supported that caution.
The advance estimate for second-quarter GDP showed annualised growth of 1.5%. That was slower than the first quarter’s 2.1%, but domestic private demand remained firm. Real final sales to private domestic purchasers increased at a 3.9% rate.
Inflation sent conflicting signals. The monthly PCE price index fell 0.1% in June, and core prices rose only 0.1%. On a year-over-year basis, however, headline PCE inflation remained at 3.7% and core PCE at 3.3%. The quarterly PCE price index increased at a 5.1% annualised rate in the second quarter.
Labour costs also remained firm. The Employment Cost Index increased 0.9% in the second quarter and 3.4% over the preceding 12 months.
The rate environment therefore became slightly less severe without becoming supportive.
Bitcoin failed to capitalise on the modest decline in yields because risk-free returns remained high, the Fed preserved a tightening bias and inflation uncertainty prevented markets from pricing a clear easing cycle.
The move from 89 to 88 captures that distinction. Rates did not surge against Bitcoin. They simply continued to offer enough return and policy credibility to keep BTC on the weaker side of the comparison.
Corporate Earnings Kept The S&P 500 Ahead
BTC/S&P 500 fell from 79 to 78, returning the equity benchmark to a tie with energy as Bitcoin’s weakest current comparison.
The S&P 500 was not uniformly strong during the week. Trading was volatile, and investors remained divided over the cost and eventual returns of the artificial-intelligence investment cycle.
Strong earnings from Microsoft, Amazon and other large technology companies nevertheless restored confidence in cloud demand, data-center spending and AI infrastructure. Microsoft’s results helped drive a 1.7% S&P 500 rally and a 2.8% Nasdaq gain on July 30. By that point, the S&P 500 was up approximately 0.3% for the week.
Friday remained volatile as Amazon’s rally offset a sharp decline in Apple, but the major U.S. indices continued to trade slightly higher during the session.
Bitcoin did not participate fully in that earnings-driven recovery.
The distinction matters because the equity move was not a generic speculative rally. Investors rewarded companies reporting revenue, profits and visible demand for computing infrastructure. Bitcoin had ETF flows, but it did not have an equivalent fundamental catalyst.
This remains the structural disadvantage highlighted throughout the BBN series.
The S&P 500 offers exposure to profitable technology companies, financial institutions, healthcare, industrials, energy producers and consumer businesses. Bitcoin offers scarcity, liquidity sensitivity and a monetary narrative, but no earnings or direct cash flow.
At 78, BTC/S&P 500 sits 22 points below neutral. The weekly decline was only one point, but the level remains severe.
Bitcoin can trade alongside U.S. equities during risk-on periods. It has not yet shown that it can consistently outperform the broad equity market.
Copper And Industrial Metals Retained Their Physical Premium
BTC/Copper fell from 85 to 84, while BTC/Metals declined from 84 to 83.
Both moves were limited to one point. Together, they show that the industrial complex continued to preserve slightly more relative strength than Bitcoin.
Copper remained supported by tightening physical supply conditions.
Large quantities of refined copper had moved into U.S. warehouses ahead of a potential tariff decision, reducing availability elsewhere. COMEX inventories approached 714,000 short tons, more than double their level a year earlier. Chinese import premiums also climbed as restrictions on scrap flows tightened the domestic market.
The underlying demand narrative remained intact. Power infrastructure, electrification and data-center construction continued to support long-term copper consumption expectations. Copper ended July with a monthly gain of approximately 3%, despite volatile daily trading.
The broader industrial-metals basket is less dependent on one commodity.
Under the BBN Industrial Metals methodology, copper carries 40% of the weight and aluminium 25%. Nickel, zinc, lead and tin make up the remaining 35%.
| Industrial Metal | Basket Weight |
|---|---|
| Copper | 40% |
| Aluminium | 25% |
| Nickel | 15% |
| Zinc | 10% |
| Lead | 5% |
| Tin | 5% |
Copper and aluminium together represent 65% of the benchmark, while the remaining metals add exposure to battery demand, manufacturing, construction and constrained mine supply.
Bitcoin did not suffer a major defeat against either copper or the broader basket. It simply failed to generate enough upside to offset the physical premium embedded in metals markets.
The result is another week in which real-asset scarcity proved more durable than Bitcoin’s scarcity narrative.
BTC/Copper remains 16 points below neutral. BTC/Metals sits 17 points below. Those gaps have narrowed only marginally since early July.
Emerging-Market Technology Recovered Faster Than Bitcoin
BTC/Emerging Markets slipped from 87 to 86.
The BBN Emerging Markets benchmark uses the MSCI Emerging Markets Net Total Return Index in U.S. dollars. Unlike several FTSE-based indices, the MSCI benchmark classifies South Korea as an emerging market.
That distinction was especially important this week.
South Korean and Taiwanese technology shares experienced extreme volatility as investors moved between concerns over AI valuations and renewed confidence in data-center spending.
On July 31, South Korea’s Kospi staged a historic rebound led by Samsung Electronics and SK Hynix. Taiwan’s market also advanced sharply as TSMC and other hardware companies benefited from strong U.S. cloud and AI earnings.
The rally did not erase the earlier damage. South Korean equities had experienced severe forced selling and remained sharply lower for the month. It was nevertheless sufficient to improve the late-week performance of an MSCI index heavily exposed to Asian technology and semiconductor companies.
Bitcoin also received a late boost from ETF inflows but did not match the intensity of the semiconductor rebound.
The one-point decline in BTC/Emerging Markets therefore reflects timing as much as direction. Both sides were volatile. EM equities recovered more aggressively during the final part of the observation window.
At 86, the benchmark remains one of Bitcoin’s stronger readings. It is also the only comparison apart from gold that remains above its July 10 level.
That relative resilience has limits. Bitcoin is still 14 points below neutral against a higher-beta equity universe that is itself exposed to currency pressure, geopolitical risk and external financing conditions.
Energy Finally Gave Bitcoin Some Relief
BTC/Energy was the only benchmark to improve, rising 1.3% from 77 to 78.
The increase followed two extraordinary weeks in which the benchmark collapsed from 96 to 77 as oil and refined products surged.
Crude prices finally surrendered part of that move.
Brent fell from above $100 to approximately $92 on July 27 as the United States and Iran paused attacks. It later dropped toward $84 as diplomatic activity and efforts to secure key shipping routes reduced the immediate disruption premium.
The decline was not smooth. Renewed attacks and uncertainty around the Strait of Hormuz and Red Sea caused several sharp reversals. Brent rose more than 7% on July 29 before retreating again, illustrating how quickly geopolitical risk continued to move the market.
The improvement in BTC/Energy was smaller than the headline decline in crude might suggest because the benchmark does not measure Bitcoin against oil alone.
The BBN Energy Basket methodology assigns 55% to crude oil, 25% to refined products and 20% to Henry Hub natural gas.
| Energy Component | Basket Weight |
|---|---|
| WTI Crude | 30% |
| Brent Crude | 25% |
| Henry Hub Natural Gas | 20% |
| RBOB Gasoline | 15% |
| ULSD | 10% |
Refined-product markets remained tighter than crude markets. The International Energy Agency reported that refining margins and product cracks had reached four-year highs, reflecting restricted refinery availability and tight gasoline and diesel conditions.
U.S. commercial crude inventories also fell by 7.2 million barrels in the latest reported week, while refinery utilisation reached 97.2%. Those conditions prevented the broader energy complex from falling as quickly as the most visible crude contracts.
Bitcoin’s own lack of momentum further limited the rebound.
BTC/Energy rose by only one point despite a meaningful oil retreat because Bitcoin was not rallying strongly against a collapsing basket. Both sides were volatile, and significant fuel-market tightness remained beneath the decline in crude.
At 78, energy is still tied with the S&P 500 as Bitcoin’s weakest benchmark. The relief is real, but the damage from the July oil shock remains almost entirely intact.
Agriculture Beat Bitcoin Without A Broad Commodity Rally
BTC/Agriculture declined from 83 to 82.
Agricultural markets were mixed rather than uniformly strong. Wheat remained sharply lower across the week, while improving U.S. weather forecasts reduced concerns around corn and soybean production. Soybeans received some support from a fresh export sale to China, and Black Sea logistics continued to provide an intermittent geopolitical premium.
The benchmark’s construction matters.
The BBN Agriculture Basket gives 70% of its weight to wheat, corn and soybeans. Sugar, cotton, coffee and cocoa account for the remaining 30%.
| Agriculture Component | Basket Weight |
|---|---|
| Wheat | 25% |
| Corn | 25% |
| Soybeans | 20% |
| Sugar | 10% |
| Cotton | 10% |
| Coffee | 5% |
| Cocoa | 5% |
The basket did not need to stage a powerful rally for BTC/Agriculture to decline. It only needed to outperform a largely directionless Bitcoin market over the aligned weekly observation.
Losses in wheat and parts of the oilseed complex were partially offset by supply risk, export demand and the soft-commodity components. The diversified basket therefore preserved slightly more relative value than Bitcoin.
The reading of 82 is significant because agriculture now sits 18 points above Bitcoin on the fixed-base scale.
Bitcoin’s monetary comparison with gold is nearly balanced. Its comparison with real consumption-linked inflation remains much weaker.
That difference continues to complicate the simple claim that Bitcoin is a universal inflation hedge. BTC is close to parity with a financial store of value but materially behind the commodity basket most directly connected to food and household purchasing power.
The Week Reversed The Previous Pattern
The contrast between the last two updates is unusually clear.
From July 18 to July 24, five benchmarks improved. Energy fell eight points and overwhelmed an otherwise constructive week.
From July 24 to July 31, energy improved by one point. Every other benchmark declined.
| Reporting Period | Improving Benchmarks | Declining Benchmarks | Main Driver |
|---|---|---|---|
| July 18–24 | 5 | 3 | Energy shock |
| July 24–31 | 1 | 7 | Broad BTC underperformance |
The seven-benchmark average excluding energy confirms the change.
| Aggregate Measure | July 24 | July 31 | Weekly Change |
|---|---|---|---|
| Full Family Average | 85.6 | 84.8 | −1.0% |
| Average Excluding Energy | 86.9 | 85.7 | −1.3% |
This is the central conclusion of the July 24–31 update.
Bitcoin’s weakness became broader just as the energy shock began to ease.
BTC did not lose heavily against any single non-energy asset. Gold gained two points, while the remaining six declining benchmarks moved by only one point each.
The breadth nevertheless matters more than the magnitude.
Bitcoin was unable to outperform defensive assets, industrial commodities, U.S. equities, emerging-market risk, rates or agricultural goods during the same reporting period. That is a more comprehensive signal than the previous week’s energy-driven decline.
The Benchmark Family Is Compressing Below Neutral
Gold remains the strongest benchmark at 99, but it is back below neutral.
Rates and emerging markets occupy the middle tier at 88 and 86. Copper follows at 84, while industrial metals and agriculture sit at 83 and 82.
Energy and the S&P 500 are tied at 78.
| Relative Position | Benchmarks |
|---|---|
| Near Neutral | BTC/Gold: 99 |
| Moderate Relative Deficit | BTC/Rates: 88; BTC/Emerging Markets: 86; BTC/Copper: 84 |
| Wider Relative Deficit | BTC/Metals: 83; BTC/Agriculture: 82 |
| Deepest Relative Deficit | BTC/S&P 500: 78; BTC/Energy: 78 |
The structure shows that Bitcoin’s macro problem is no longer limited to one category.
Gold represents defensive monetary demand. Rates represent the return available on safer capital. The S&P 500 represents earnings-backed risk exposure. Copper and metals represent physical investment and industrial scarcity. Agriculture and energy represent real-world inflation inputs.
Bitcoin remains below every one of them.
The gap is narrow against gold and substantially wider everywhere else.
The July Recovery Has Lost Momentum
The three-week comparison provides additional context.
| Benchmark | July 10 | July 31 | Three-Week Change |
|---|---|---|---|
| BTC/Gold | 97 | 99 | +2 |
| BTC/Copper | 84 | 84 | 0 |
| BTC/S&P 500 | 79 | 78 | −1 |
| BTC/Metals | 84 | 83 | −1 |
| BTC/Emerging Markets | 84 | 86 | +2 |
| BTC/Rates | 91 | 88 | −3 |
| BTC/Energy Basket | 96 | 78 | −18 |
| BTC/Agriculture Basket | 85 | 82 | −3 |
| Family Average | 87.5 | 84.8 | −2.7 |
Bitcoin remains stronger against gold and emerging markets than it was on July 10. Its copper position is unchanged.
Every other benchmark has deteriorated.
Energy remains the overwhelming three-week outlier, but rates and agriculture have also declined by three points. The S&P 500 and metals have slipped by one point each.
The family average has fallen from 87.5 to 84.8, a decline of 3.1%.
The July recovery therefore did not produce a broad regime change. It repaired part of Bitcoin’s position against gold and emerging markets while leaving most of the family below its mid-month level.
What To Watch Next
BTC/Gold is once again the nearest test.
A move from 99 back above 100 would show that the previous breakout was delayed rather than rejected. Continued gold demand combined with another range-bound Bitcoin week would push the benchmark further below neutral.
ETF flows need to remain positive beyond one large session.
The $233.1 million inflow on July 30 was encouraging, but the preceding withdrawals showed that institutional demand remains inconsistent. Bitcoin needs a sustained sequence of inflows to produce the kind of trend capable of lifting several benchmarks simultaneously.
The Federal Reserve remains the main cross-asset constraint.
The July hold prevented an immediate tightening shock, but three votes for a rate increase and the Fed’s continued focus on inflation kept the policy signal restrictive. Bitcoin will struggle to improve against rates, equities and gold at the same time while Treasury yields remain near 4.7%.
Energy could provide additional relief.
Crude has already surrendered much of its move above $100, but refined-product markets remain tight and geopolitical risk has not disappeared. BTC/Energy may recover if shipping conditions normalise and fuel margins ease. Another military escalation could quickly reverse the one-point gain.
The equity comparison remains the hardest structural test.
BTC/S&P 500 is back at 78, tied for the weakest reading in the family. Strong technology earnings continue to demonstrate why institutional capital can retain risk exposure without moving into crypto.
The July 24–31 update does not show a new Bitcoin collapse. It shows something more subtle and potentially more important.
Bitcoin held near $64,000, ETF inflows returned and oil retreated. Yet BTC still lost relative ground against seven of eight macro comparisons.
Price stability was not enough.
Bitcoin now needs a catalyst strong enough to create relative leadership—not merely prevent another decline.
Disclaimer
This article is for informational purposes only and does not constitute investment advice, a recommendation or a solicitation to buy or sell any asset. Digital assets, equities, commodities and fixed-income instruments can be highly volatile and involve substantial risk. Conduct independent research and consult a licensed financial professional before making investment decisions.