


Content
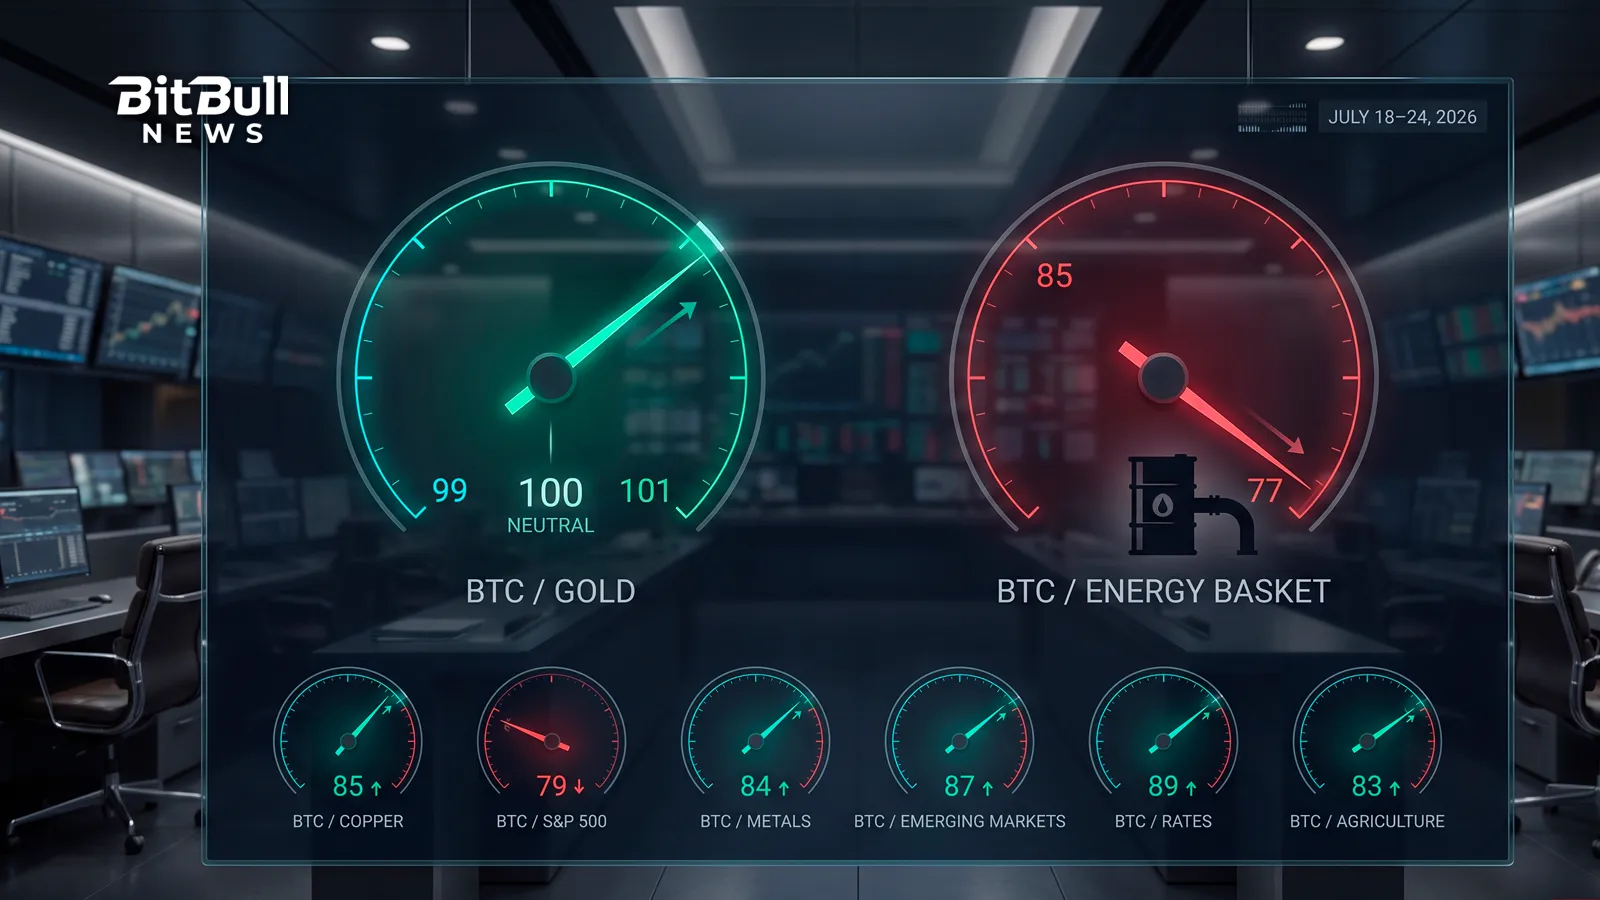
Bitcoin reached an important threshold during the week of July 18–24: it moved ahead of gold.

The BBN BTC/Gold benchmark rose from 99 to 101, becoming the first current reading in the BitBullNews macro benchmark family to cross the neutral level of 100. Bitcoin also gained relative ground against copper, the S&P 500, industrial metals and emerging markets.
That would normally describe a strong week.
The headline average says otherwise. The eight-benchmark family slipped from 86.0 to 85.6, a decline of 0.4%, because the energy shock that began during the previous reporting period intensified. BTC/Energy fell another eight points, from 85 to 77, a weekly drop of 9.4%.
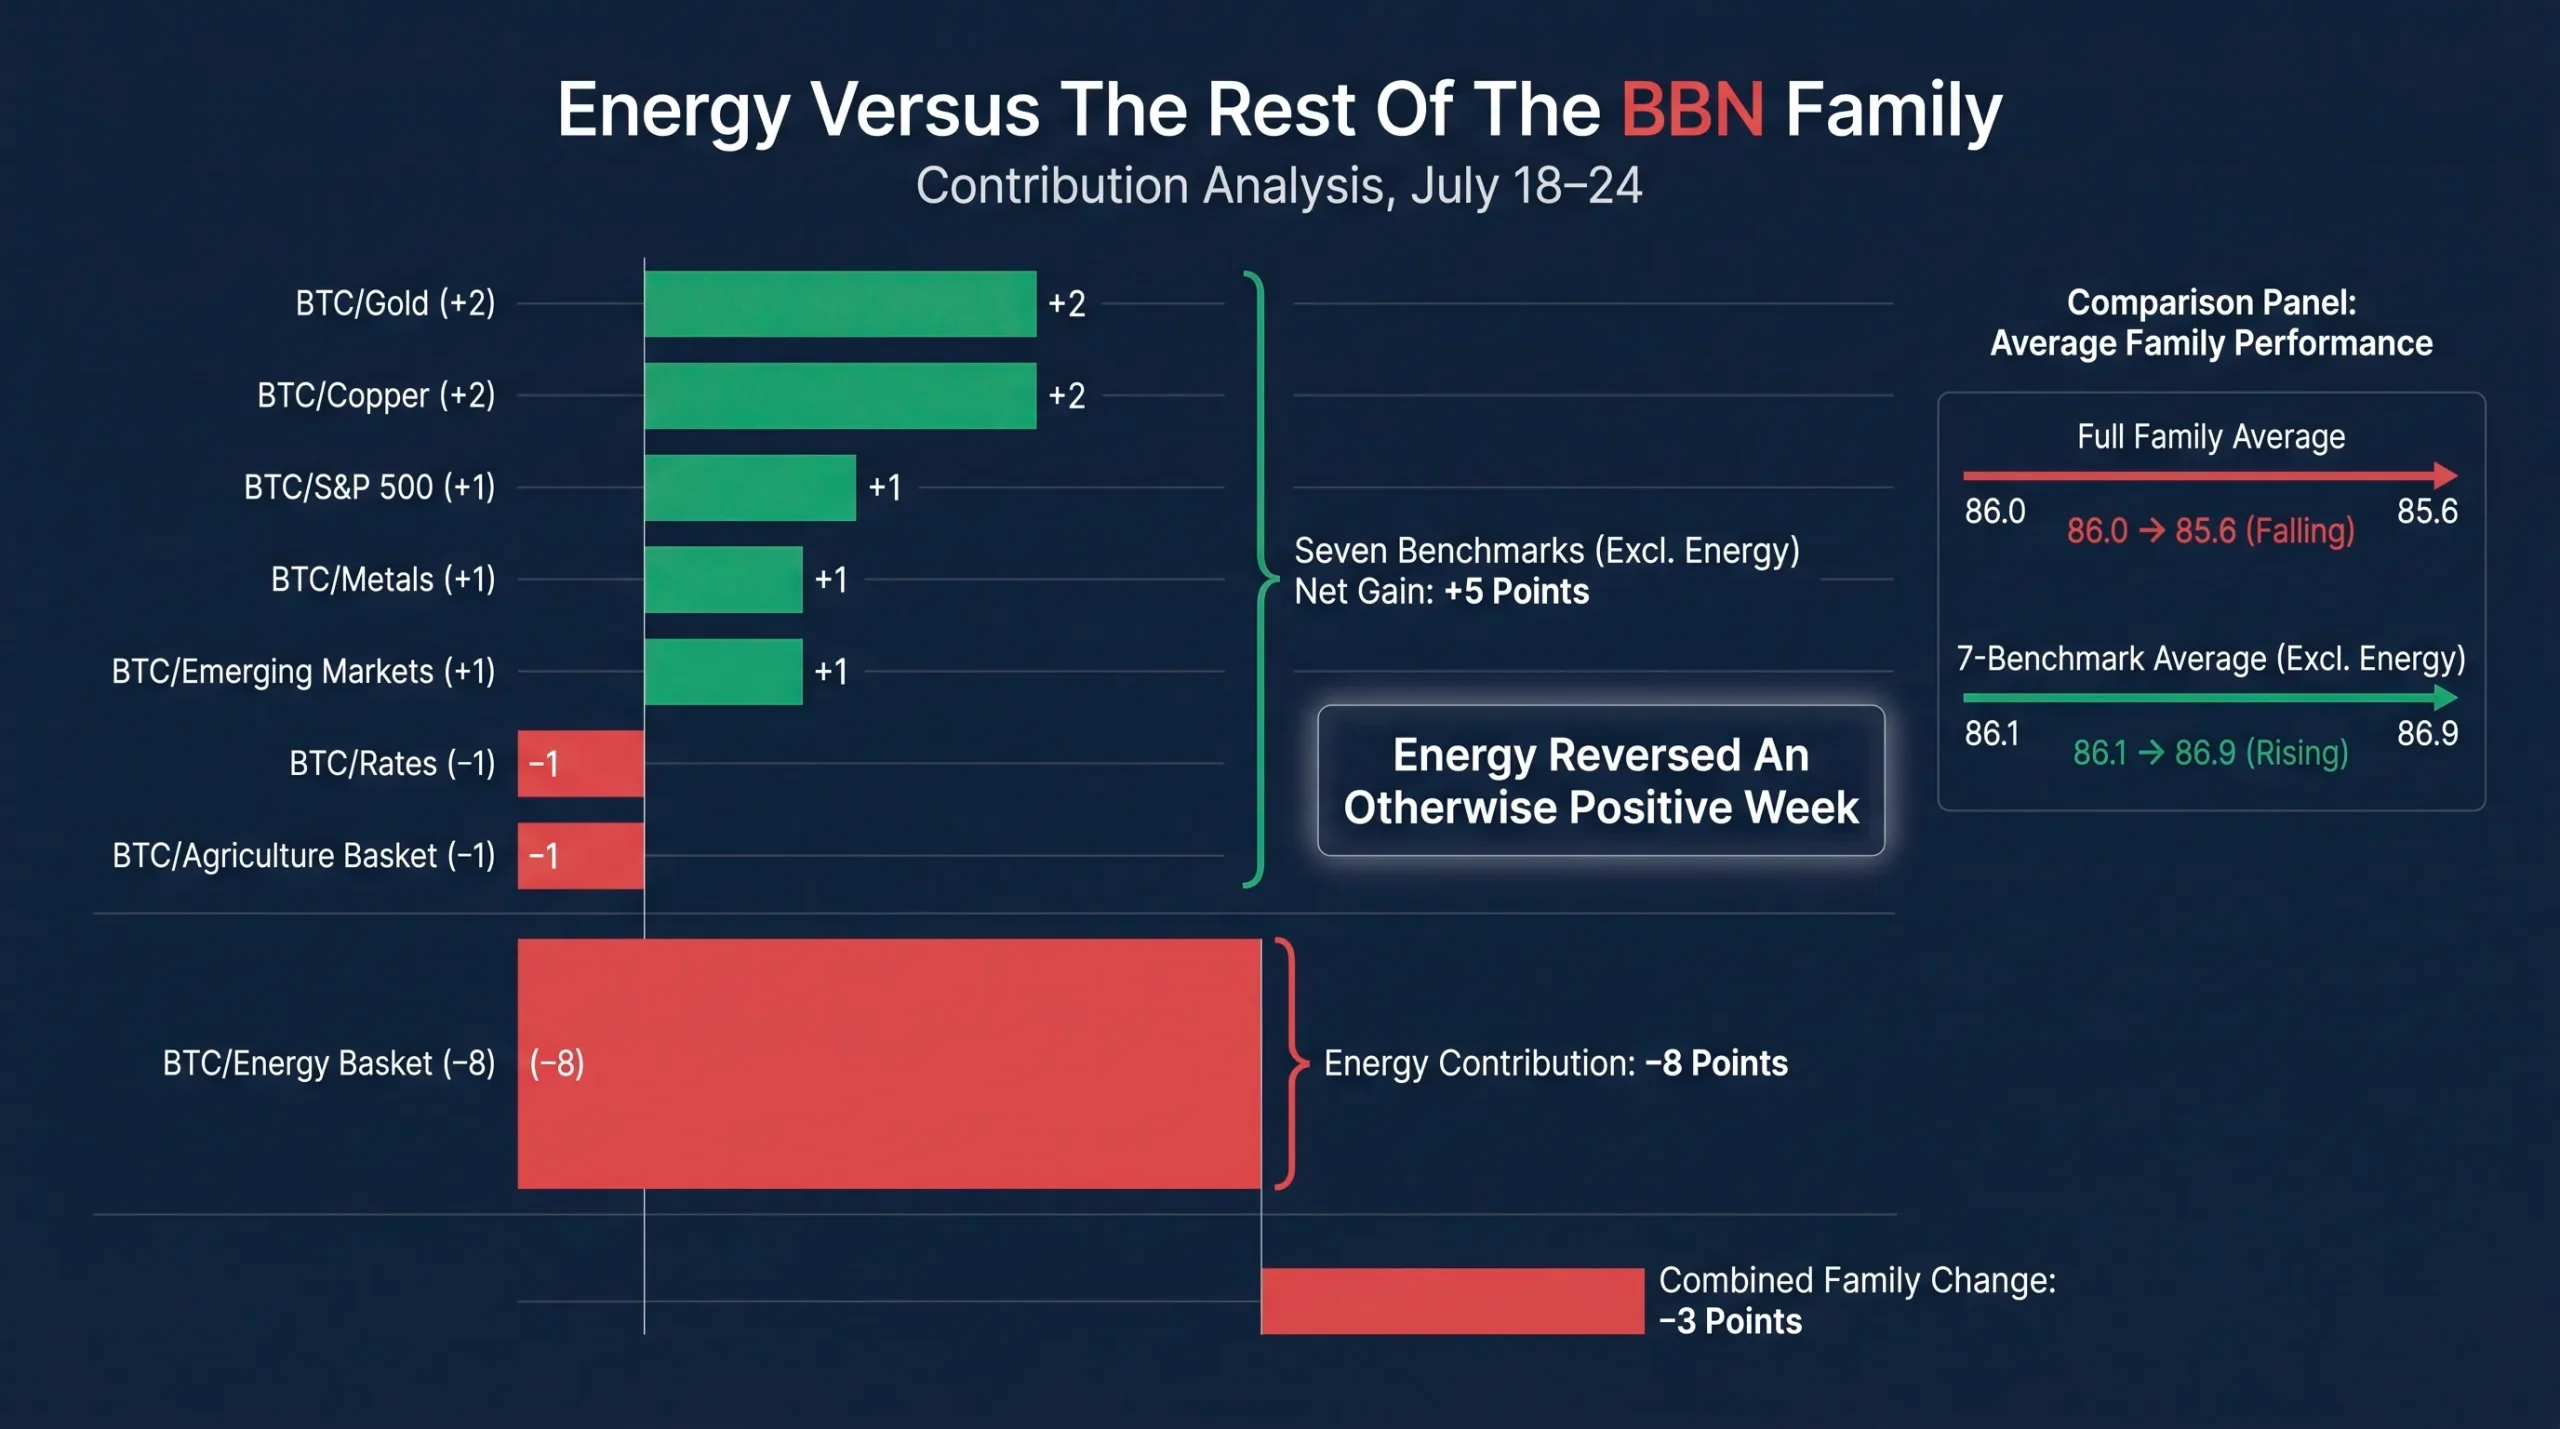
Strip energy out, and the picture changes completely. The average of the remaining seven benchmarks increased from 86.1 to 86.9, or roughly 0.8%. Energy lost eight points while the other seven comparisons produced a combined five-point gain.
The week was not a broad deterioration in Bitcoin’s macro position. It was a second concentrated defeat against oil and refined products, alongside genuine improvement against most financial and industrial assets.
The BBN Benchmarks now show a market split in two. Bitcoin is beginning to regain monetary and risk-asset credibility, but it is falling further behind the physical energy complex and the inflation pressure attached to it.
The Scoreboard
The BBN benchmark family compares Bitcoin with hard money, industrial demand, broad equity risk, emerging markets, interest-rate conditions and commodity baskets.
A reading of 100 is neutral. Above 100, Bitcoin is outperforming the comparison asset. Below 100, the comparison asset remains ahead.
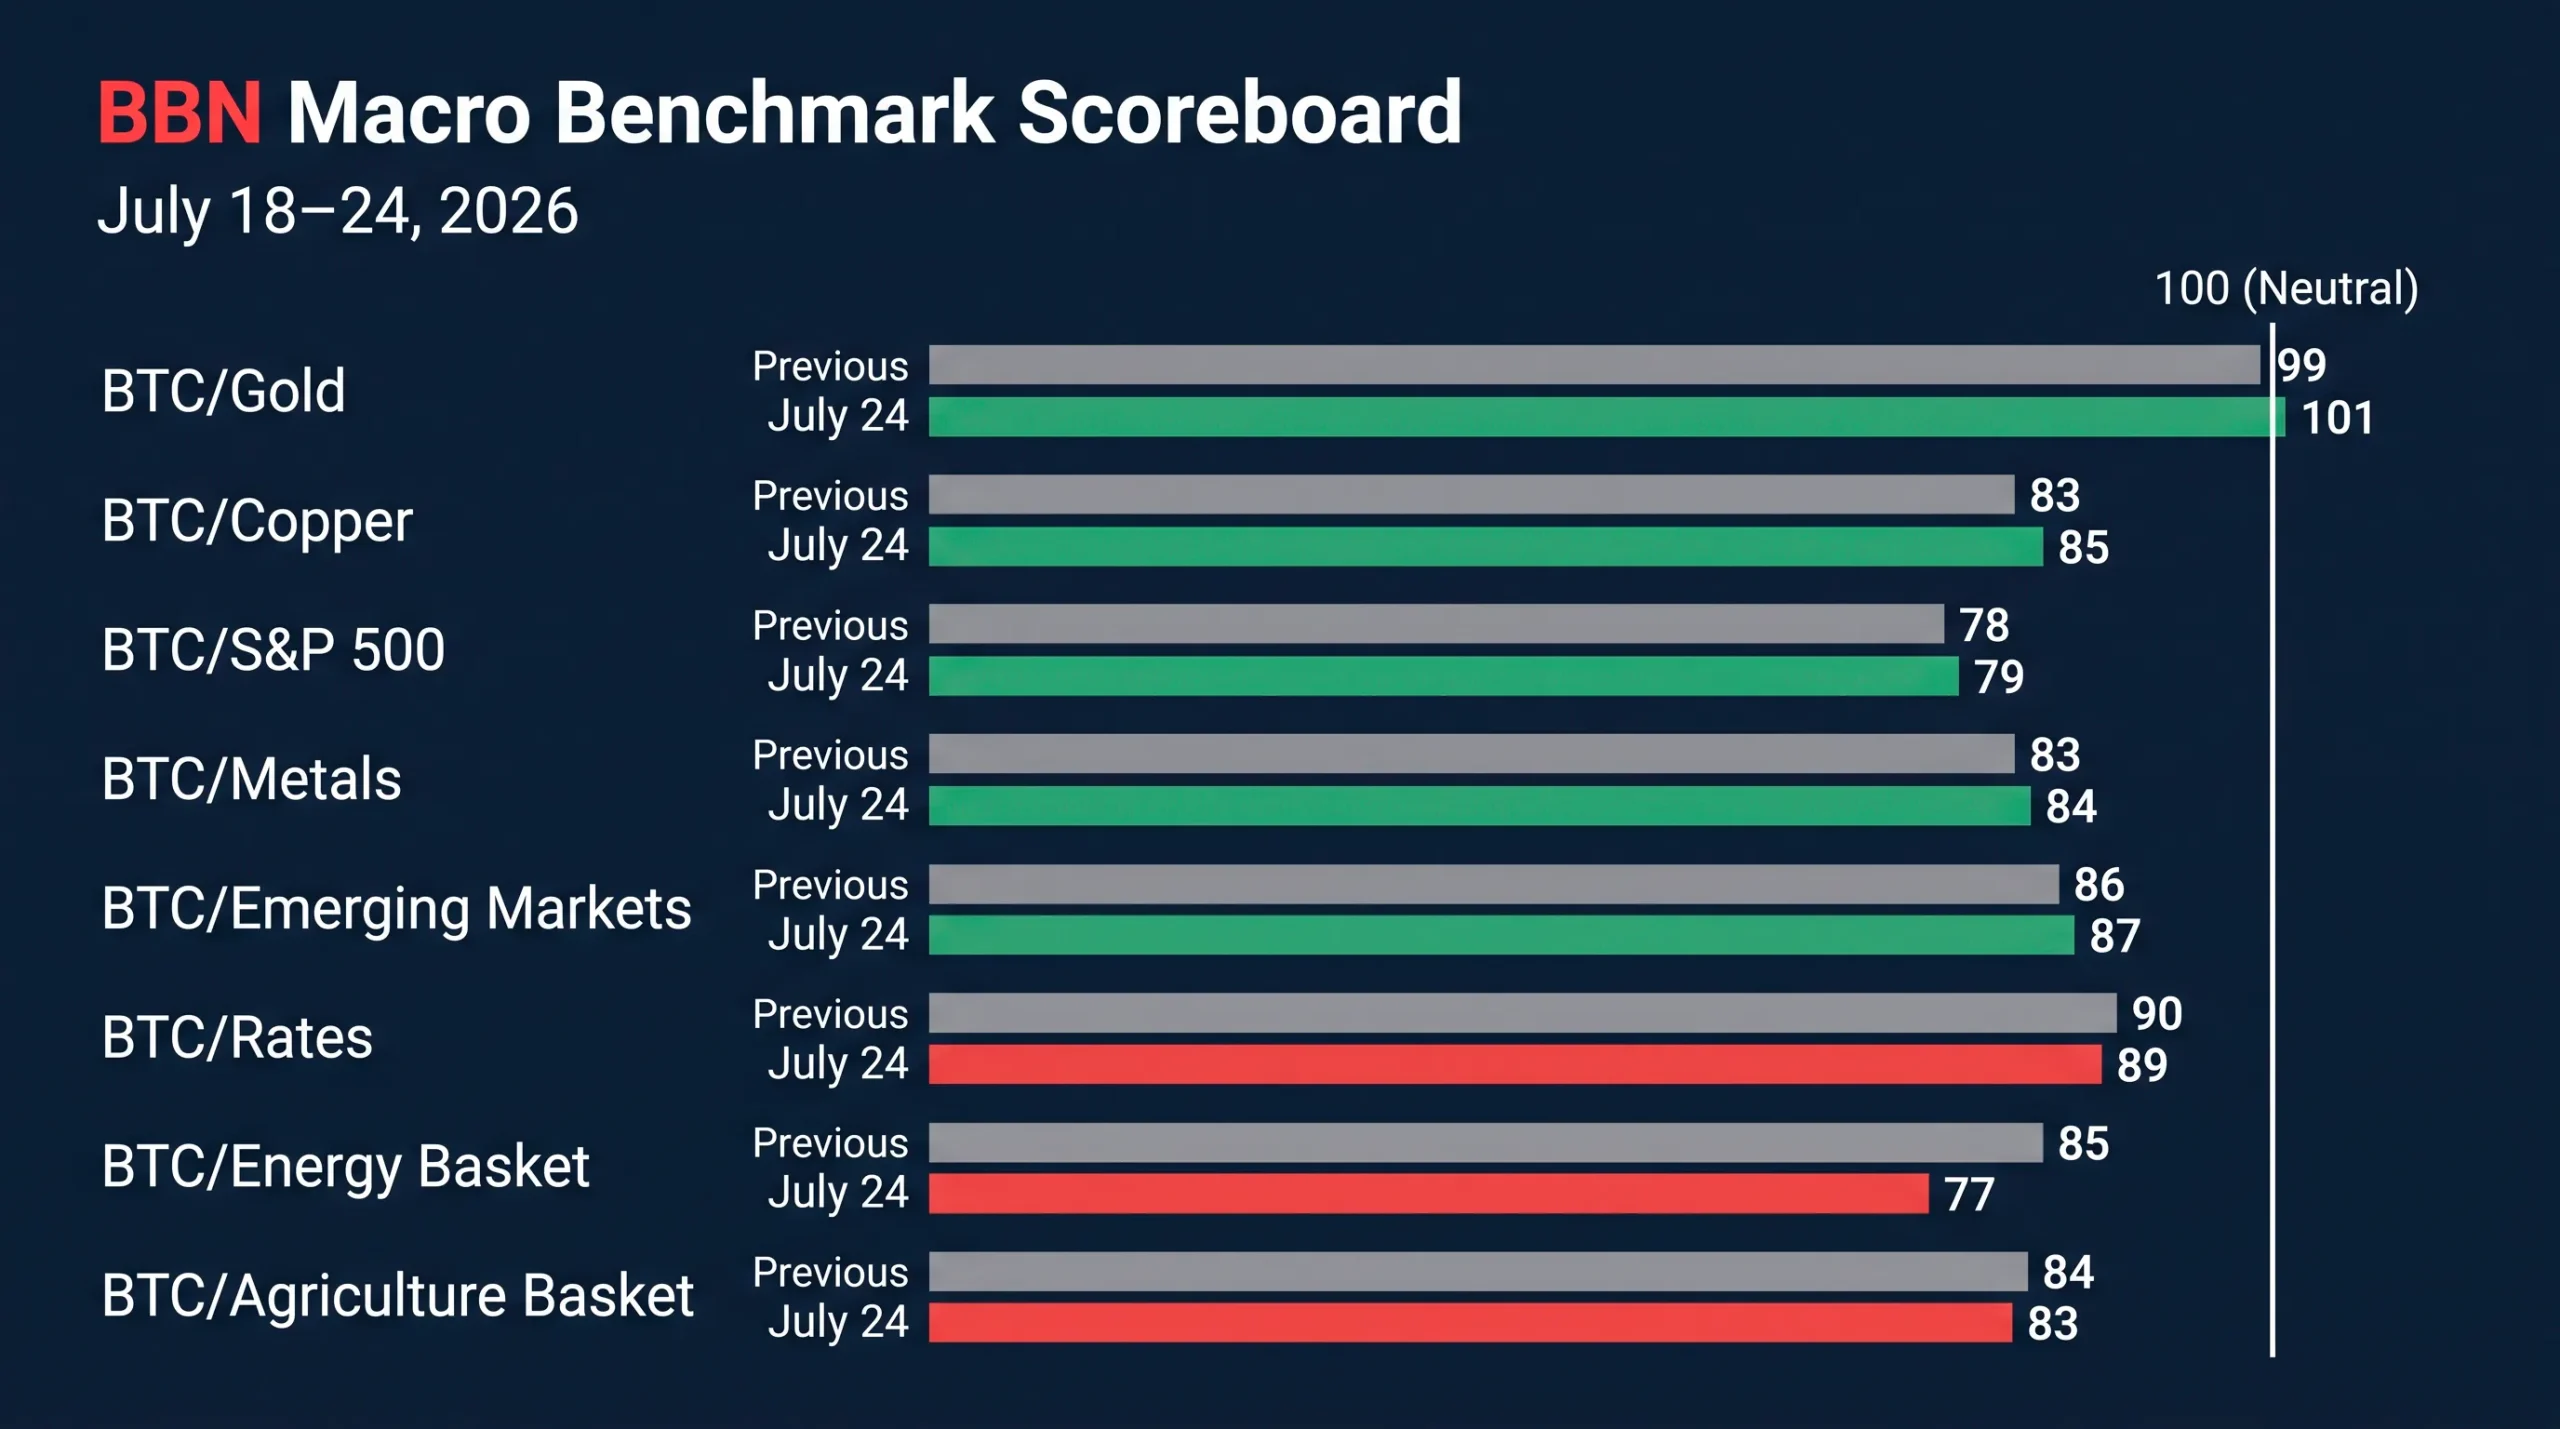
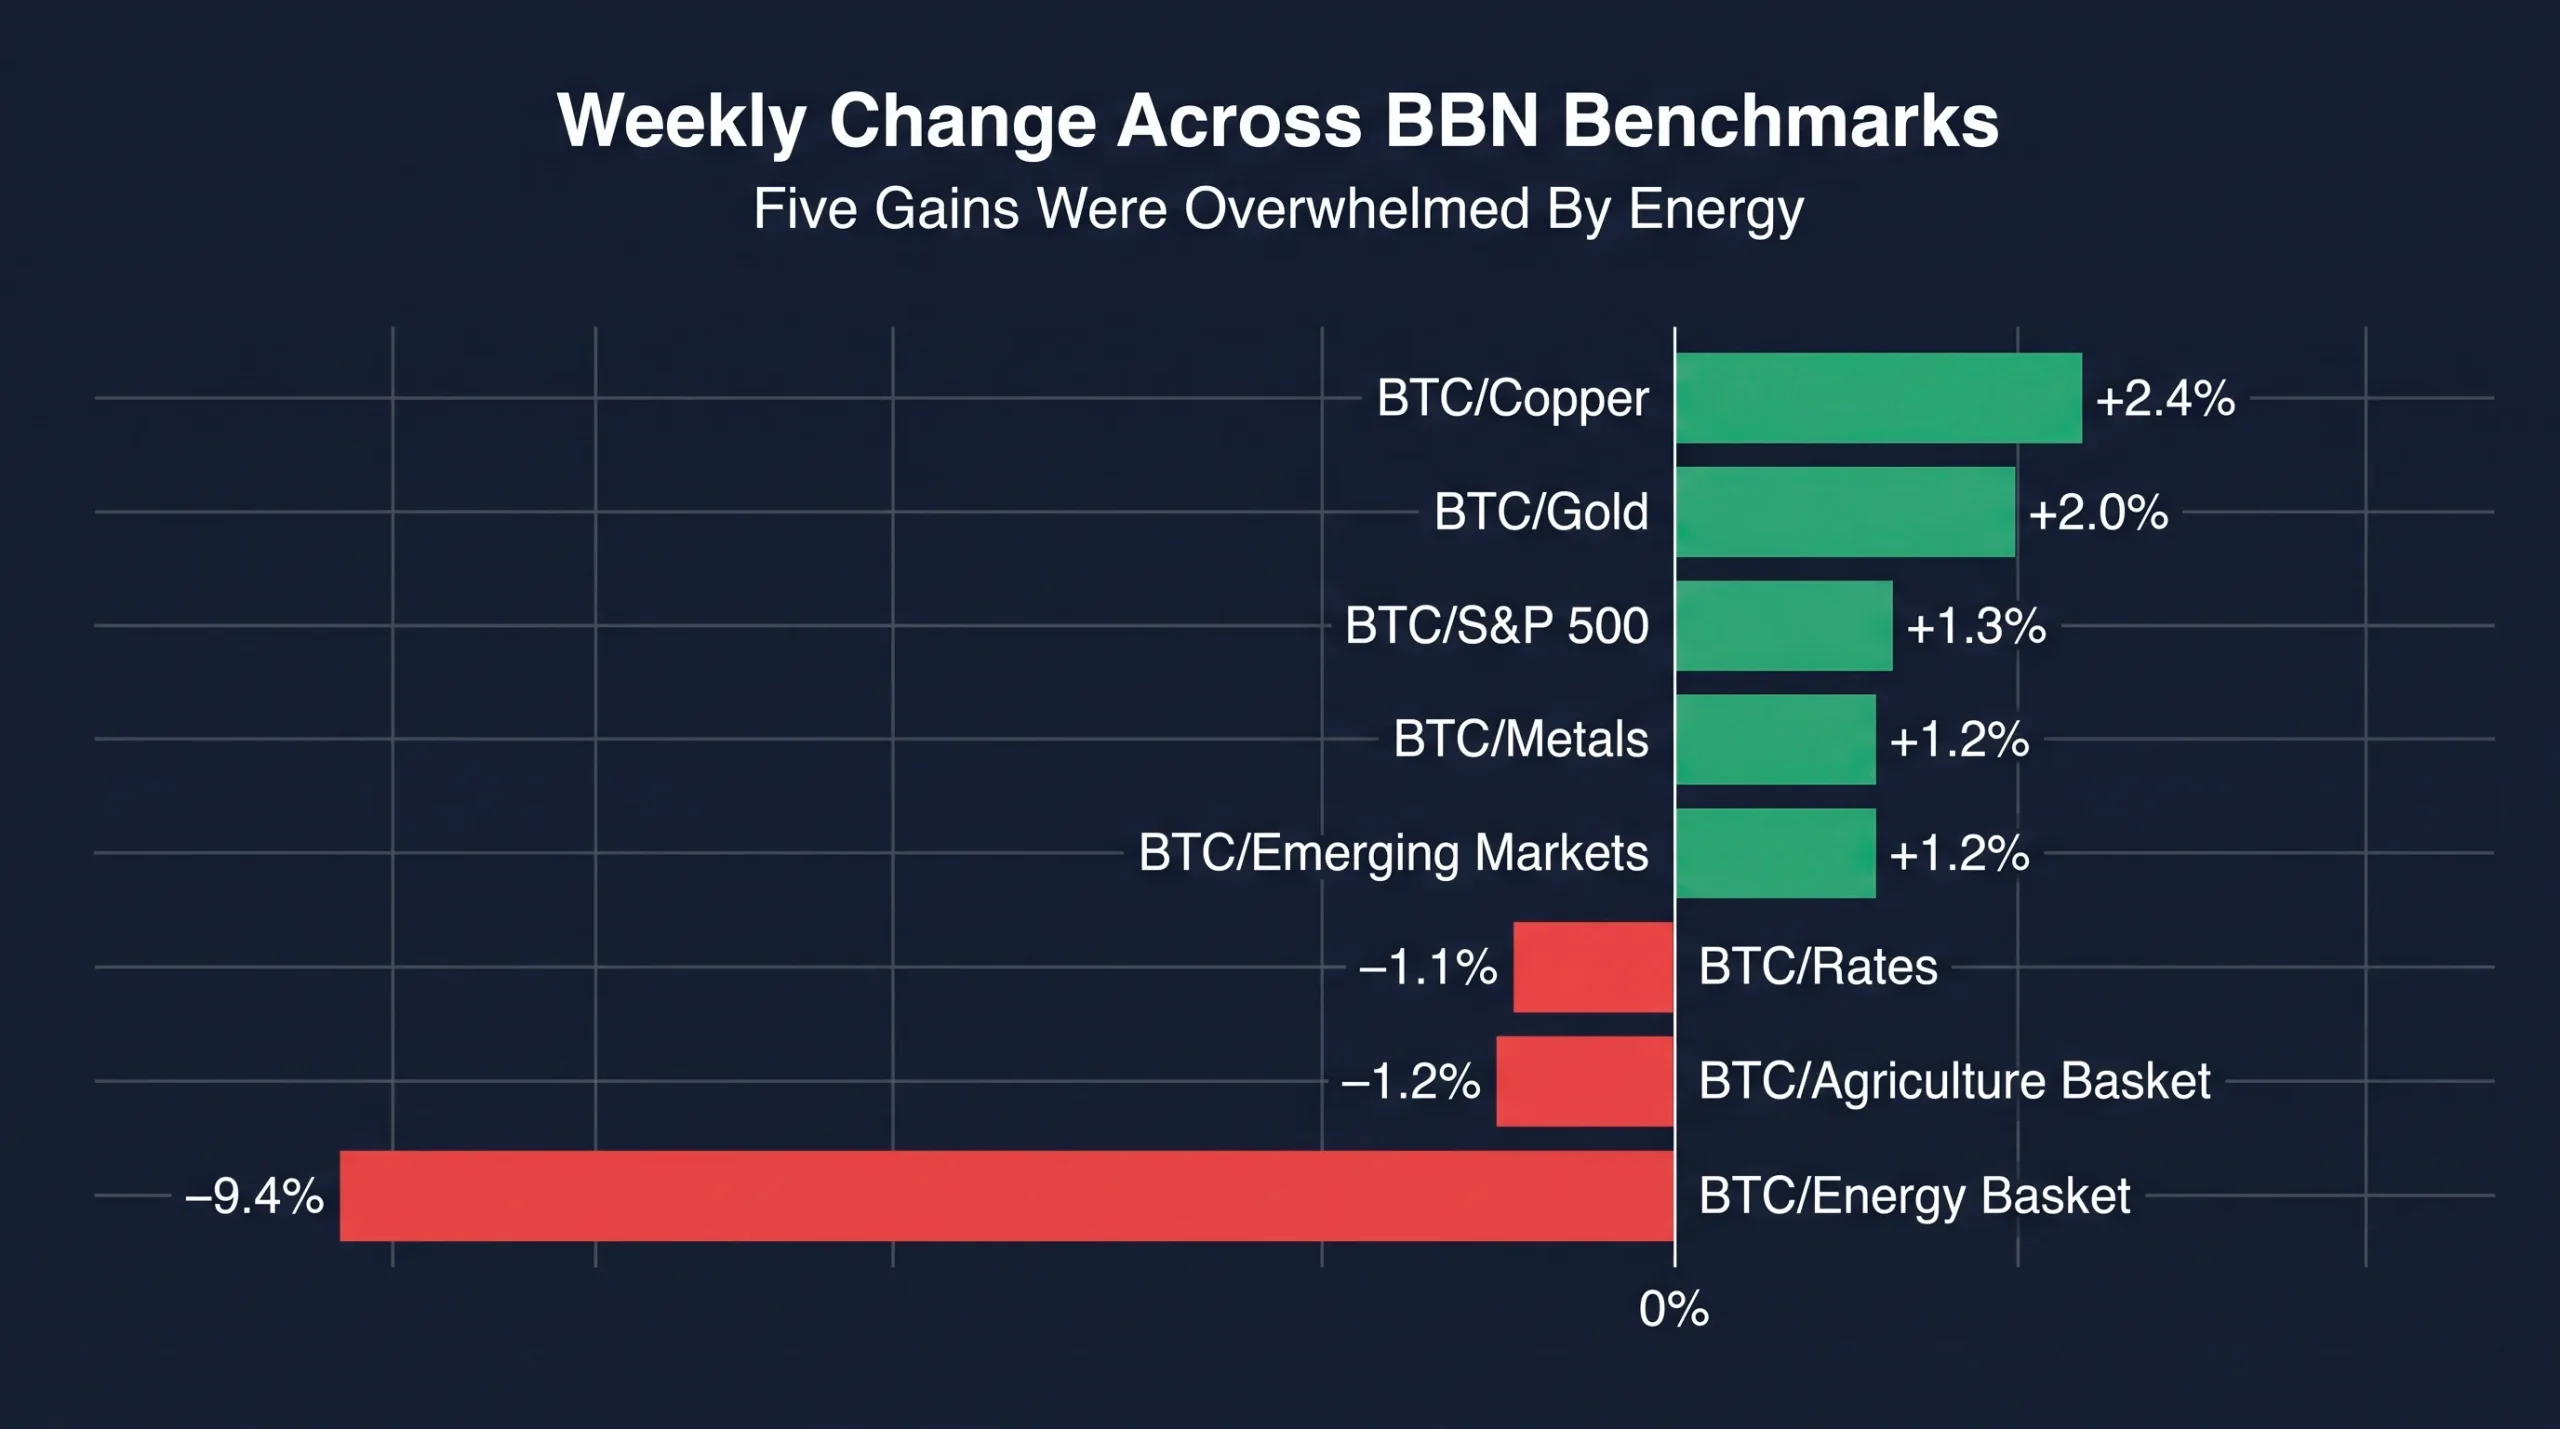
| Benchmark | July 24 | Previous | Point Change | Weekly Change | Gap From 100 |
|---|---|---|---|---|---|
| BBN BTC/Gold | 101 | 99 | +2 | +2.0% | +1 |
| BBN BTC/Copper | 85 | 83 | +2 | +2.4% | −15 |
| BBN BTC/S&P 500 | 79 | 78 | +1 | +1.3% | −21 |
| BBN BTC/Metals | 84 | 83 | +1 | +1.2% | −16 |
| BBN BTC/Emerging Markets | 87 | 86 | +1 | +1.2% | −13 |
| BBN BTC/Rates | 89 | 90 | −1 | −1.1% | −11 |
| BBN BTC/Energy Basket | 77 | 85 | −8 | −9.4% | −23 |
| BBN BTC/Agriculture Basket | 83 | 84 | −1 | −1.2% | −17 |
| BBN Family Average | 85.6 | 86.0 | −0.4 | −0.4% | −14.4 |
Five benchmarks improved and three declined.
More importantly, the distribution shifted. Energy replaced the S&P 500 as Bitcoin’s weakest macro comparison, falling to 77 against 79 for BTC/S&P 500. Gold, meanwhile, became the only benchmark above neutral.
The previous BBN review showed energy accounting for almost the entire family-wide decline. The same force remained dominant this week, but Bitcoin’s relative performance outside the energy complex improved materially.
BBN Macro Benchmark Scoreboard — Previous Reading Versus July 24
Bitcoin Found Buyers, But The Week Broke In Two
Bitcoin entered the week with improving institutional demand.
U.S. spot Bitcoin ETFs attracted $499.1 million over the first three trading sessions. That demand helped push BTC above $66,000 on July 21, its highest level since early June. Bitcoin traded near $66,610 during the rally as risk appetite improved and ETF inflows extended what had become a seven-session positive streak.
The second half was less convincing.
ETF investors withdrew $225.1 million on July 23 and another $240.1 million on July 24. The two-day reversal reduced the full-week balance to only $33.9 million.
| Date | Net U.S. Spot Bitcoin ETF Flow |
|---|---|
| July 20 | +$226.8 million |
| July 21 | +$203.2 million |
| July 22 | +$69.1 million |
| July 23 | −$225.1 million |
| July 24 | −$240.1 million |
| Weekly Total | +$33.9 million |
The sequence matters more than the final total.
Early-week inflows were strong enough to lift Bitcoin and improve five BBN comparisons. Late-week withdrawals then capped the rally as oil moved above $100, Treasury yields climbed and investors reduced exposure to high-beta assets.
Bitcoin finished the week near $64,000 after trading close to $67,000 earlier in the period. It held above the lows seen in June and early July, but the ETF reversal showed that institutional conviction remains sensitive to macro volatility.
This two-stage price action explains the benchmark results. Bitcoin gained enough to beat gold, equities and several industrial comparisons. It did not gain enough to keep pace with oil or offset the renewed rise in yields.
Bitcoin Crosses The Gold Neutral Line
BBN BTC/Gold rose 2.0%, from 99 to 101.
This is the week’s most important positive development. Bitcoin is no longer merely approaching parity with gold. It has crossed it.
The move does not mean gold had a poor week in absolute terms. COMEX gold futures gained approximately 1.4%, ending a two-week losing streak. Gold benefited from geopolitical uncertainty, but its upside was restricted by rising Treasury yields and growing expectations that the Federal Reserve could keep policy tighter for longer.
Oil was central to that pressure.
Higher energy prices raised the prospect of another inflation impulse, pushing real and nominal yields higher and increasing the opportunity cost of holding a non-yielding metal. Gold briefly reached a two-week high before falling almost 2% during Thursday’s session as Brent moved above $100.
Bitcoin faced the same yield and inflation headwinds. The difference was that the early-week ETF bid gave BTC more momentum over the benchmark observation period.
The rise to 101 therefore carries more weight than the move from 97 to 99 during the prior update. Bitcoin did not simply narrow the gap. It moved onto the positive side of the monetary-asset comparison.
The signal still needs confirmation. A one-point lead can disappear in a single session, particularly when both assets are trading around geopolitical headlines and shifting rate expectations.
Even so, the crossing matters. Gold had been the closest benchmark to neutral for several weeks. Bitcoin has now completed that repair.
Energy Overwhelmed Everything Else
BBN BTC/Energy fell from 85 to 77, extending the previous week’s decline and creating the largest relative deficit in the BBN family.
Crude oil ended the week roughly 13% higher despite a sharp retreat on Friday. Brent briefly traded above $102 before settling near $96.78 per barrel as markets reacted to attacks on oil tankers, escalating Middle East hostilities and threats to major transport routes. Additional supply pressure came from a temporary reduction in Kazakhstan’s exports after disruption to its primary route.
The Friday decline did not erase the weekly shock.
Energy prices had already repriced the risks attached to shipping, production and refined-product supply. Oil’s move also fed directly into inflation expectations and interest-rate pricing, giving the energy rally a second channel through which to pressure Bitcoin.
The relative mathematics were brutal. Bitcoin remained broadly resilient in dollar terms, but resilience was not enough when crude and petroleum products were posting double-digit gains.
| Benchmark Contribution | Point Change |
|---|---|
| BBN BTC/Gold | +2 |
| BBN BTC/Copper | +2 |
| BBN BTC/S&P 500 | +1 |
| BBN BTC/Metals | +1 |
| BBN BTC/Emerging Markets | +1 |
| BBN BTC/Rates | −1 |
| BBN BTC/Agriculture Basket | −1 |
| BBN BTC/Energy Basket | −8 |
| Combined Change | −3 |
The seven non-energy benchmarks produced a net gain of five points. Energy alone lost eight.
That pushed the overall family average down by 0.4%, even as the ex-energy average rose approximately 0.8%.
| Aggregate Measure | Previous | July 24 | Change |
|---|---|---|---|
| Eight-Benchmark Average | 86.0 | 85.6 | −0.4% |
| Seven-Benchmark Average Excluding Energy | 86.1 | 86.9 | +0.8% |
Energy has now lost 19 benchmark points in two updates, falling from 96 to 77. The move has transformed what was one of Bitcoin’s closest comparisons to neutral into its largest current deficit.
The benchmark is doing exactly what it was designed to do: showing that Bitcoin is not keeping pace with a physical inflation shock even when its dollar price remains relatively stable.
The BitBullNews benchmark framework explicitly treats energy as a test of Bitcoin’s performance against the real commodity cycle and a major input cost behind mining. At 77, the result is unambiguous. Energy has become Bitcoin’s dominant macro adversary.
Equity Weakness Finally Helped Bitcoin
BTC/S&P 500 increased from 78 to 79, its first improvement after the previous week’s decline.
U.S. equities were weak but not disorderly. The S&P 500 fell 0.6% for the week, while the technology-heavy Nasdaq lost 2.1%. Investors questioned whether the returns generated by large technology companies would justify the scale of their AI capital spending, particularly after earnings from Alphabet and Tesla.
The S&P 500 closed at 7,411.98 on July 24. The Dow declined 0.4%, while the Russell 2000 lost 1.1%. Energy stocks were a notable exception, rising as oil prices surged.
Bitcoin benefited from two developments.
First, the early ETF inflows produced a stronger rally in BTC than the one recorded by the broad equity market. Second, the late-week technology sell-off did not produce an equally severe decline in Bitcoin.
That relative resilience was enough to lift BTC/S&P 500 by one point.
The result should not be overstated. At 79, equities remain 21 points ahead of Bitcoin on the fixed-base framework. The benchmark has improved by only four points from its early-July level of 75.
The deeper allocation problem remains intact. Broad U.S. equities offer earnings, dividends, buybacks and exposure to multiple sectors. Bitcoin still relies more heavily on liquidity, ETF demand and price momentum.
Yet the week contained a meaningful change: technology stocks sold off, and the capital leaving them did not produce a larger fall in Bitcoin. BTC finally gained a small amount of relative ground.
Copper Gave Back Its Early Advantage
BTC/Copper posted the largest percentage improvement in the family, rising 2.4% from 83 to 85.
Copper began the week with solid support. Futures approached a seven-week high as falling exchange inventories, restricted scrap availability in China and strong import premiums pointed to tighter physical supply.
Prices jumped more than 3% during one session after a Chinese crackdown on value-added-tax fraud reduced scrap availability and increased demand for refined imports. The move did not hold. Profit-taking, weak domestic consumption and concerns about slower demand growth pushed copper back toward $6.30 per pound by July 24.
Bitcoin followed the opposite path during the first part of the week. ETF demand pushed BTC higher while copper’s supply-driven rally began to lose momentum.
That divergence lifted the benchmark by two points.
Copper remains structurally supported by electrification, grid expansion, data-center construction and constrained mine supply. The benchmark reading of 85 shows that those long-term themes continue to place Bitcoin at a substantial relative disadvantage.
Still, the direction changed. Copper was no longer gaining ground faster than BTC. Bitcoin’s improvement from 83 to 85 shows that its recovery is beginning to extend beyond defensive assets and into the industrial cycle.
The Broader Metals Basket Improved More Slowly
BTC/Metals rose from 83 to 84, a weekly gain of 1.2%.
The smaller move compared with BTC/Copper suggests that the wider industrial-metals complex held up better than copper alone during the benchmark window.
Copper experienced a sharp late-week reversal after reaching a multiweek high. Other metals benefited from varying combinations of supply constraints, energy costs, inventory conditions and Chinese policy support.
The result was not a collapse in industrial assets. It was simply a modest Bitcoin outperformance.
At 84, BTC/Metals remains 16 points below neutral. That deficit shows that the physical industrial cycle continues to carry more relative strength than Bitcoin over the full benchmark horizon.
The improvement is nevertheless useful. BTC gained against both the single-metal growth gauge and the broader metals basket during the same week. That provides a cleaner signal than an isolated move in copper alone.
Emerging Markets Produced A Mixed Comparison
BTC/Emerging Markets rose from 86 to 87, leaving it as Bitcoin’s second-strongest benchmark after gold.
Emerging-market performance was far from uniform.
Chinese equities advanced after state-backed institutions announced substantial market purchases. The CSI 300 gained 2.65%, the Shanghai Composite rose 1.33% and Hong Kong’s Hang Seng advanced 1.63%. China Reform Holdings and China Chengtong disclosed combined equity purchases of almost RMB 60 billion, while a large technology ETF recorded a single-day inflow of RMB 13.8 billion.
Other major emerging markets moved in the opposite direction.
Indian assets weakened as higher oil prices increased concerns about imported inflation, the current-account balance and pressure on the rupee. South African markets also struggled after the central bank unexpectedly left rates unchanged, weighing on the rand and pushing government bond yields higher.
Bitcoin therefore faced a divided emerging-market complex: state-supported gains in China, but energy- and currency-driven weakness elsewhere.
The one-point rise in BTC/Emerging Markets shows that Bitcoin’s ETF-backed recovery was slightly stronger than the net result across that uneven group.
At 87, the reading remains 13 points below neutral, but it has now improved for three consecutive updates—from 81 to 84, then 86 and finally 87.
That sequence is beginning to look less like a one-week rebound and more like a gradual change in relative momentum.
Rates Remained The Main Financial Headwind
BTC/Rates declined from 90 to 89.
The fall was modest, but the underlying rate move was not.
According to the U.S. Treasury’s daily yield data, the two-year yield rose from 4.18% on July 17 to 4.33% on July 24. The ten-year yield climbed from 4.55% to 4.69%.
| Treasury Maturity | July 17 | July 24 | Weekly Change |
|---|---|---|---|
| 2-Year Yield | 4.18% | 4.33% | +15 bps |
| 10-Year Yield | 4.55% | 4.69% | +14 bps |
The ten-year yield briefly moved above 4.7%, its highest level since January 2025.
Three forces drove the repricing.
Oil raised the risk of renewed headline inflation. U.S. business activity proved stronger than expected, with the flash composite purchasing managers’ index rising to an eight-month high of 53.6. Initial unemployment claims fell to 187,000, their lowest level since 1969.
Together, those signals weakened the argument for easier monetary policy and increased expectations that the Federal Reserve could raise rates again.
Bitcoin competes directly with that environment. It offers no contractual yield, while short- and long-term government securities were offering higher returns by the end of the week.
The early BTC rally showed that ETF demand can temporarily overpower the rate headwind. The decline in BTC/Rates shows that it did not overpower it for the full observation period.
At 89, the benchmark is still materially stronger than energy, equities or agriculture. It is also moving in the wrong direction.
Weekly Percentage Change Across The BBN Benchmark Family
Agriculture Quietly Outperformed Bitcoin
BTC/Agriculture slipped from 84 to 83, a decline of 1.2%.
The move was small, but it was not random.
Soybean prices rose above $12 per bushel and approached their highest levels in almost three years. Corn and wheat also received support from production constraints and logistical problems in several exporting regions. Brazilian producers increased sales as stronger prices created new hedging opportunities.
Higher oil prices added another layer of support. Energy costs affect transport, fertilizer production and biofuel economics, linking part of the agricultural complex to the same physical inflation shock that drove the energy benchmark.
The grain market was not universally strong. Wheat fell sharply during Friday trading, and individual contracts continued to respond differently to weather, export demand and crop conditions. Soybeans, however, remained firm enough to support the broader basket.
BTC/Agriculture’s decline from 84 to 83 therefore reflects modest relative underperformance rather than a broad surge across every agricultural commodity.
The benchmark remains an awkward result for the Bitcoin inflation-hedge argument. BTC crossed above gold, the traditional monetary hedge, but lost ground against the commodities tied more directly to food and everyday production costs.
The Family Is No Longer Moving As One
The benchmark family now falls into four distinct groups.
| Relative Position | Benchmarks |
|---|---|
| Bitcoin Outperforming | BBN BTC/Gold: 101 |
| Moderate Relative Deficit | BBN BTC/Rates: 89; BBN BTC/Emerging Markets: 87; BBN BTC/Copper: 85 |
| Wider Relative Deficit | BBN BTC/Metals: 84; BBN BTC/Agriculture: 83 |
| Deepest Relative Deficit | BBN BTC/S&P 500: 79; BBN BTC/Energy: 77 |
This structure is more informative than the family average.
An average of 85.6 suggests broad Bitcoin underperformance. In reality, the benchmark conditions are sharply separated.
Bitcoin has crossed parity with gold. It is steadily improving against emerging markets. It gained against equities and industrial metals this week. Its position against rates weakened, but remains well above the energy and equity readings.
Energy is now a category of its own.
The fall from 96 to 77 over two weeks is not part of a broad Bitcoin collapse. It reflects a physical commodity shock that has outpaced BTC, tightened financial conditions and raised real-world inflation risks at the same time.
That distinction should guide how the benchmark family is read. Bitcoin’s monetary and institutional profile is recovering. Its performance against physical inflation is deteriorating.
What To Watch Next
BTC/Gold must hold above 100.
The move to 101 is the first clear positive benchmark reading in the current family, but the margin is narrow. Sustained ETF inflows and stable yields could extend the breakout. Another rise in real yields or a stronger defensive move into bullion could send it back below neutral.
Energy remains the dominant risk.
A credible ceasefire, reopening of transport routes or normalization of Kazakhstan’s exports could unwind part of the oil premium quickly. That would give BTC/Energy room to recover even without a major Bitcoin rally.
Continued escalation would produce the opposite result. If Brent holds above $100 and refined products follow, the benchmark could remain under heavy pressure and the inflation shock could continue spilling into rates, equities and agriculture.
ETF demand also needs to regain consistency.
The first three sessions produced almost $500 million of inflows. The final two removed $465.2 million. A stable run of inflows would matter more than another short burst followed by an equally rapid reversal.
Rates are the next cross-asset test. The ten-year Treasury yield near 4.7% remains a serious hurdle for Bitcoin and other non-yielding assets. A lower-yield response to the coming Federal Reserve meeting would support BTC/Gold, BTC/S&P 500 and BTC/Rates simultaneously.
The July 18–24 update contains both a breakout and a warning.
Bitcoin has finally moved ahead of gold. It gained relative ground against five of eight macro comparisons and improved across equities, industrial metals and emerging markets.
But the energy shock is now large enough to dominate the entire scoreboard.
Bitcoin is winning the monetary comparison. It is still losing the inflation comparison that households, businesses and central banks feel most directly.
Energy Versus The Rest Of The BBN Benchmark Family
Disclaimer
This article is for informational purposes only and does not constitute investment advice, a recommendation or a solicitation to buy or sell any asset. Digital assets, equities, commodities and fixed-income instruments can be highly volatile and involve substantial risk. Conduct independent research and consult a licensed financial professional before making investment decisions.