


Content
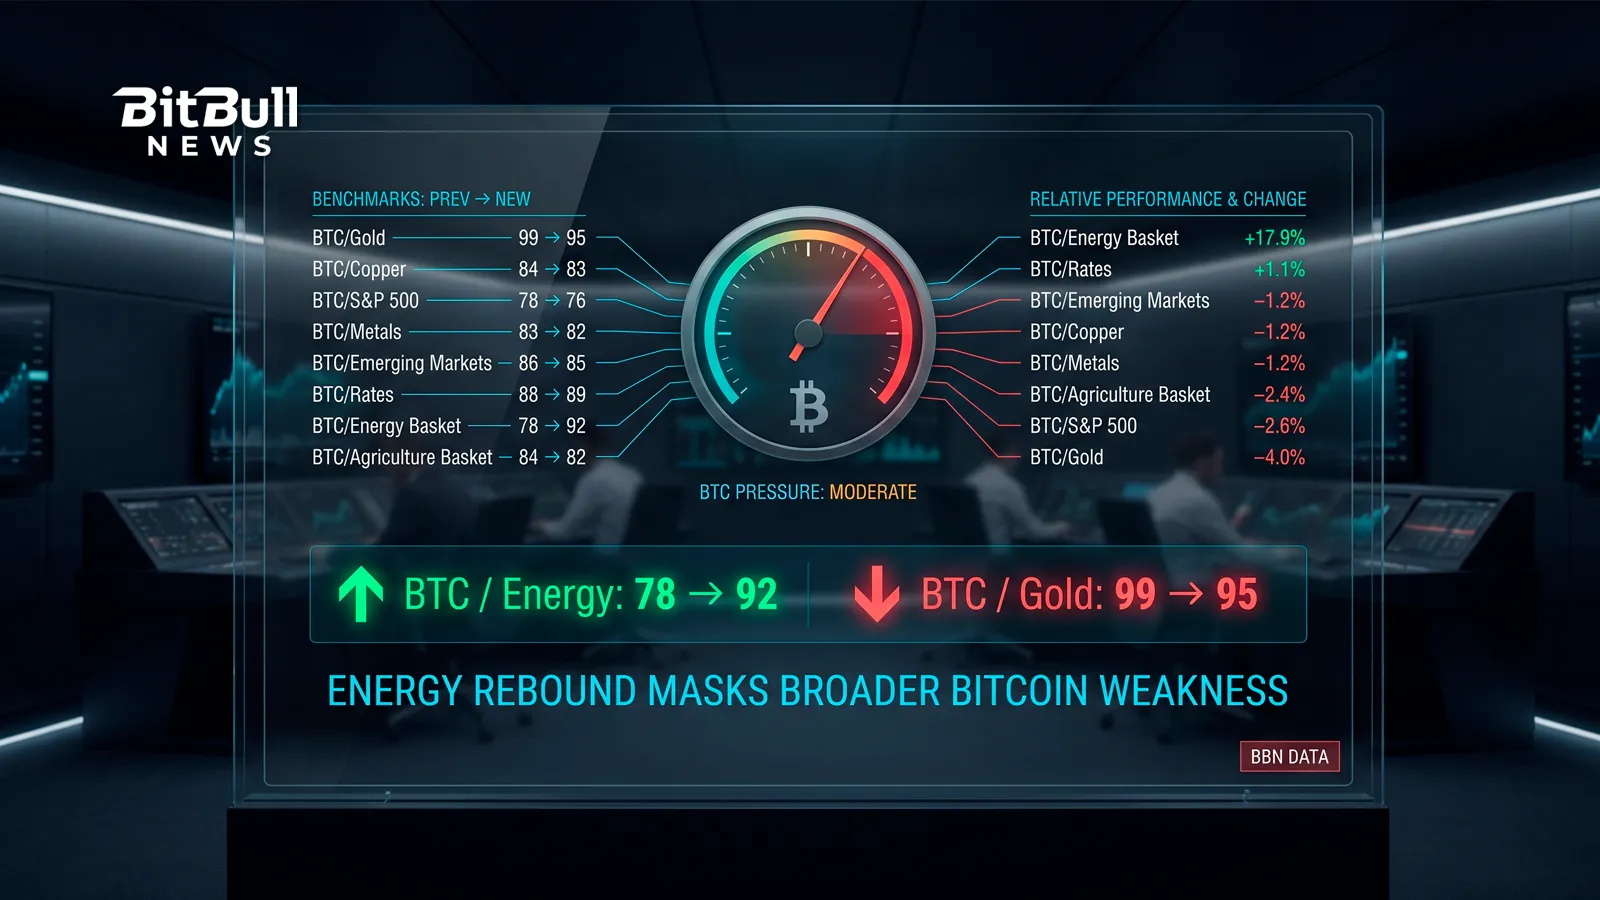
Bitcoin ended the week with a positive dollar return, five consecutive sessions of U.S. spot ETF inflows and a major recovery against energy. Yet most of the BitBullNews benchmark family moved in the opposite direction.

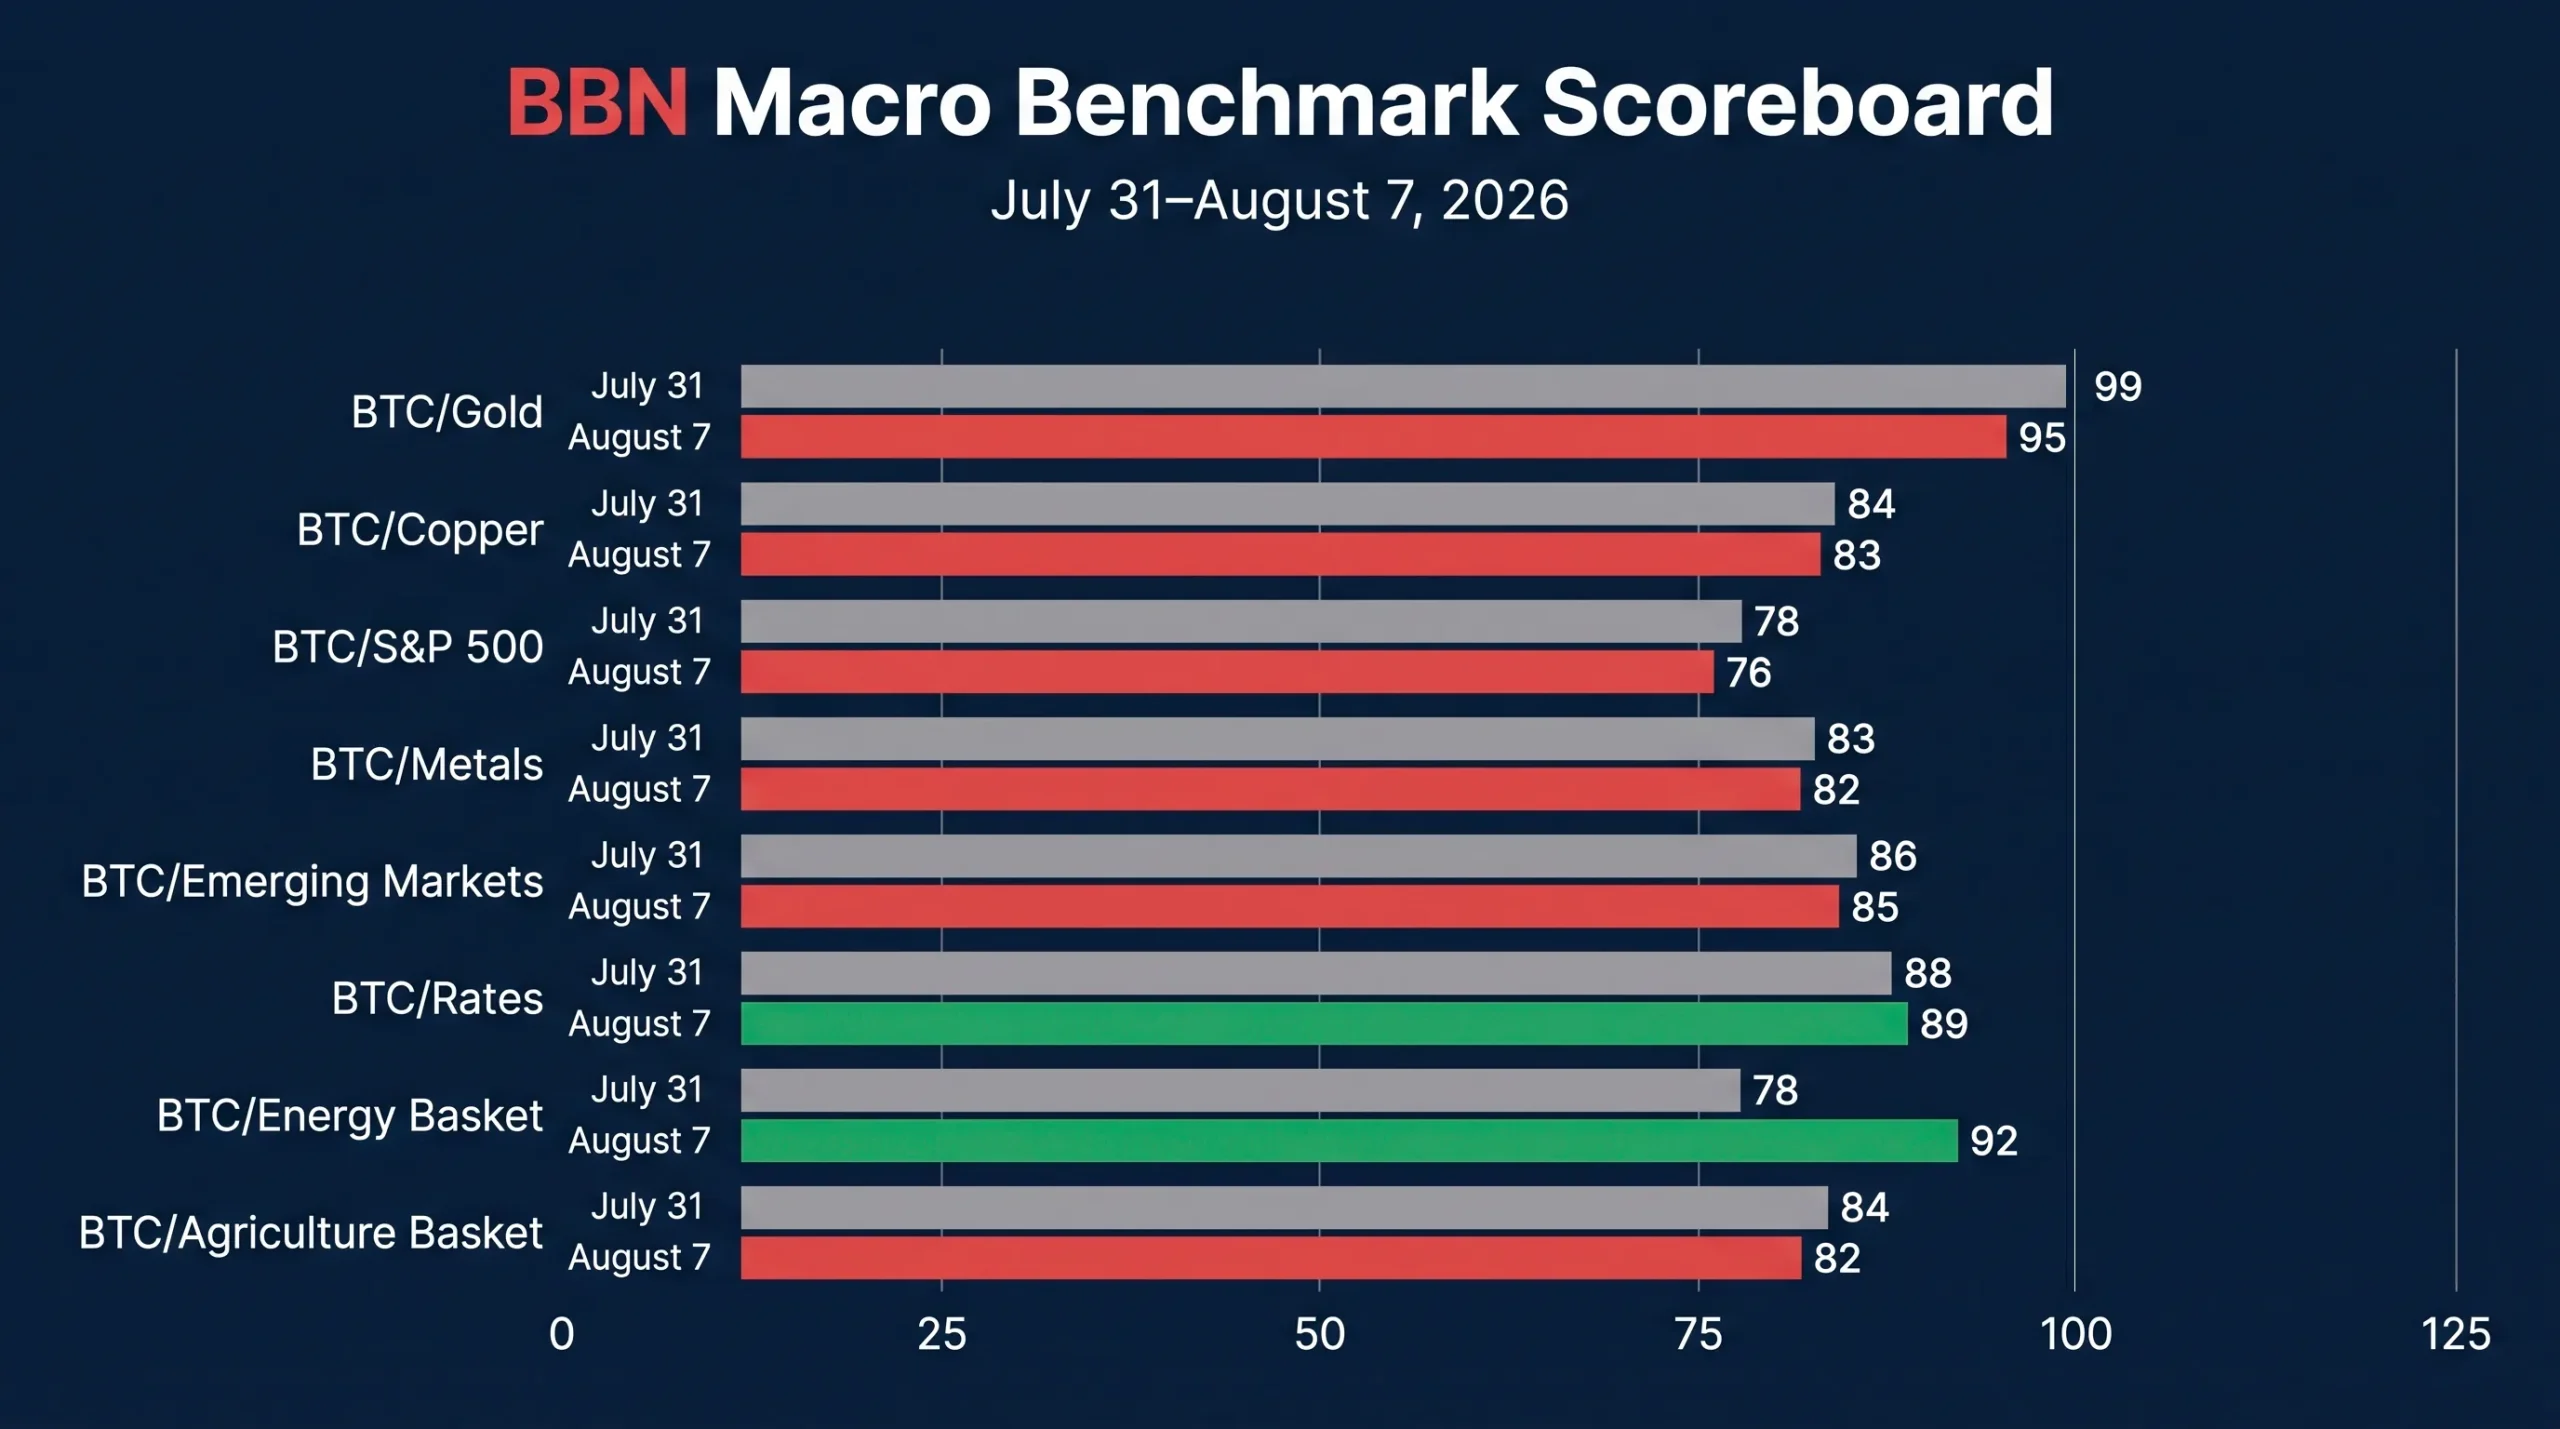
Six of the eight BBN readings declined between July 31 and August 7. Bitcoin lost relative ground against gold, copper, the S&P 500, industrial metals, emerging markets and agriculture. Only BTC/Rates and BTC/Energy improved.
The headline result looks positive at first. The simple family average increased from 85.0 to 85.5, a gain of 0.5 points or 0.6%.
Almost all of that improvement came from one place.
BTC/Energy jumped from 78 to 92, adding 14 points in a single week as crude oil and natural gas prices retreated. Excluding energy, the average of the other seven benchmarks fell from 86.0 to 84.6, a decline of 1.7%.
Energy therefore concealed a broader deterioration in Bitcoin’s cross-asset position.
Bitcoin itself gained approximately 3.1% over the week and traded near $64,800 on August 7. That was its first positive week in three, supported by softer U.S. employment data and renewed institutional demand. It still rose less than gold, the S&P 500 and copper—the three markets that explain the largest negative benchmark moves.
The market rewarded two apparently conflicting trades at the same time. Investors bought gold for safety and lower yields, while also buying technology and growth stocks on hopes that the Federal Reserve would delay further tightening. Bitcoin participated in the rally but did not lead either side of it.
The Scoreboard
The BBN benchmark family compares Bitcoin with monetary assets, industrial demand, broad equity risk, emerging markets, interest-rate conditions and commodity baskets. The reference level is 100. Above 100, Bitcoin is ahead of the comparison asset. Below 100, the comparison asset retains the stronger relative position.
| Benchmark | August 7 | July 31 | Point Change | Weekly Change | Gap From 100 |
|---|---|---|---|---|---|
| BBN BTC/Gold | 95 | 99 | −4 | −4.0% | −5 |
| BBN BTC/Copper | 83 | 84 | −1 | −1.2% | −17 |
| BBN BTC/S&P 500 | 76 | 78 | −2 | −2.6% | −24 |
| BBN BTC/Metals | 82 | 83 | −1 | −1.2% | −18 |
| BBN BTC/Emerging Markets | 85 | 86 | −1 | −1.2% | −15 |
| BBN BTC/Rates | 89 | 88 | +1 | +1.1% | −11 |
| BBN BTC/Energy Basket | 92 | 78 | +14 | +17.9% | −8 |
| BBN BTC/Agriculture Basket | 82 | 84 | −2 | −2.4% | −18 |
| BBN Family Average | 85.5 | 85.0 | +0.5 | +0.6% | −14.5 |
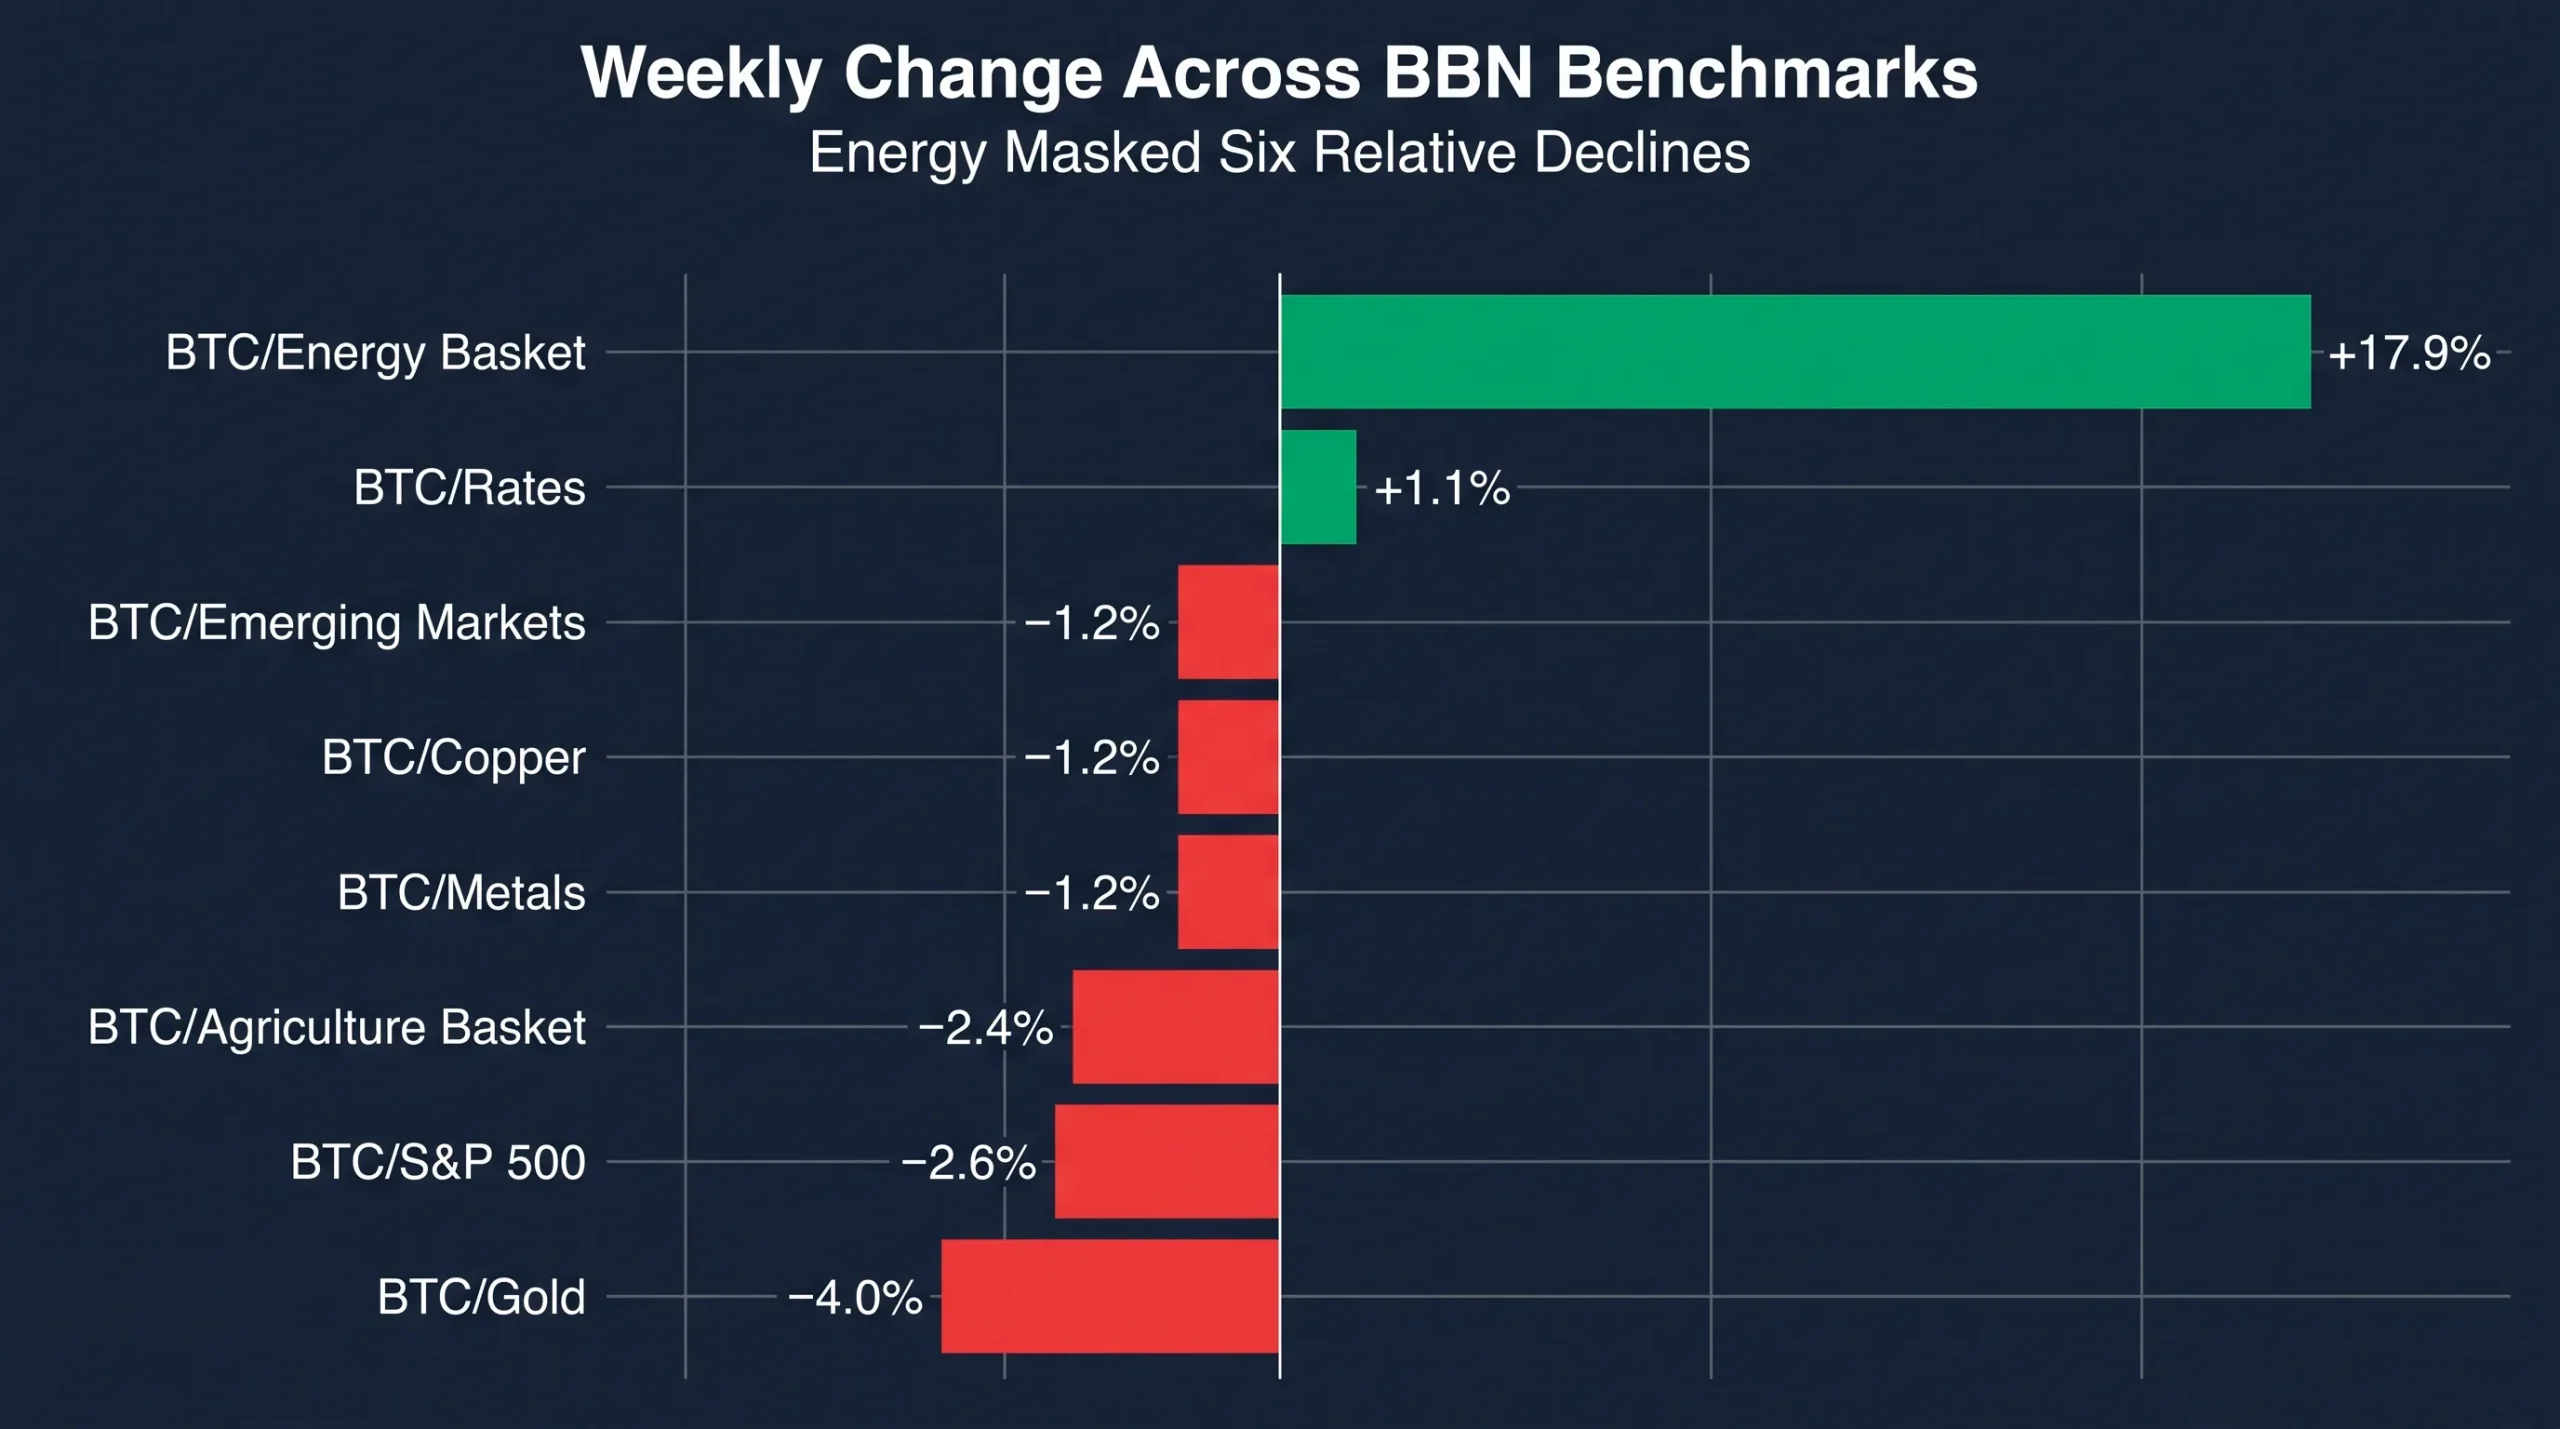
The percentage changes are calculated against the July 31 reading for each benchmark. That is why a two-point decline produces a 4.0% loss for BTC/Gold but a 2.6% loss for BTC/S&P 500.
The result extends the pattern identified in the previous BBN review. Bitcoin’s relative position outside energy remained weak, but the scale of the energy reversal was large enough to push the family average higher.
Bitcoin Rose, But Relative Leadership Stayed Weak
Bitcoin’s weekly performance was constructive in isolation.
BTC rose about 3.1% and traded near $64,762 on August 7. It was the asset’s first weekly advance in three weeks, although the price remained below its July 21 close above $66,400. The recovery stabilised the market but did not establish a new trend.
Institutional demand was considerably stronger than during the final days of July.
According to Farside Investors’ ETF flow data, U.S. spot Bitcoin ETFs attracted $865.3 million over the five trading sessions from August 3 through August 7.
| Date | Net U.S. Spot Bitcoin ETF Flow |
|---|---|
| August 3 | +$170.1 million |
| August 4 | +$211.5 million |
| August 5 | +$244.4 million |
| August 6 | +$137.6 million |
| August 7 | +$101.7 million |
| Weekly Total | +$865.3 million |
The sequence was positive every day, but momentum weakened after Wednesday. Daily inflows declined from $244.4 million on August 5 to $137.6 million on August 6 and $101.7 million on August 7.
That demand was enough to support Bitcoin through a volatile macro week. It was not enough to push BTC above the assets receiving stronger defensive, earnings-driven or supply-driven bids.
The distinction is central to the benchmark results. Bitcoin did not have a bad week in dollars. It had a weak week relative to several markets that rallied even harder.
The Jobs Report Created A Barbell Rally
The week’s main macro event arrived on Friday.
The U.S. Bureau of Labor Statistics reported that nonfarm payroll employment fell by 23,000 in July, while the unemployment rate stood at 4.1%. May and June payroll growth was revised lower by a combined 103,000 jobs. Average hourly earnings increased only two cents in July and were 3.2% higher than a year earlier.
The report weakened the case for another near-term Federal Reserve rate increase.
Treasury yields fell immediately as investors priced a softer labour market and a less aggressive policy path. The two-year yield declined nine basis points between July 31 and August 7, while the ten-year yield fell ten basis points.
| Treasury Maturity | July 31 | August 7 | Weekly Change |
|---|---|---|---|
| 2-Year Yield | 4.28% | 4.19% | −9 bps |
| 10-Year Yield | 4.75% | 4.65% | −10 bps |
The figures come from the U.S. Treasury’s daily yield-curve data.
The reaction created a barbell market.
Gold rallied because lower yields and a weaker dollar improved the appeal of a defensive, non-yielding asset. Technology and growth stocks rallied because lower yields reduced the discount rate applied to future earnings. Bitcoin benefited from both forces, but less strongly than either gold or the leading equity sectors.
At the same time, diplomatic optimism around the Strait of Hormuz sent oil prices lower, producing the opposite effect in the energy benchmark.
One employment report therefore helped explain all three of the week’s most important BBN moves: BTC/Rates rose, while BTC/Gold and BTC/S&P 500 fell.
Rates Improved, But The Yield Advantage Remained
BTC/Rates increased from 88 to 89, a weekly gain of 1.1%.
The move is directionally consistent with the Treasury rally. Falling yields reduced the opportunity cost of holding Bitcoin, which produces no contractual income.
A ten-year yield of 4.65%, however, still offers investors a substantial nominal return without Bitcoin’s volatility. The rate environment became less restrictive during the week, but it did not become easy.
That helps explain why BTC/Rates gained only one point despite a meaningful fall in Treasury yields.
Bitcoin also had to share the benefit of easier financial conditions with equities, gold and credit markets. The LPL weekly market review showed a broad rally in bonds and risk assets as oil prices declined and the weak jobs report reduced immediate rate-hike concerns.
At 89, BTC/Rates is now Bitcoin’s third-strongest benchmark after gold and energy. It nevertheless remains 11 points below the reference level.
The rate headwind eased. It did not disappear.
Gold Won The Monetary Trade
BTC/Gold recorded the largest negative percentage change in the family, falling 4.0% from 99 to 95.
The reason is straightforward: both assets rallied, but gold rallied much faster.
Bitcoin gained approximately 3.1% over the week. COMEX gold rose 7.2% to $4,340.70 per ounce, its strongest weekly performance since January 2026. The rally accelerated after the payroll report lowered expectations for another rate increase and weakened the dollar.
Gold also retained support from physical demand, central-bank buying and increased positions in gold-backed assets among Chinese institutional investors. These flows gave bullion a deeper defensive bid than Bitcoin received from ETFs alone.
The decline to 95 completes a sharp reversal in Bitcoin’s monetary benchmark.
BTC/Gold briefly crossed above 100 in July, reaching 101. It then fell to 99 and has now dropped another four points. In two updates, Bitcoin moved from one point ahead of gold to five points behind it.
The change does not mean Bitcoin lost its store-of-value narrative. It shows that when weak economic data triggered an immediate demand for monetary protection, traditional gold captured more of that demand.
Bitcoin’s ETF inflows were strong. Gold’s combination of lower yields, defensive positioning and established institutional demand was stronger.
Energy Reversed The Entire Scoreboard
BTC/Energy rose from 78 to 92, a weekly increase of 14 points or 17.9%.
No other benchmark came close to that move.
The BBN Energy Basket methodology assigns 55% of the basket to crude oil, 20% to natural gas and 25% to refined products.
| Energy Component | Basket Weight |
|---|---|
| WTI Crude Oil | 30% |
| Brent Crude Oil | 25% |
| Henry Hub Natural Gas | 20% |
| RBOB Gasoline | 15% |
| ULSD | 10% |
All three major parts of that structure faced downward pressure.
WTI crude fell 7.7% over the week, while Brent declined 5%. Prices were pressured by negotiations aimed at restoring more predictable shipping through the Strait of Hormuz, although uncertainty around a final agreement remained.
U.S. natural gas futures lost another 3.1%, extending their decline to seven consecutive weeks. Strong production, reduced LNG feedgas demand, cooler weather forecasts and additional pipeline capacity from the Permian Basin kept supply conditions loose.
The U.S. Energy Information Administration’s weekly report added another bearish signal. Commercial crude inventories unexpectedly increased by 2.5 million barrels to 407 million barrels in the week ending July 31.
The result was almost ideal for the BTC/Energy ratio: Bitcoin rose while the underlying energy complex declined.
That combination transformed energy from one of Bitcoin’s two weakest benchmarks into its second-strongest reading. At 92, BTC/Energy now sits only eight points below 100.
The improvement should still be viewed as a recovery rather than a completed breakout.
Energy prices remain sensitive to military developments, shipping access and political negotiations. A failure of the Hormuz talks could restore the geopolitical premium quickly. Refined-product inventories also remain tight, particularly for distillates, limiting how far the full energy basket can fall even when crude weakens.
BTC/Energy repaired most of its recent damage in one week. The move remains highly dependent on an unstable geopolitical variable.
Equities Extended Bitcoin’s Deepest Structural Gap
BTC/S&P 500 fell from 78 to 76, a decline of 2.6%.
It is now the weakest reading in the BBN family and sits 24 points below the reference level.
The S&P 500 gained approximately 3.5% over the week and reached a record high. The Nasdaq Composite rose just over 5%, while the S&P 500 information technology sector gained 7%.
Strong corporate earnings supported the first part of the rally. The weak payroll report then added a second catalyst by reducing concerns about another immediate increase in interest rates.
Bitcoin received the same lower-yield tailwind, but U.S. equities offered something more tangible: earnings growth, cash flows and direct exposure to artificial-intelligence infrastructure.
Technology shares also benefited from cleaner positioning after earlier volatility in AI and momentum trades. Investors were willing to rebuild risk exposure, but they preferred companies reporting revenue and profit growth to a purely monetary or liquidity-driven Bitcoin trade.
The drop to 76 reinforces the most persistent conclusion in the BBN series.
Bitcoin can rise alongside equities. It is still struggling to outperform them.
The benchmark has now moved further away from neutral despite nearly $900 million of weekly ETF inflows. That suggests institutional Bitcoin demand is functioning as price support, but not yet as a source of cross-asset leadership.
Copper And Metals Kept The Scarcity Premium
BTC/Copper fell from 84 to 83. BTC/Metals declined from 83 to 82.
These were relatively small benchmark moves, but the underlying commodity performance was substantial.
Copper broke to record highs during the week. U.S. futures reached approximately $6.90 per pound intraday, while London Metal Exchange copper moved above $14,000 per tonne. According to the International Copper Association Australia’s weekly review, copper gained roughly 8.6% over the preceding week.
The rally combined several drivers.
A new concentrate export restriction in the Democratic Republic of Congo raised supply concerns. U.S. tariff expectations encouraged stockpiling. Exchange inventories outside the United States remained constrained. Longer term, power-grid expansion, electrification and AI data centres continued to support demand.
Copper therefore benefited from both a physical scarcity trade and the same AI investment theme lifting technology equities.
Bitcoin could not match that combination.
The broader metals benchmark moved less dramatically because it is diversified across six commodities. Under the BBN Industrial Metals Basket methodology, copper carries 40% of the basket, aluminium 25%, nickel 15%, zinc 10%, and lead and tin 5% each.
| Industrial Metal | Basket Weight |
|---|---|
| Copper | 40% |
| Aluminium | 25% |
| Nickel | 15% |
| Zinc | 10% |
| Lead | 5% |
| Tin | 5% |
The metals market was not uniformly strong. Sucden Financial’s August 7 review noted that zinc and aluminium held firm, copper retreated from its highs and nickel remained under pressure.
That mixed composition explains why BTC/Metals fell only one point while copper itself produced a much more powerful rally.
The wider signal remains unfavourable for Bitcoin. BTC/Copper is 17 points below neutral, and BTC/Metals is 18 points below. Physical supply constraints and infrastructure demand continue to carry more relative momentum than Bitcoin’s digital-scarcity narrative.
Emerging Markets Benefited From Lower Oil And A Softer Dollar
BTC/Emerging Markets declined from 86 to 85, a weekly loss of 1.2%.
The BBN Emerging Markets methodology uses the MSCI Emerging Markets Net Total Return Index in U.S. dollars. The comparison therefore includes equity performance, reinvested distributions and the effect of currency movements against the dollar.
Several forces helped emerging markets during the week.
Lower U.S. Treasury yields reduced external financing pressure. The dollar weakened after the employment report. Falling oil prices improved the outlook for energy-importing countries, while Asian technology companies participated in the global AI and semiconductor rally.
Taiwan led regional gains as strong earnings supported hardware and chip-related companies. Mainland Chinese markets received support from optical technology and lower-cost AI themes. Emerging-market performance remained uneven, but the overall environment improved.
The one-point decline in the BBN reading shows that Bitcoin’s ETF-driven recovery was not enough to pull ahead of the aligned emerging-market total-return benchmark.
At 85, BTC/Emerging Markets remains one of the stronger readings in the family. It is also 15 points below neutral, showing that Bitcoin has not yet established a durable advantage over a risk-sensitive group that benefits directly from a weaker dollar and easier U.S. financial conditions.
Agriculture Preserved Its Inflation Premium
BTC/Agriculture fell from 84 to 82, a decline of 2.4%.
That was the second-largest negative percentage move after gold.
The BBN Agriculture Basket methodology gives 70% of its weight to wheat, corn and soybeans. Sugar, cotton, coffee and cocoa make up the remaining 30%.
| Agriculture Component | Basket Weight |
|---|---|
| Wheat | 25% |
| Corn | 25% |
| Soybeans | 20% |
| Sugar | 10% |
| Cotton | 10% |
| Coffee | 5% |
| Cocoa | 5% |
The weekly agricultural tape was mixed. Improving rain forecasts pressured corn and soybeans, while wheat received support from Black Sea export concerns and limited Russian shipments. Soft commodities remained exposed to heat, drought and the strengthening El Niño pattern.
The broader inflation backdrop remained firm.
The United Nations Food and Agriculture Organization reported that its global food price index increased 0.6% in July. Cereal prices rose 3.4%, including a 5.8% rise in wheat and a 3.6% increase in maize. Vegetable oils gained 2%, while sugar prices climbed 5.6%.
Recent heatwaves, Black Sea disruptions and weather risk in major producing regions continued to support the physical commodity complex. A strengthening El Niño also raised concerns around coffee, cocoa, sugar and palm-oil production.
The agriculture basket did not need every contract to rise at the same time. Its diversification allowed strength in wheat and soft commodities to offset weakness elsewhere.
The decline to 82 keeps agriculture tied with industrial metals as Bitcoin’s second-largest relative deficit after the S&P 500.
Bitcoin is much closer to gold than it is to the commodities most directly connected to food and household inflation.
One Positive Average, Six Negative Readings
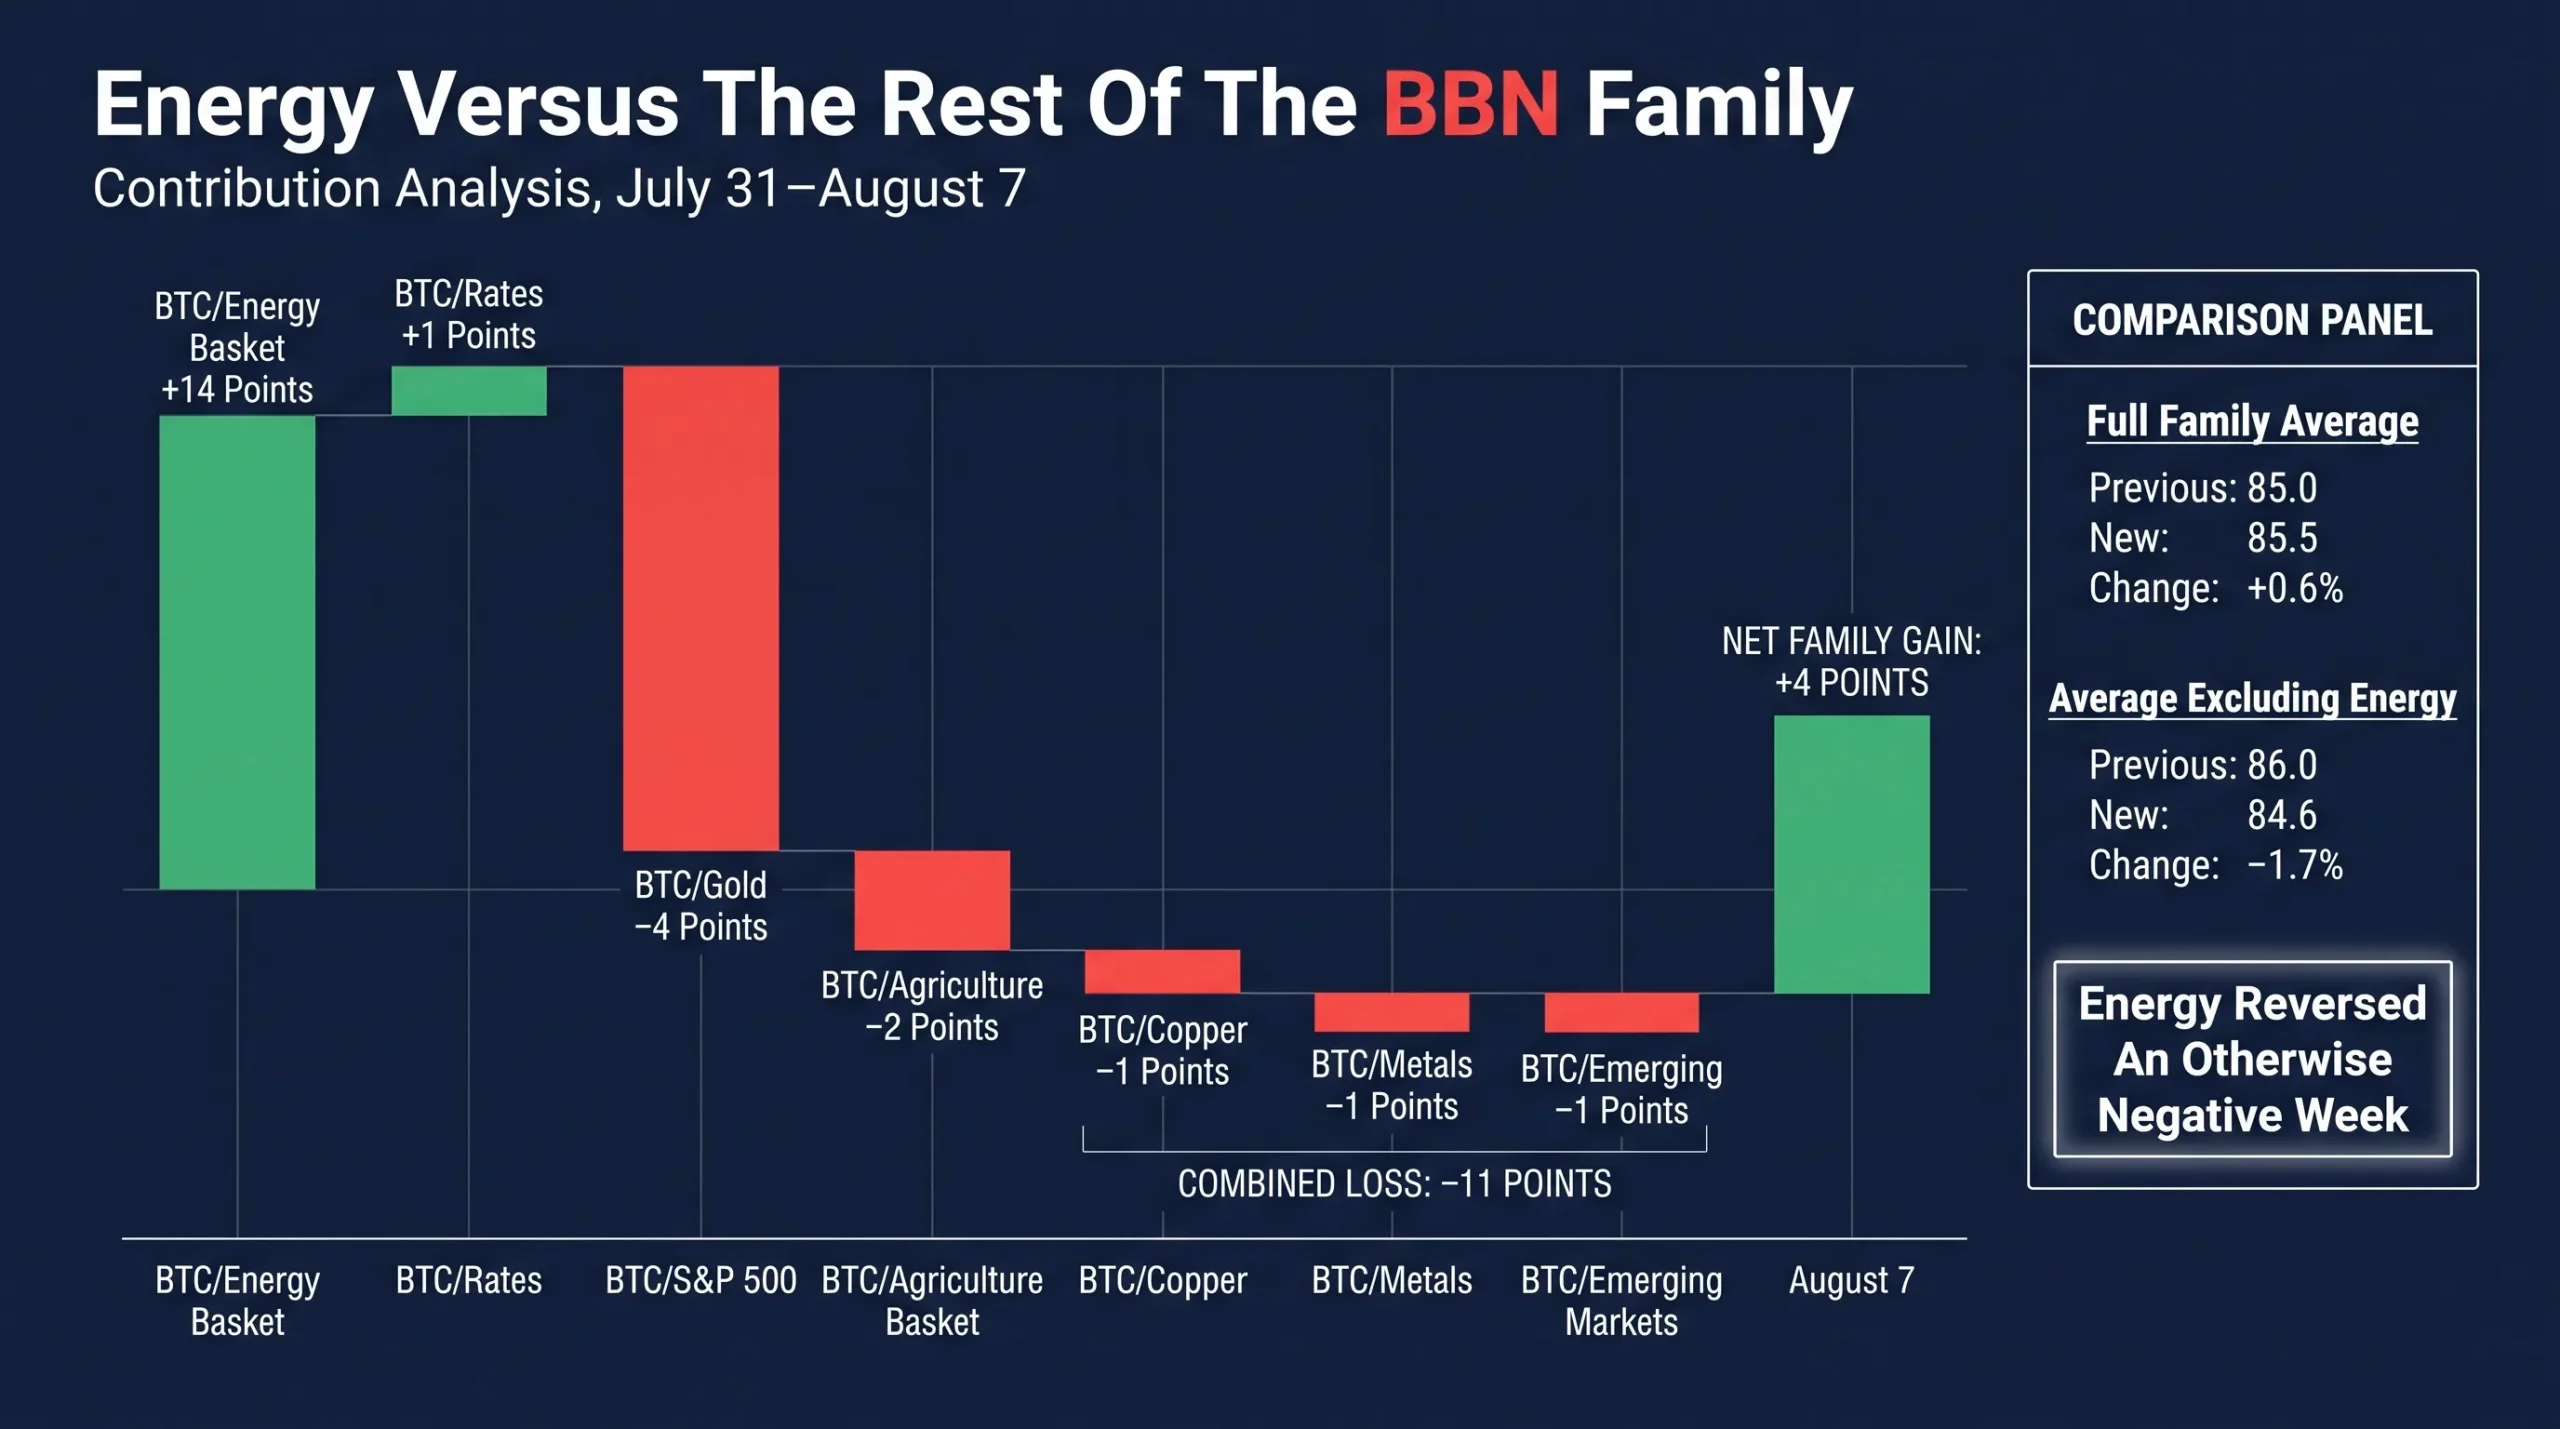
The family average rose, but the contribution breakdown shows how narrow the improvement was.
| Benchmark Contribution | Point Change |
|---|---|
| BBN BTC/Energy Basket | +14 |
| BBN BTC/Rates | +1 |
| BBN BTC/Gold | −4 |
| BBN BTC/S&P 500 | −2 |
| BBN BTC/Agriculture Basket | −2 |
| BBN BTC/Copper | −1 |
| BBN BTC/Metals | −1 |
| BBN BTC/Emerging Markets | −1 |
| Combined Family Change | +4 |
The six declining benchmarks lost a combined 11 points. Rates returned one point, while energy added 14. The net result was a four-point increase across the eight readings, equal to a 0.5-point rise in the simple family average.
The comparison excluding energy is more revealing.
| Aggregate Measure | July 31 | August 7 | Change |
|---|---|---|---|
| Full Eight-Benchmark Average | 85.0 | 85.5 | +0.6% |
| Seven-Benchmark Average Excluding Energy | 86.0 | 84.6 | −1.7% |
The headline average is mathematically correct. It is analytically incomplete.
Without energy, Bitcoin’s relative position deteriorated across nearly the entire macro board. ETF inflows and lower yields improved BTC’s dollar performance, but gold, equities, copper, emerging markets and agricultural assets captured more of the week’s capital or inflation premium.
The Benchmark Family Has Split Into Four Groups
The new readings divide the BBN family into four distinct tiers.
| Relative Position | Benchmarks |
|---|---|
| Closest To Neutral | BTC/Gold: 95; BTC/Energy: 92 |
| Moderate Relative Deficit | BTC/Rates: 89; BTC/Emerging Markets: 85 |
| Wider Relative Deficit | BTC/Copper: 83; BTC/Metals: 82; BTC/Agriculture: 82 |
| Deepest Relative Deficit | BTC/S&P 500: 76 |
Gold remains Bitcoin’s closest comparison to parity despite the four-point weekly decline.
Energy has moved into second place after spending the previous reporting period tied for the weakest position. That turnaround shows how quickly a commodity-driven benchmark can change when geopolitical pricing reverses.
Rates improved but remain restrictive. Emerging markets retained their lead as weaker U.S. data supported the global risk complex.
Copper, metals and agriculture continue to expose Bitcoin’s difficulty against physical scarcity and consumption-linked inflation.
The S&P 500 remains the deepest and most persistent gap. At 76, Bitcoin is 24 points below the broad U.S. equity benchmark—the largest deficit anywhere in the family.
What The Benchmarks Say About Bitcoin Now
The week delivered a clear warning about using Bitcoin’s dollar price as the only measure of market strength.
Bitcoin rose. ETF demand was positive every trading day. Treasury yields declined. Those conditions would usually support the argument that the market was turning more favourable for BTC.
The benchmark family shows that other assets used those conditions more effectively.
Gold attracted the stronger monetary bid. Equities captured the stronger growth and liquidity bid. Copper retained the stronger infrastructure and scarcity bid. Emerging markets benefited from the weaker dollar and lower oil prices. Agriculture continued to reflect weather and supply risk.
Bitcoin’s strongest victory came against the asset class that fell most sharply.
That does not make the BTC/Energy improvement meaningless. The energy basket measures a real inflation input and a major operating cost for Bitcoin mining. Moving from 78 to 92 materially repairs Bitcoin’s position against that part of the economy.
It does mean the family-wide improvement lacks breadth.
A sustainable change in Bitcoin’s macro regime would require several benchmarks to rise together. This week produced one exceptional move, one modest improvement and six declines.
What To Watch Next
ETF demand is the first test.
Five consecutive positive sessions and $865.3 million of inflows provided a solid foundation, but the daily totals weakened after Wednesday. Bitcoin needs sustained demand rather than a short inflow burst to compete with equity earnings, gold’s defensive appeal and copper’s physical supply story.
BTC/Gold will show whether the weak employment report created a temporary bullion surge or a longer rotation toward traditional hard money. At 95, Bitcoin requires a meaningful relative recovery to regain the 100 level.
Energy remains the most volatile benchmark.
Further progress on Strait of Hormuz shipping arrangements could keep crude under pressure and allow BTC/Energy to approach neutral. A breakdown in negotiations or another military escalation could reverse much of the 14-point gain.
Rates have become less hostile, but the ten-year Treasury yield remains near 4.65%. A deeper bond rally would support Bitcoin, although the same move could continue benefiting gold and high-duration technology stocks.
Copper will test whether Bitcoin can compete with the physical side of the AI trade. Record prices, constrained inventories and infrastructure demand have made the metal one of the strongest macro assets in the current market.
The S&P 500 remains the hardest confirmation point. Bitcoin will not demonstrate broad risk-asset leadership while BTC/S&P 500 remains in the mid-70s.
The July 31–August 7 update contains a positive headline and a negative underlying message.
Bitcoin recovered against energy and gained modestly against rates. Everywhere else, the macro competition became harder.
The family average rose. Bitcoin’s relative breadth did not.
Disclaimer
This article is for informational purposes only and does not constitute investment advice, a recommendation or a solicitation to buy or sell any asset. Digital assets, equities, commodities and fixed-income instruments can be highly volatile and involve substantial risk. Conduct independent research and consult a licensed financial professional before making investment decisions.