


Content
Stablecoin liquidity stopped shrinking during the July 06 – July 13, 2026 reporting window, but the recovery was narrow.
DefiLlama’s broad stablecoin overview showed total market capitalization at $312.31 billion, up only $173 million, or 0.06%, over seven days. Supply remained 0.87% lower over 30 days, so this was stabilization rather than a return to broad expansion.
The weekly headline hides a large internal rotation. USDC added roughly $485 million, while BlackRock’s BUIDL increased by an estimated $776 million. Those gains were largely offset by contractions in Ethena’s USDe, Sky Dollar’s USDS, USD1, Circle USYC, and several smaller instruments. USDT remained almost unchanged at approximately $184.15 billion.
Chain-level data looked weaker. DefiLlama’s stablecoin-by-chain dashboard showed $310.33 billion in tracked supply, down $1.47 billion, or 0.47%, over seven days. Ethereum lost about 1.74%, while Tron gained 1.21%. Avalanche jumped 50%, but the move was heavily linked to BUIDL rather than a broad surge in payment stablecoins.
The stronger signal came from transaction activity. Visa Onchain Analytics data reported by FinanceFeeds showed $1.79 trillion in adjusted stablecoin volume during June, up 63% from May and 125% year over year. USDC generated approximately $1.21 trillion, or 67% of the total, despite holding less than one-quarter of the market’s outstanding supply.
That divergence defines the market this week:
- Supply growth was almost flat.
- USDC gained circulation and transaction share.
- Yield-bearing tokenized cash expanded faster than payment stablecoins.
- Ethereum lost balances while Tron and several smaller chains gained.
- Usage reached a record even without broad supply growth.
The market has enough stablecoin liquidity. What it does not yet have is broad, issuer-neutral expansion.
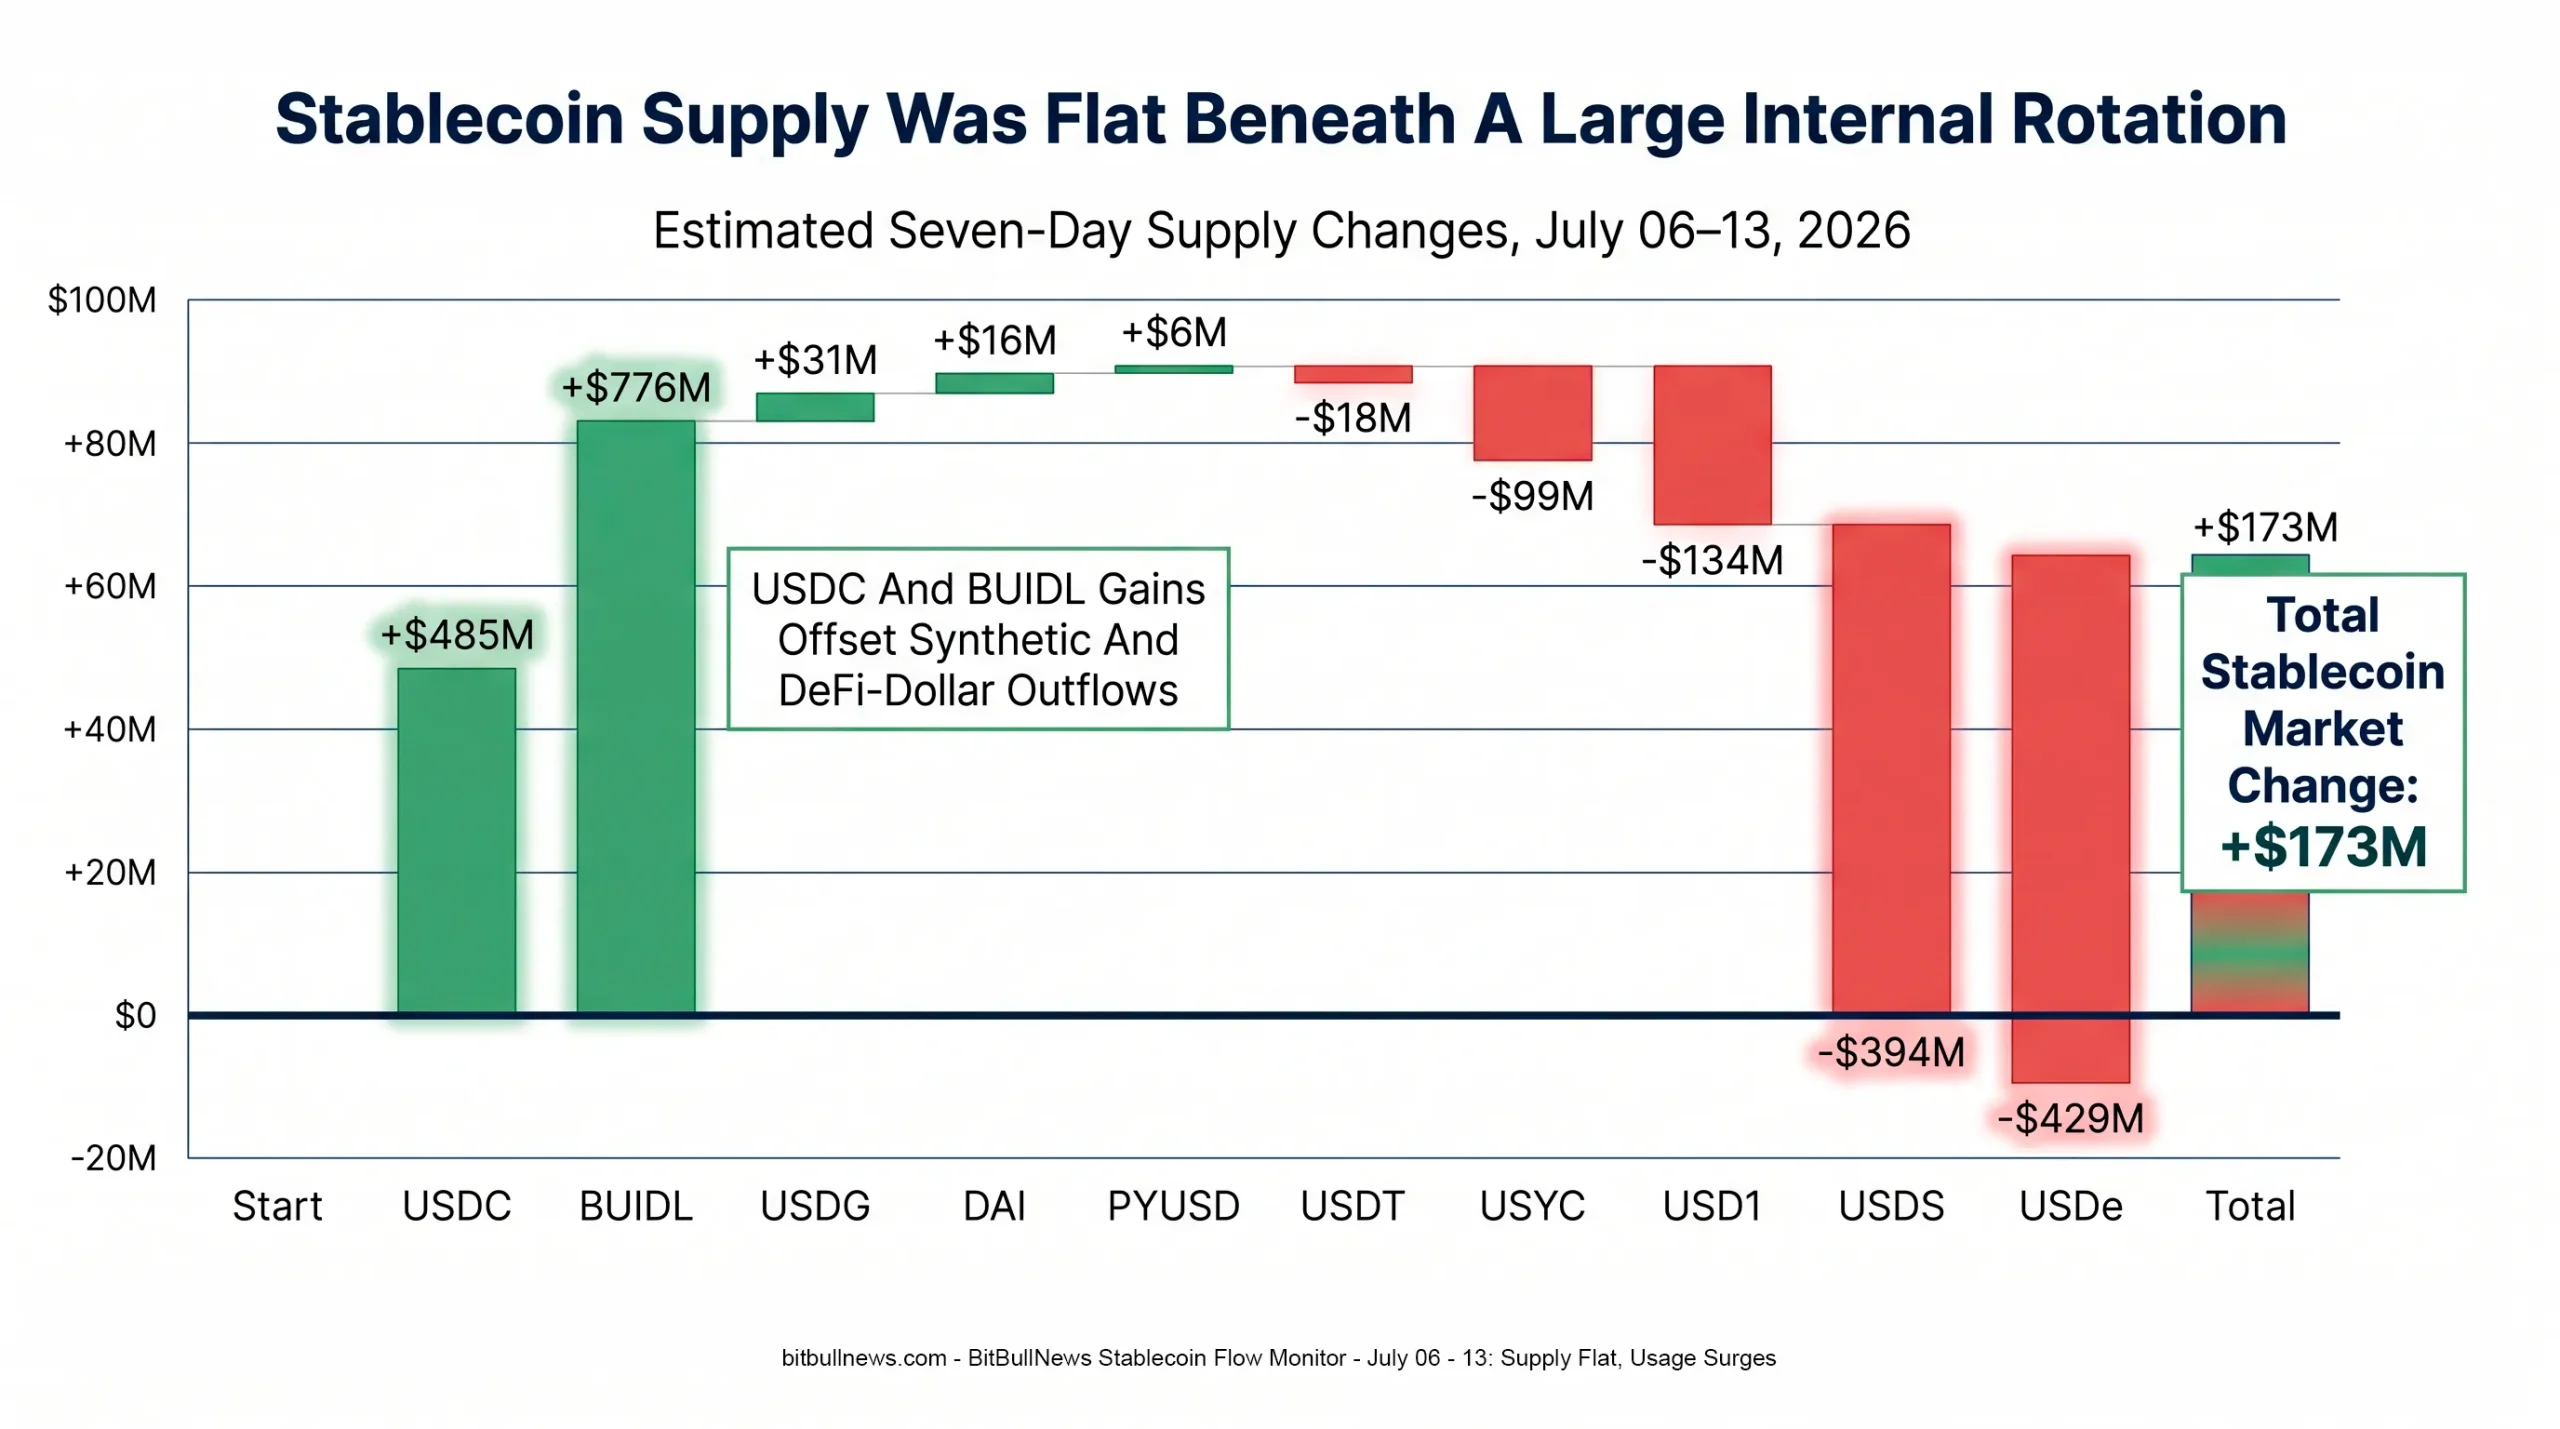
Chart: Waterfall chart showing the estimated seven-day supply changes of USDC, BUIDL, USDG, DAI, PYUSD, USDT, USYC, USD1, USDS, and USDe. End with total DefiLlama stablecoin market growth of approximately $173M. Highlight that gains were concentrated in USDC and BUIDL.
Market Structure Snapshot
The two largest stablecoins still control the market. USDT stood at $184.15 billion and USDC at $73.52 billion, giving them a combined share of approximately 82.5% of DefiLlama’s tracked total. USDT dominance alone remained close to 59%.
| Metric | Latest Reading | Seven-Day Change | Market Read |
|---|---|---|---|
| Total Stablecoin Market Cap | $312.31B | +$173M / +0.06% | Broad Supply Stabilized |
| Thirty-Day Market Change | — | -0.87% | Longer Trend Remains Negative |
| USDT Market Cap | $184.15B | -0.01% | Supply Essentially Flat |
| USDC Market Cap | $73.52B | +0.66% | Main Payment-Stablecoin Gainer |
| USDT Dominance | 58.97% | Broadly Stable | Tether Remains The Supply Anchor |
| USDT And USDC Combined Share | ~82.5% | — | Issuer Concentration Remains Extreme |
| Chain-Level Stablecoin Supply | $310.33B | -$1.47B / -0.47% | Network Balances Still Contracted |
The difference between DefiLlama’s $312.31 billion overview total and its $310.33 billion chain-level total reflects differences in dataset scope, classification, and update timing. The figures should not be treated as interchangeable. The overview includes a broader set of instruments, including products that behave more like tokenized cash or yield-bearing funds than conventional payment stablecoins.
Stablecoin Beat uses another methodology and reported a narrower market total of $302.1 billion as of July 12, up 0.30% over seven days. It separately tracks yield-bearing dollar instruments rather than including them in its core stablecoin total. Despite the different absolute numbers, both datasets point to the same conclusion: market-wide supply was flat to slightly positive.
Weekly Supply Rotation By Asset
The week was defined by sharp dispersion beneath an almost unchanged headline total.
DefiLlama showed USDC rising 0.66% to $73.52 billion, equivalent to an approximate weekly increase of $485 million. BUIDL rose 21.03% to $3.69 billion, an estimated increase of roughly $776 million. Combined, those two instruments added more value than the entire market’s net weekly increase.
| Asset | Market Cap | Seven-Day Change | Estimated Dollar Change | Interpretation |
|---|---|---|---|---|
| USDT | $184.15B | -0.01% | -$18M | Global Supply Base Stayed Flat |
| USDC | $73.52B | +0.66% | +$485M | Regulated-Dollar Demand Improved |
| USDS | $7.59B | -5.20% | -$394M | DeFi-Native Supply Contracted |
| DAI | $4.86B | +0.33% | +$16M | Small Positive Move |
| USD1 | $4.47B | -3.00% | -$134M | Recent Growth Lost Momentum |
| USDe | $3.95B | -10.85% | -$429M | Largest Major Percentage Contraction |
| BUIDL | $3.69B | +21.03% | +$776M | Tokenized Cash Drove Headline Growth |
| USYC | $3.00B | -3.31% | -$99M | Tokenized Fund Supply Declined |
| USDG | $2.91B | +1.07% | +$31M | Gradual Expansion Continued |
| PYUSD | $2.85B | +0.22% | +$6M | Essentially Stable |
Estimated dollar changes are calculated from current market capitalization and reported seven-day percentage movements.
The most important shift was not USDT versus USDC. It was payment stablecoins versus yield-bearing digital cash.
BUIDL’s growth helped lift the broader market even while USDe and USDS contracted. This means a rising aggregate stablecoin number no longer automatically represents more exchange collateral or payment liquidity. Part of the growth now comes from tokenized Treasury and money-market exposure.
That distinction matters for traders. One dollar held in USDT or USDC is generally designed for immediate settlement, trading, payments, or collateral use. One dollar represented through a tokenized fund may carry eligibility restrictions, different redemption mechanics, and less universal exchange acceptance.
The assets can sit beside each other on a dashboard without performing the same economic function.
USDC Gains While USDT Holds The Supply Lead
USDT remained the largest stablecoin by a wide margin. Its $184.15 billion market capitalization was roughly 2.5 times USDC’s $73.52 billion supply, and Tether’s own website showed USDT near $184.3 billion during the reporting period.
USDC, however, had the stronger week.
Its circulating value increased by 0.66%, while USDT was virtually unchanged. USDC also received a major institutional infrastructure boost on July 10 when Circle received final OCC approval to establish Circle National Trust, a federally regulated national trust bank. Circle said the entity will initially offer fiduciary digital-asset custody to Circle and its affiliates, with USDC reserve management planned as a future capability.
The approval does not turn Circle into a conventional commercial bank. Circle National Trust will not operate as a standard deposit-taking or lending institution. Its importance is narrower and more relevant to stablecoin market structure: custody and potentially reserve management can move under direct federal supervision.
Circle had already strengthened its banking distribution before the charter approval. Standard Chartered became the first global systemically important bank to offer eligible institutional clients integrated USDC minting and redemption without requiring a direct Circle account. BNY also added USDC custody, transfer, mint, and burn functionality to its digital-asset platform.
These developments do not guarantee faster USDC supply growth. They reduce operational friction for institutions.
That is a meaningful difference. Institutional adoption depends less on whether a stablecoin technically works and more on whether treasurers, banks, funds, and regulated intermediaries can access it through familiar compliance, custody, and cash-management systems.
Chain Flows Show A Market In Rotation
Stablecoin balances remained heavily concentrated on Ethereum and Tron.
Ethereum held $150.72 billion, while Tron held $90.48 billion. Together, the two networks accounted for approximately 77.7% of DefiLlama’s chain-level stablecoin supply. Ethereum remained the larger balance sheet, while Tron remained the most concentrated USDT rail, with USDT representing more than 99% of its stablecoin supply.
| Network | Stablecoin Supply | Seven-Day Change | Dominant Asset | Market Read |
|---|---|---|---|---|
| Ethereum | $150.72B | -1.74% | USDT: 50.74% | Largest Absolute Liquidity Drain |
| Tron | $90.48B | +1.21% | USDT: 99.06% | USDT Transfer Rail Expanded |
| Solana | $15.01B | -1.10% | USDC: 48.45% | Recent Growth Paused |
| BSC | $13.81B | +0.39% | USDT: 66.45% | Modest Positive Flow |
| Hyperliquid L1 | $6.16B | +1.95% | USDC: 97.16% | Trading Collateral Continued To Grow |
| Base | $4.89B | -1.67% | USDC: 87.29% | Supply Fell Despite Strong Transaction Activity |
| Arbitrum | $3.63B | -0.90% | USDC: 61.59% | Gradual Liquidity Contraction |
| Polygon | $3.40B | +0.94% | USDC: 54.47% | Moderate Weekly Growth |
| X Layer | $1.92B | +2.60% | USDG: 93.73% | Concentrated Ecosystem Expansion |
| Aptos | $1.89B | +0.53% | BUIDL: 43.40% | Tokenized Cash Is Material |
| Avalanche | $1.80B | +50.03% | BUIDL: 50.18% | Large Fund-Driven Supply Jump |
Ethereum’s 1.74% decline represented an estimated loss of more than $2.6 billion in stablecoin balances. Tron’s increase added roughly $1.1 billion, offsetting part of that decline.
Avalanche was the clear anomaly. Stablecoin supply increased by 50.03% to $1.80 billion, while BUIDL became the network’s dominant tracked dollar instrument with a 50.18% share. The move therefore looks less like a broad influx of retail payment liquidity and more like a large tokenized-fund allocation or issuance event.
Hyperliquid’s 1.95% growth had a different character. More than 97% of its tracked stablecoin supply was USDC, tying the increase directly to derivatives collateral and trading liquidity.
The same percentage move can mean very different things:
- Growth on Tron mainly reflects expansion of the USDT transfer rail.
- Growth on Hyperliquid primarily supports leveraged trading and settlement.
- Growth on Avalanche was heavily influenced by tokenized cash.
- Growth on Polygon or BSC is spread across broader payment, exchange, and DeFi activity.
Network supply should therefore be read alongside the dominant asset and the network’s primary use case.
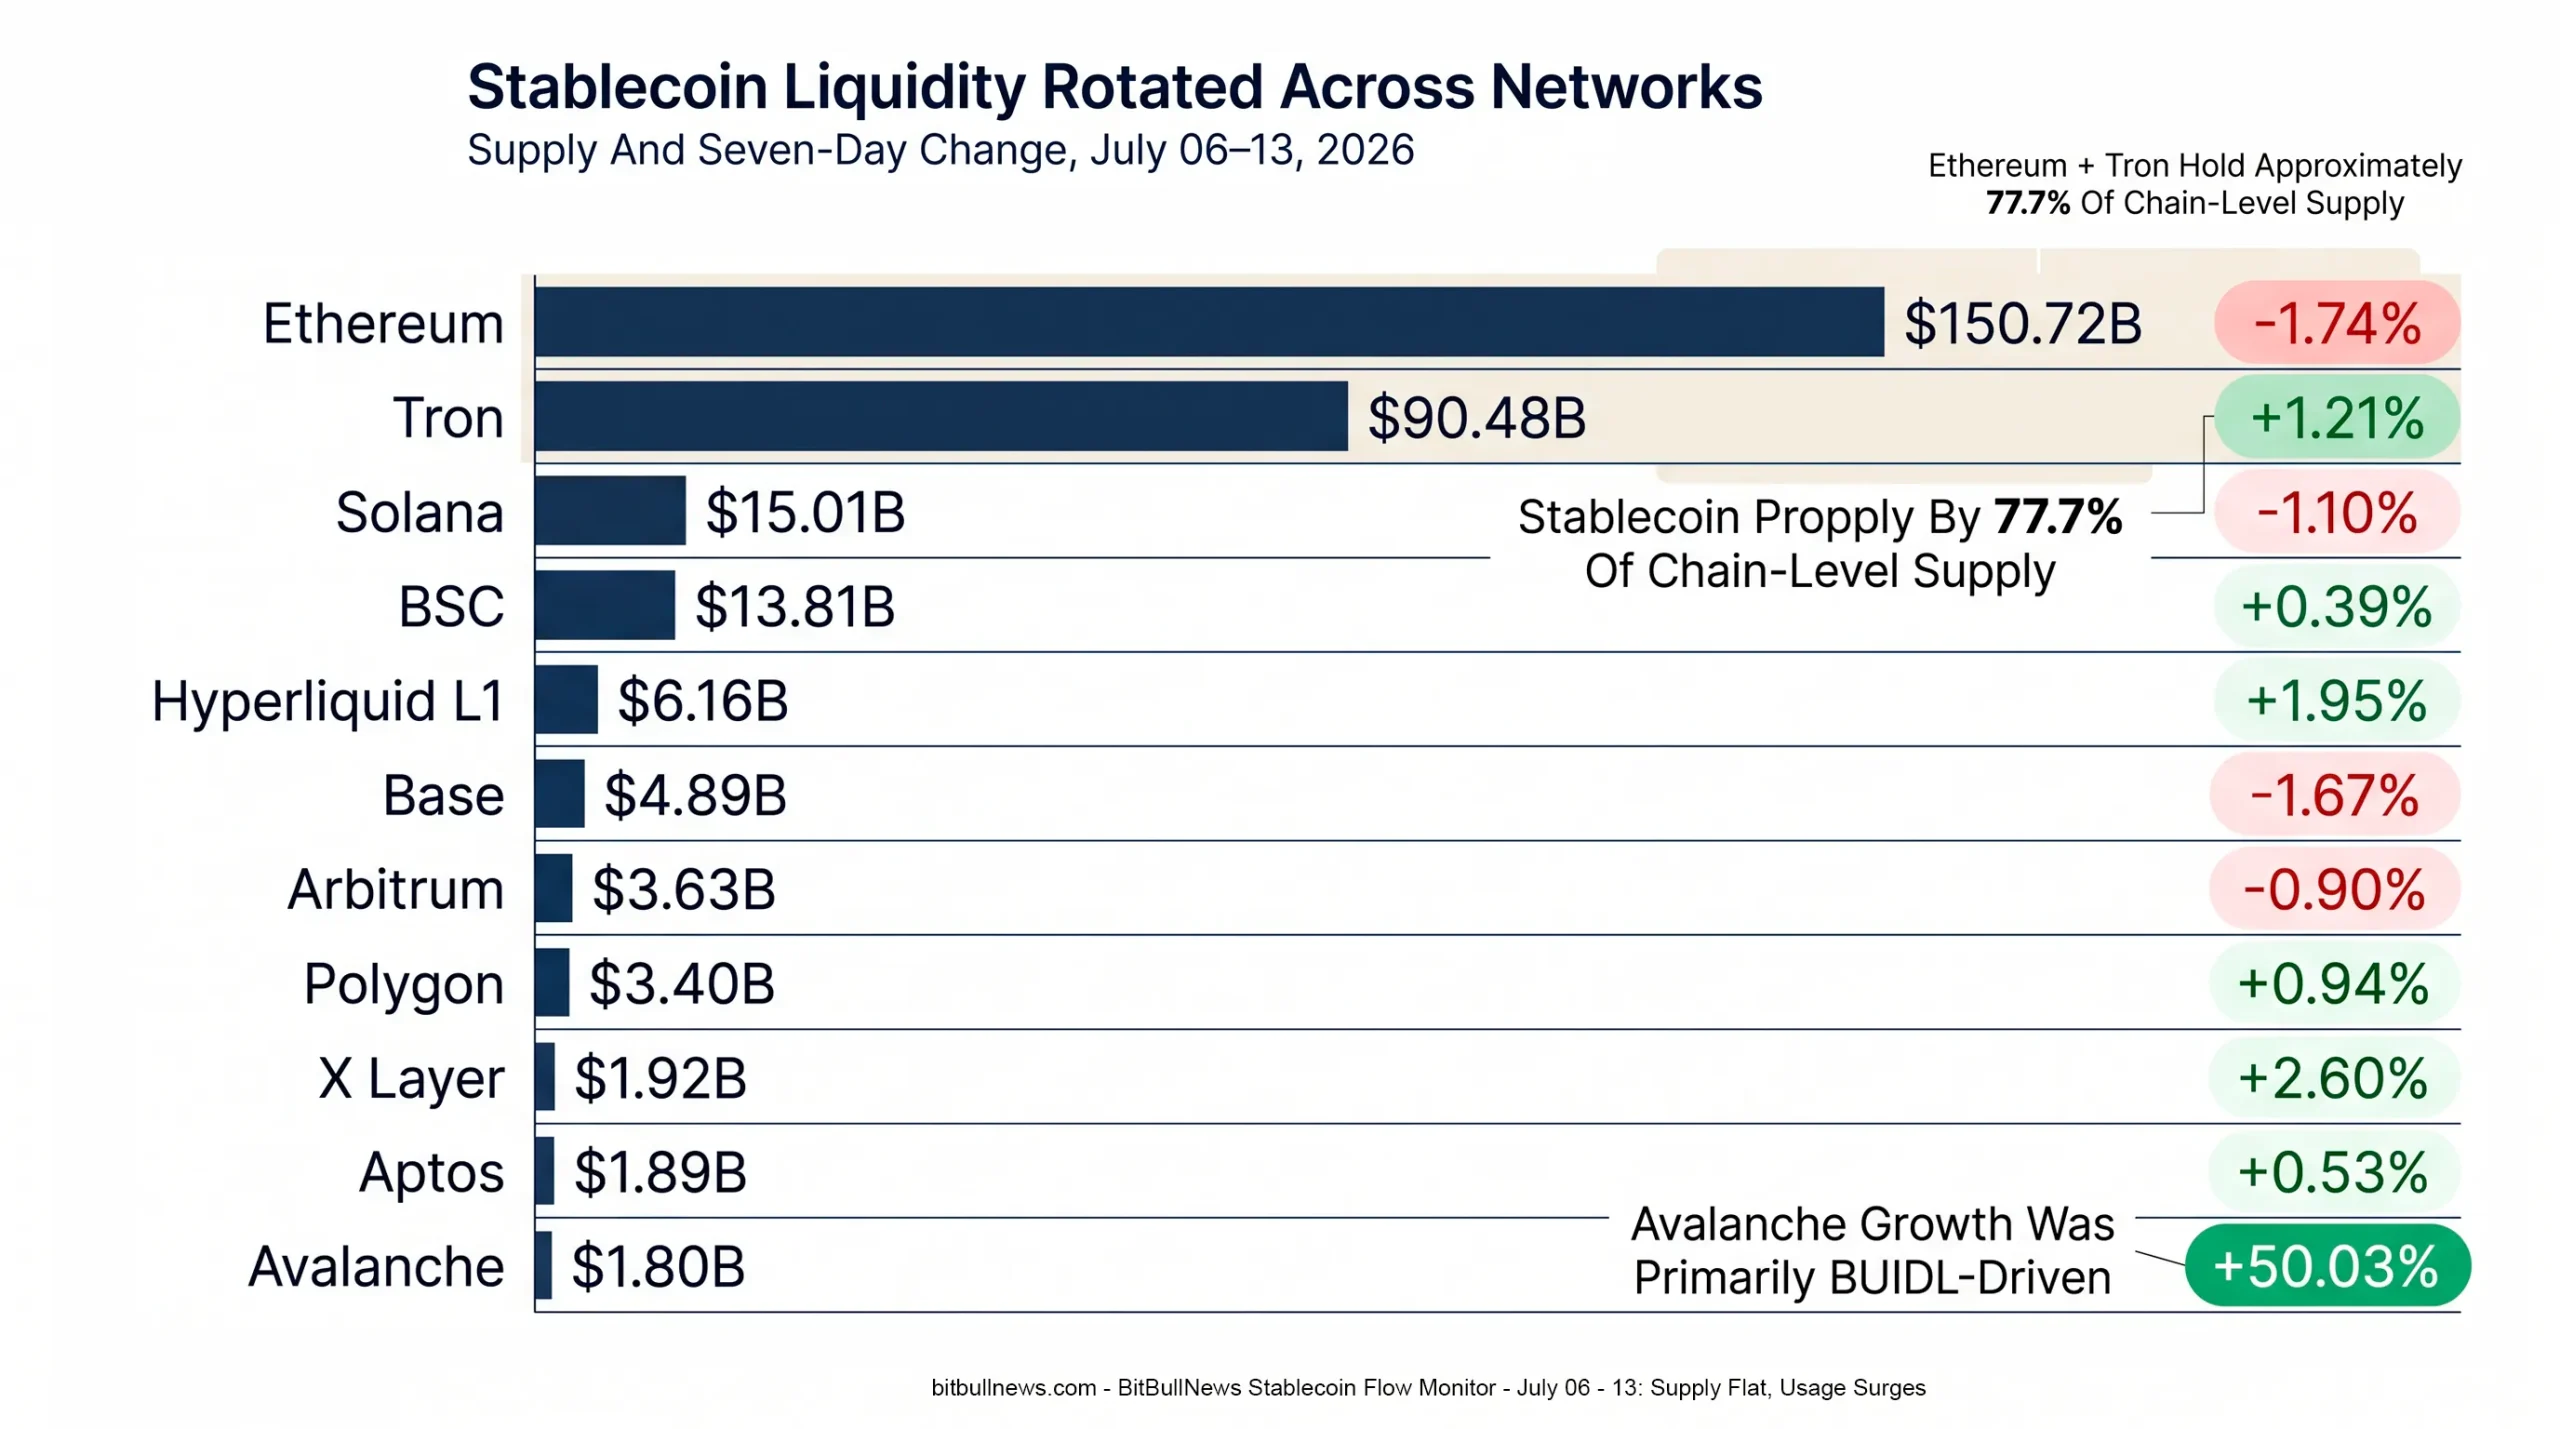
Chart: Horizontal bar chart showing stablecoin supply by network with a secondary seven-day percentage-change marker. Include Ethereum, Tron, Solana, BSC, Hyperliquid, Base, Arbitrum, Polygon, X Layer, Aptos, and Avalanche. Highlight Ethereum’s decline, Tron’s growth, and Avalanche’s 50.03% BUIDL-driven jump.
Record Usage Changes The Interpretation
Supply was flat. Adjusted transaction volume was not.
Visa’s Onchain Analytics methodology, developed with Allium, separates adjusted activity from raw transfers that may include bots, repetitive smart-contract interactions, exchange treasury movements, and other inorganic flows. The dashboard also separates retail-sized transactions, defining them as adjusted transfers below $250.
Data released during the reporting window showed adjusted stablecoin transaction volume reaching a record $1.79 trillion in June. That was 63% higher than May’s $1.10 trillion and 125% above the year-earlier level. The previous record was approximately $1.78 trillion in February 2026.
| June Adjusted-Volume Metric | Reading | Market Meaning |
|---|---|---|
| Total Adjusted Stablecoin Volume | $1.79T | New Monthly Record |
| Month-Over-Month Change | +63% | Activity Accelerated Sharply |
| Year-Over-Year Change | +125% | Structural Usage Growth Continued |
| USDC Adjusted Volume | ~$1.21T | 67% Of Total Activity |
| USDT Adjusted Volume | ~$576B | 32% Of Total Activity |
| Base Adjusted Volume | ~$565B | Largest Network By A Narrow Margin |
| Ethereum Adjusted Volume | ~$562B | Nearly Equal To Base |
The issuer split is the week’s strongest structural signal.
USDT controlled roughly 59% of outstanding supply, while USDC held about 24%. Yet USDC generated approximately 67% of adjusted June volume, compared with 32% for USDT.
USDT is the larger store of offshore and exchange-based dollar liquidity. USDC is generating more measured activity through regulated institutions, Ethereum-compatible applications, Base, Solana, DeFi, and payment infrastructure.
Market capitalization and transaction activity are measuring different strengths:
- USDT wins on outstanding supply and global distribution.
- USDC wins on adjusted transaction velocity.
- USDT remains central to offshore exchanges and cross-border transfer corridors.
- USDC is stronger across institutionally integrated and application-heavy blockchain rails.
Base also narrowly exceeded Ethereum in adjusted June volume, processing approximately $565 billion versus Ethereum’s $562 billion. Yet Base’s outstanding stablecoin supply fell during the current weekly window.
That is not necessarily a contradiction. A network can process high volume without accumulating more idle supply. Capital can move through a chain quickly, settle, and exit. High velocity and high balances are separate metrics.
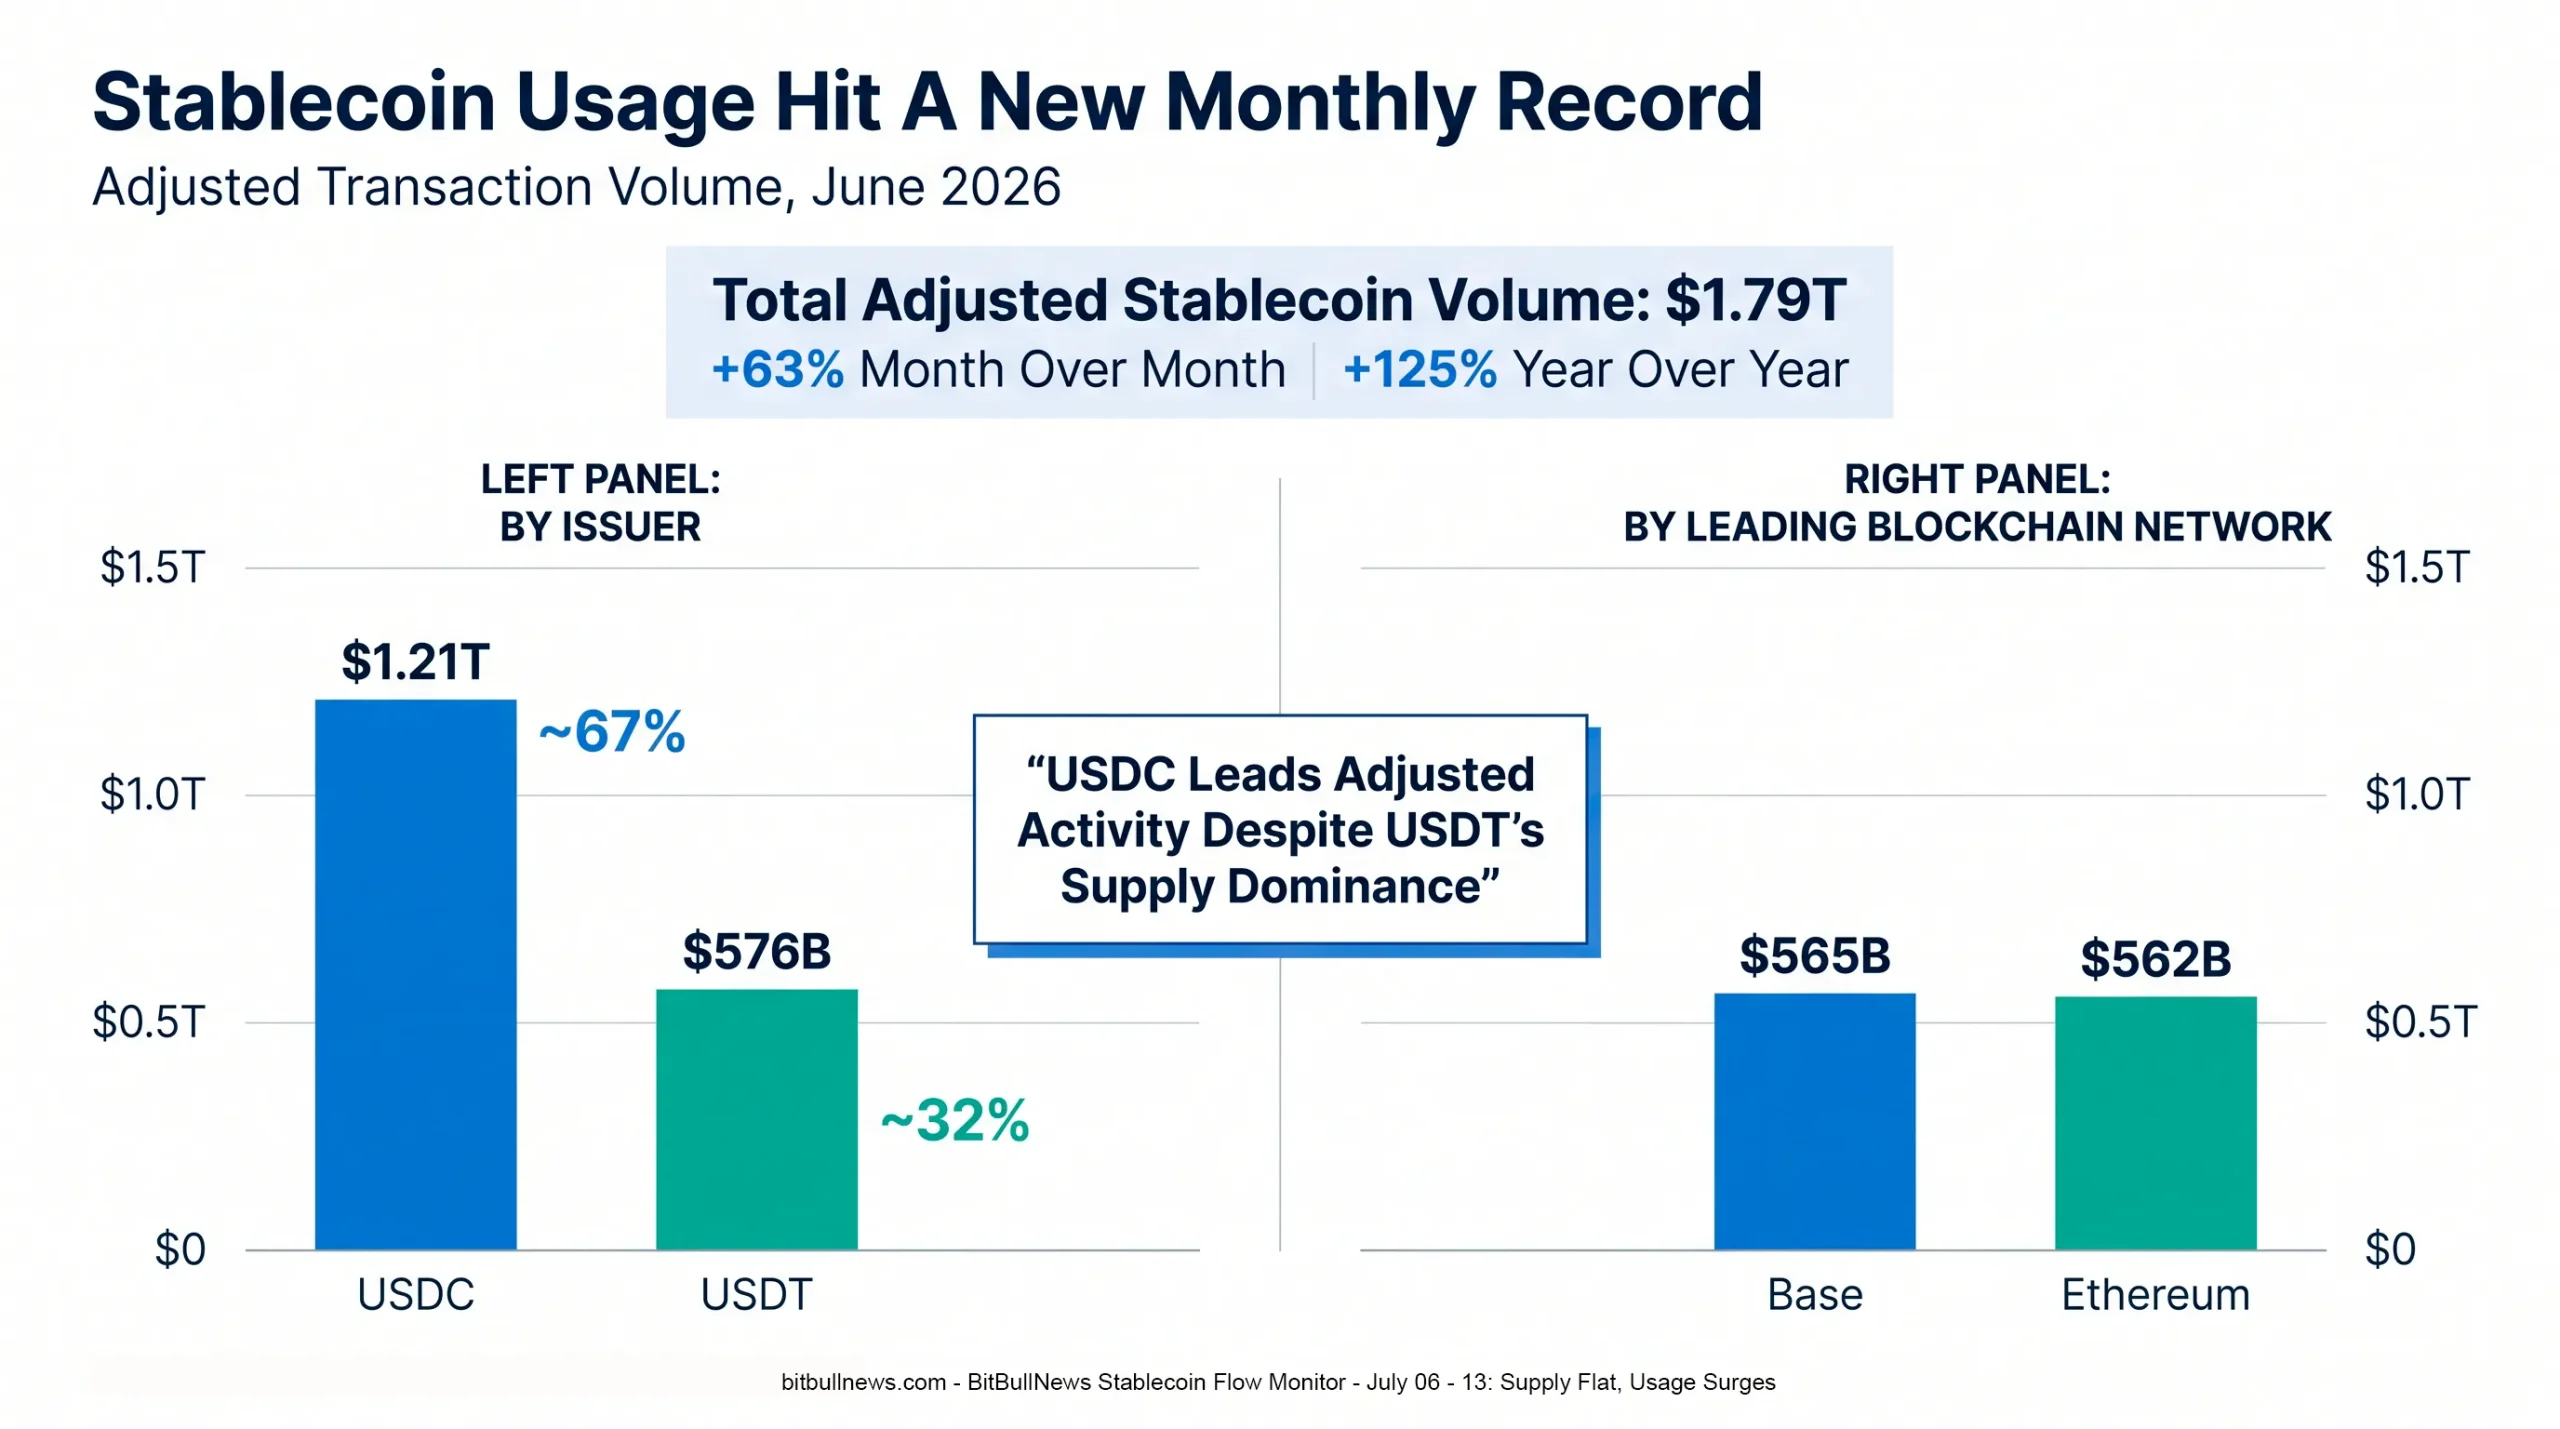
Chart: Two-panel institutional chart. Left panel: June adjusted volume by stablecoin, USDC $1.21T versus USDT $576B. Right panel: adjusted volume by leading network, Base $565B versus Ethereum $562B. Add a callout: “USDC Leads Activity Despite USDT’s Supply Dominance.”
Synthetic Stablecoins Took The Heaviest Pressure
Ethena’s USDe posted the largest weekly contraction among major tracked dollar instruments, falling 10.85% to approximately $3.95 billion. Its 30-day decline reached 11.91%.
USDe differs from fiat-reserve stablecoins because its stability and yield model relies on crypto collateral, derivatives hedging, and associated market infrastructure. A contraction can reflect lower demand for the yield product, reduced risk appetite, redemptions, or a smaller attractive spread relative to competing cash instruments.
USDS also fell 5.20% over seven days in DefiLlama’s dataset, while DAI grew slightly. The divergence shows that even related DeFi-native dollar products can move in opposite directions depending on savings rates, wrapper usage, collateral preferences, and product migration.
The broader lesson is that stablecoin contraction does not always mean dollars are leaving crypto entirely.
Capital may rotate:
- From synthetic dollars into fiat-backed stablecoins.
- From payment stablecoins into tokenized Treasury funds.
- Between USDS, DAI, and yield-bearing wrappers.
- From one blockchain to another without changing the issuer’s total supply.
- From on-chain balances back into bank deposits or money-market instruments.
This week showed several of those rotations at once.
Payment Liquidity And Tokenized Cash Are Merging
The line between a stablecoin dashboard and a tokenized-cash dashboard is becoming less useful.
DefiLlama included BUIDL at $3.69 billion and USYC at $3.00 billion among its largest stablecoin-like instruments. Circle describes USYC as a tokenized money-market fund with near-instant redemption into USDC, while BUIDL represents tokenized institutional cash-management exposure rather than a conventional payment coin.
Stablecoin Beat takes a different approach. It excludes yield-bearing instruments from its $302.1 billion core stablecoin total and tracks 95 yield-bearing dollar tokens with $17.6 billion in combined value separately.
Neither framework is inherently wrong. They answer different questions.
For a trader asking how much immediately deployable dollar collateral exists, payment stablecoins are the cleaner metric.
For an asset manager asking how much dollar-denominated value is moving through blockchain infrastructure, tokenized money-market funds belong in the picture.
For policymakers assessing payment or redemption risk, the legal structure matters more than the token’s placement on a market-cap table.
The industry needs to stop treating every dollar-denominated token as economically interchangeable.
| Risk | Current Signal | Why It Matters |
|---|---|---|
| Issuer Concentration | USDT And USDC Control ~82.5% | A Problem At Either Issuer Would Affect Most Crypto-Dollar Liquidity |
| Network Concentration | Ethereum And Tron Hold ~77.7% | Settlement And Operational Risk Remain Clustered |
| Product Classification | BUIDL And USYC Sit Beside Payment Stablecoins | Headline Supply Can Overstate Immediately Spendable Liquidity |
| Synthetic-Dollar Contraction | USDe Fell 10.85% In Seven Days | Yield-Sensitive Supply Can Exit Faster Than Fiat-Backed Supply |
| Fund-Driven Chain Spikes | Avalanche Supply Rose 50.03% | Large Percentage Growth May Reflect One Issuance Rather Than Broad Adoption |
| Supply-Velocity Divergence | Flat Supply, Record Adjusted Volume | Market Cap Alone Understates Economic Activity |
| Activity Concentration | USDC Generated 67% Of Adjusted June Volume | Transaction Infrastructure Is Concentrated Differently From Supply |
The market’s main risk is no longer only whether a stablecoin holds its peg. It is whether liquidity, settlement activity, reserves, redemption channels, and network exposure are too concentrated around a small number of entities.
Actionable Signals For Traders, Investors, And Issuers
For Traders
Watch USDC supply alongside adjusted volume. Rising circulation plus sustained activity would confirm a stronger institutional and application-driven liquidity cycle. High volume without continued supply growth may indicate fast capital turnover rather than new money entering the market.
USDe deserves separate monitoring. Another week of heavy redemptions would point to continued retreat from synthetic-dollar risk rather than a broad stablecoin problem.
For Investors
Separate payment stablecoins from tokenized cash products. BUIDL growth strengthens the blockchain-based cash-management thesis, but it does not provide the same open liquidity profile as USDT or USDC.
Chain concentration also matters. Holding a stablecoin does not remove network, bridge, custody, or smart-contract exposure.
For Issuers
Distribution is becoming as important as reserve design. Circle’s integrations with BNY and Standard Chartered show how bank-side minting, redemption, and custody can expand access without requiring every institution to build direct crypto infrastructure.
For Policymakers
Market-cap dashboards increasingly mix payment instruments, synthetic dollars, tokenized funds, and yield-bearing wrappers. Regulatory analysis should classify products by legal claim, reserve structure, redemption rights, and permitted use rather than by ticker or price target alone.
Key Findings
- DefiLlama’s broad stablecoin market capitalization reached $312.31 billion, up only $173 million over seven days and down 0.87% over 30 days.
- USDT remained dominant at $184.15 billion, while USDC increased 0.66% to $73.52 billion.
- USDT and USDC together controlled approximately 82.5% of tracked supply.
- BUIDL rose 21.03% to $3.69 billion, while USDe fell 10.85% to $3.95 billion.
- Chain-level stablecoin supply fell $1.47 billion, with Ethereum down 1.74% and Tron up 1.21%.
- Avalanche stablecoin supply jumped 50.03% to $1.80 billion, with BUIDL representing just over half of the network’s total.
- Adjusted June stablecoin transaction volume reached a record $1.79 trillion, up 63% month over month and 125% year over year.
- USDC generated approximately 67% of adjusted June volume, compared with USDT’s 32%, despite USDT holding far more outstanding supply.
- Circle received final OCC approval on July 10, 2026, to establish Circle National Trust under direct federal supervision.
What To Watch Next
The first watch item is whether USDC’s weekly supply growth continues after Circle’s OCC approval and recent bank integrations. One positive week is not a trend, but the institutional access path is getting stronger.
The second is BUIDL. If its expansion continues, stablecoin market growth will become increasingly tied to tokenized Treasury demand rather than conventional payment-coin issuance.
The third is USDe. Another double-digit weekly contraction would signal that the synthetic-dollar segment remains under pressure.
The fourth is Ethereum. The network still holds nearly half of chain-level stablecoin supply, but it lost substantial balances this week. A continued decline would strengthen the case that settlement liquidity is dispersing across Tron, application-specific chains, and tokenized-asset networks.
The fifth is Avalanche. The 50% supply jump needs to be tested against transfer activity, holders, and DeFi use. A large BUIDL issuance can increase the balance sheet without creating a broader liquid stablecoin economy.
The sixth is adjusted volume. June’s $1.79 trillion record matters more if activity remains elevated through July rather than reverting after one exceptional month.
BitBullNews View
Stablecoin liquidity stabilized this week, but the market did not return to broad expansion.
USDC and BUIDL grew. USDe and USDS contracted. Ethereum lost balances. Tron gained. Avalanche printed a huge percentage increase driven largely by tokenized cash. Underneath an almost unchanged market-cap total, the structure moved sharply.
The usage data was stronger than the supply data. Record adjusted volume shows that existing stablecoins are working harder even when total issuance is flat. USDC’s transaction lead also shows why market capitalization is no longer enough to identify the most important stablecoin.
USDT remains the global liquidity reserve of crypto. USDC is becoming the leading regulated transaction rail. Tokenized funds are becoming a third category that sits between stablecoins and traditional money markets.
The next phase of the market will not be defined only by how many digital dollars exist. It will be defined by what those dollars are legally, where they sit, how quickly they move, and who can redeem them.
Data Sources & References
- DefiLlama — Stablecoin Market Cap, Supply, Peg And Issuer Data
- DefiLlama — Stablecoin Supply By Blockchain Network
- Stablecoin Beat — Stablecoin Market Cap Tracker
- Stablecoin Beat — Historical Stablecoin Market Cap Charts
- Visa Onchain Analytics — Stablecoin Transaction Data
- Visa Onchain Analytics — Stablecoin Retail Transaction Data
- FinanceFeeds — Stablecoin Transaction Volume Hits Record $1.79 Trillion In June
- Circle — Final OCC Approval To Establish National Trust Bank
- Circle — Standard Chartered Integrated USDC Minting And Redemption
- Circle — BNY Stablecoin Custody, Mint And Burn Services
- Tether — Official USD₮ Market Information