


Content
Stablecoin liquidity remained defensive during the June 29 – July 06, 2026 reporting window.
DefiLlama tracked total stablecoin market capitalization at $311.4 billion, down $1.46 billion over seven days and 1.59% over 30 days. The market was not in free fall, but it was still bleeding supply. That matters because stablecoins are the cash layer of crypto: when supply expands, exchanges, DeFi venues, payment rails, and treasury desks usually get more deployable dollars; when supply contracts, the market loses some of that immediately usable liquidity.
The contraction was concentrated in the two largest issuers. USDT fell 0.43% over seven days to $184.1 billion, while USDC fell 1.04% to $73.0 billion. Together they still controlled roughly 82.6% of DefiLlama-tracked stablecoin supply. That is the core structure of the market: liquidity is not disappearing, but it remains highly concentrated and slightly smaller than it was a week ago.
Chain-level flows were more mixed. Ethereum and Tron still held about 78% of tracked stablecoin supply, but both declined over the week. Solana, Hyperliquid L1, Base, Polygon, Aptos, and X Layer all posted positive seven-day growth. That split says the market is not broadly adding dollar liquidity; it is rotating around the edges.
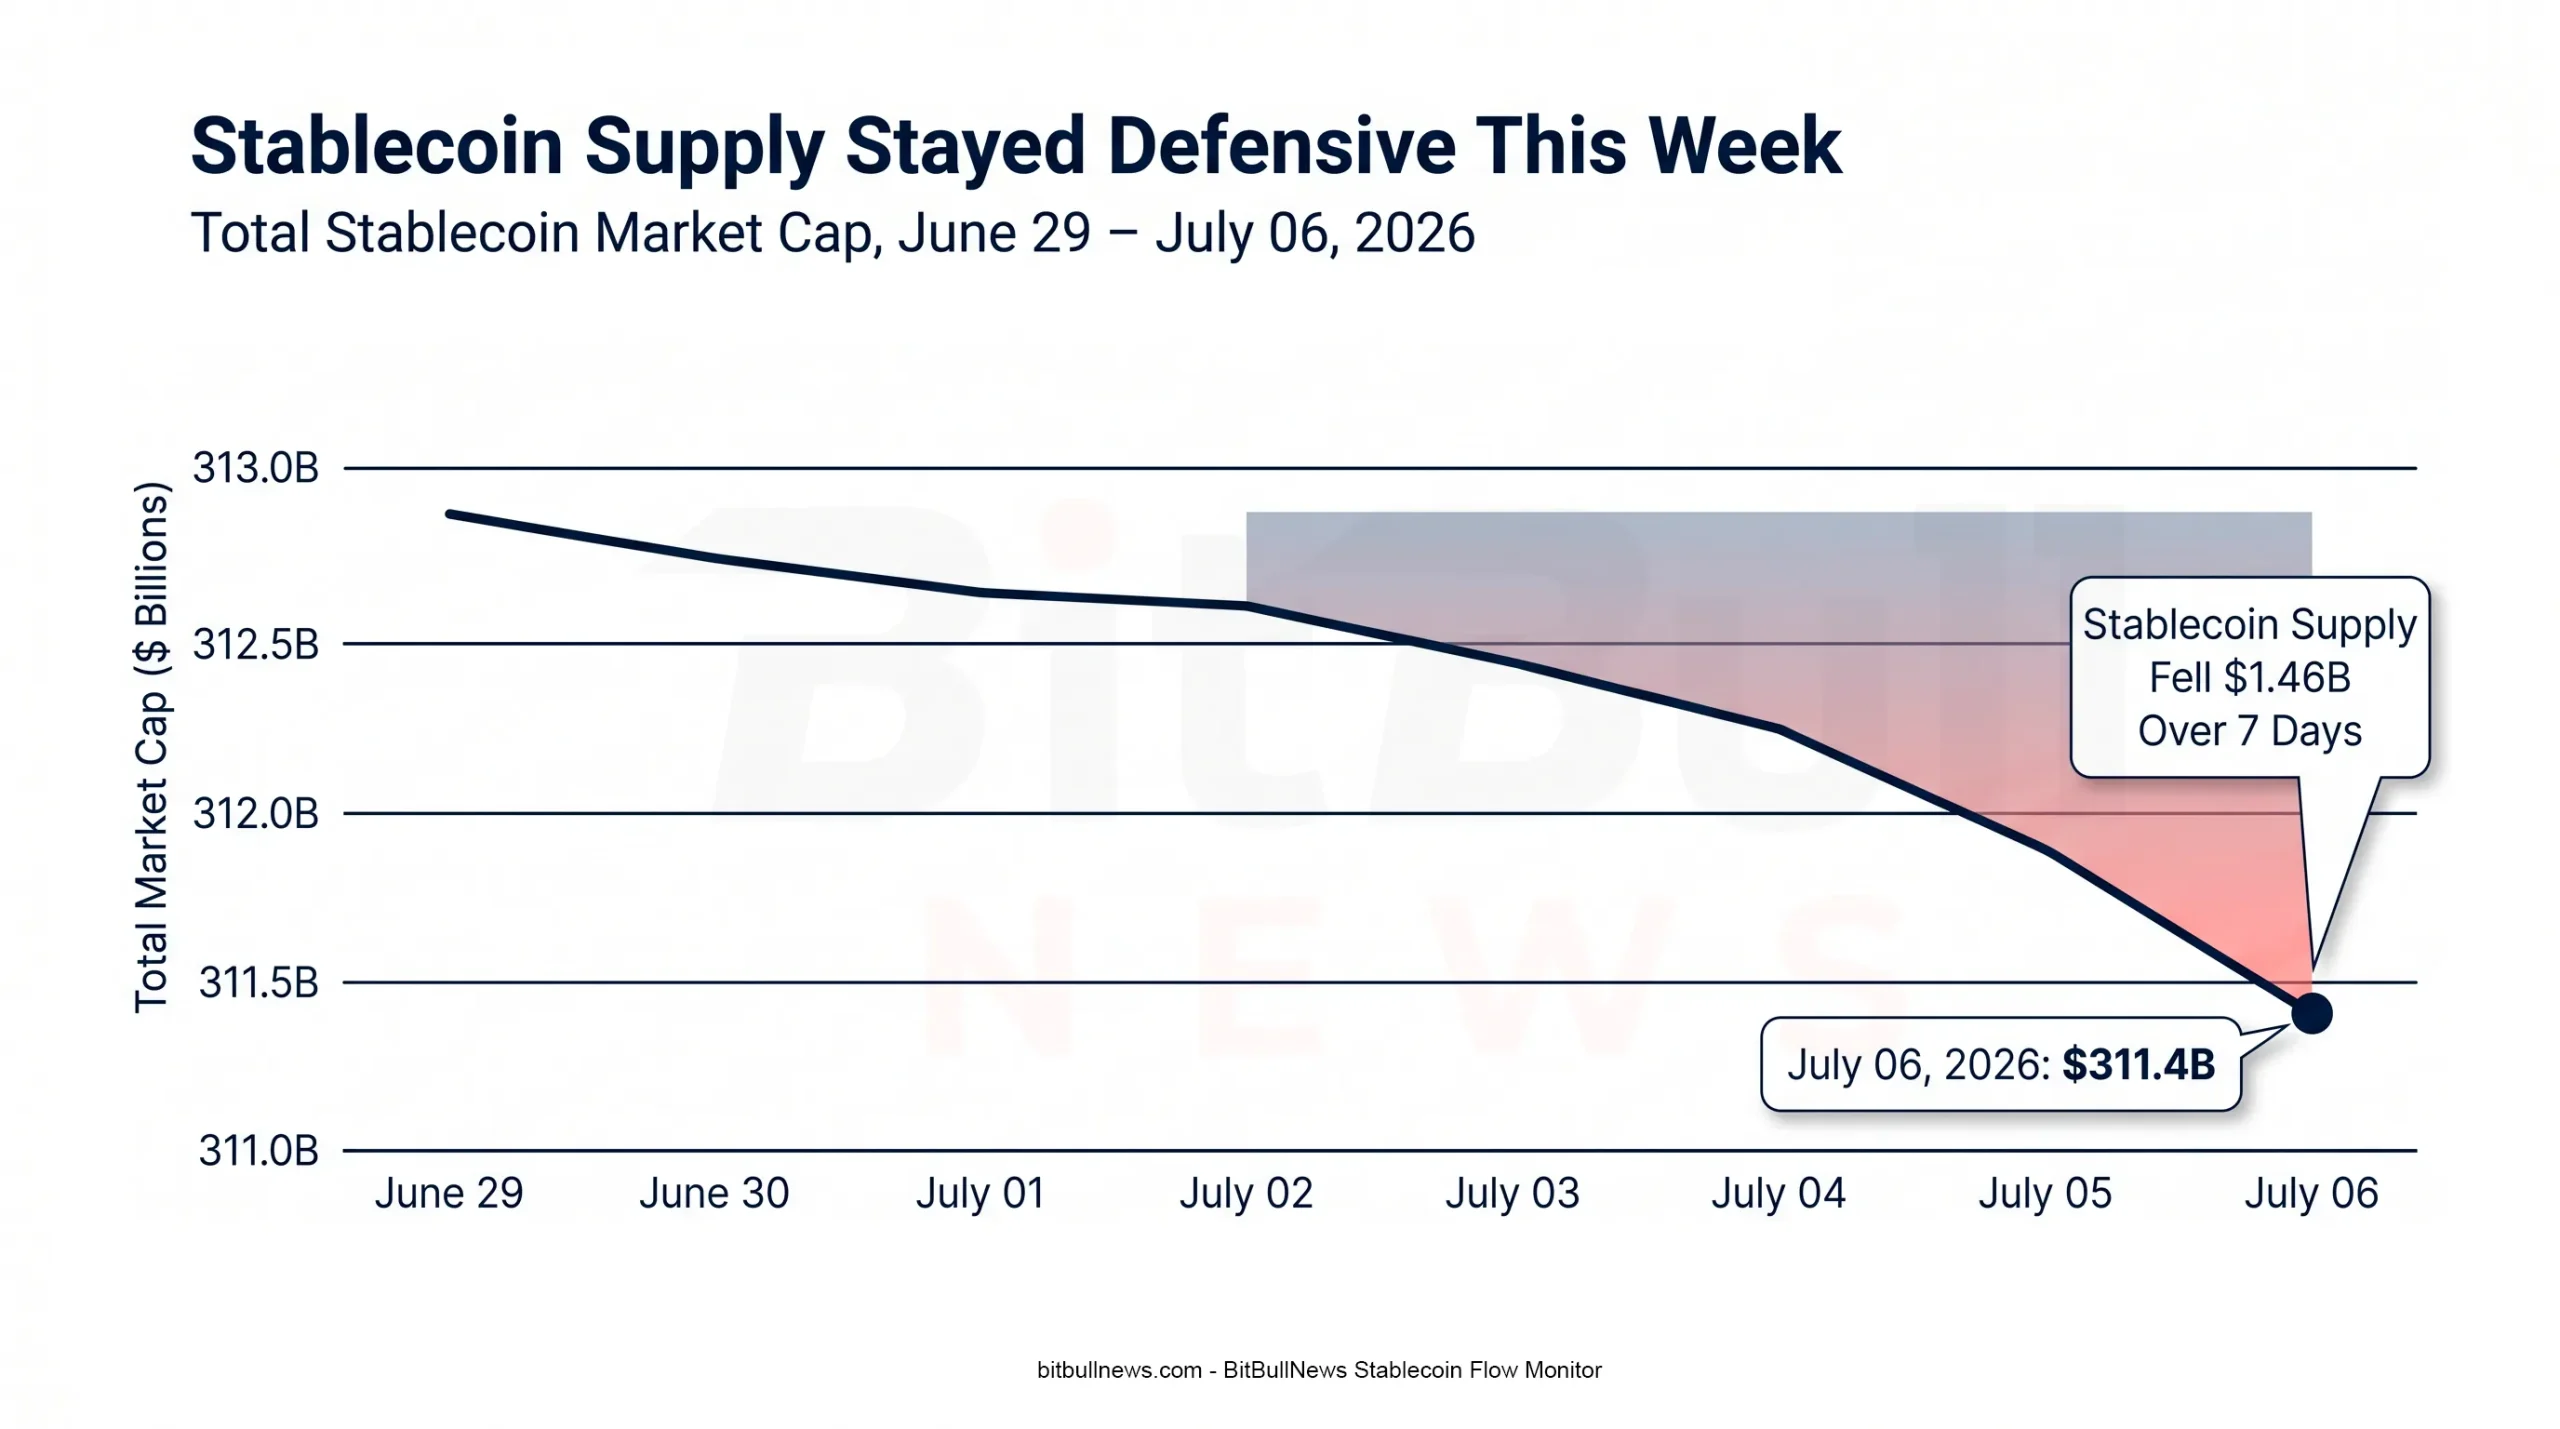
Chart: Line Chart Showing Total Stablecoin Market Cap From June 29 To July 06, 2026. Add A Shaded Area For The Seven-Day Decline Of $1.46B And A Marker At $311.4B On July 06.
Market Structure Snapshot
DefiLlama and Stablecoin Beat both point in the same direction: the stablecoin market is above $300 billion, but recent growth has stalled. DefiLlama showed a 1.59% 30-day decline, while Stablecoin Beat’s narrower tracker showed $302.3 billion in total market cap as of July 05 and a 1.6% contraction over 90 days. The exact totals differ because provider coverage differs, but the signal is consistent: stablecoin supply is cooling.
| Metric | Latest Reading | Change | Market Read |
|---|---|---|---|
| Total Stablecoin Market Cap | $311.4B | -$1.46B Over 7D / -1.59% Over 30D | Supply Still Contracting |
| USDT Dominance | 59.12% | N/A | Tether Remains The Liquidity Anchor |
| USDT Market Cap | $184.1B | -0.43% Over 7D / -1.66% Over 30D | Mild Weekly Drain |
| USDC Market Cap | $73.0B | -1.04% Over 7D / -3.40% Over 30D | Larger Relative Contraction |
| USDT + USDC Share | ~82.6% | N/A | Two-Issuer Market Structure Holds |
| Stablecoin Beat 90D Market Change | $302.3B Total / -1.6% | -$4.8B Vs 90D | Longer Cooling Trend Confirmed |
The important point is not that the market fell by less than 1% in a week. The important point is that the two deepest settlement assets both contracted. A stablecoin market can look calm at the headline level while still sending a weaker liquidity signal if USDT and USDC are both shrinking at the same time.
Weekly Flow By Issuer
The top of the market stayed defensive. USDT and USDC both declined, USDS continued to lose supply, and synthetic or DeFi-native stablecoins were mixed. The exceptions came from smaller segments: DAI grew over 30 days, USYC and BUIDL expanded, USDG remained one of the stronger mid-tier growers, and PYUSD posted a positive weekly move. DefiLlama’s top-asset table showed these movements clearly on July 06.
| Stablecoin | Market Cap | 7D Change | 30D Change | Read |
|---|---|---|---|---|
| USDT | $184.1B | -0.43% | -1.66% | Still Dominant, But Not Expanding |
| USDC | $73.0B | -1.04% | -3.40% | Regulated-Dollar Rail Under Redemption Pressure |
| USDS | $8.0B | -2.60% | -6.34% | DeFi-Native Supply Still Weak |
| DAI | $4.85B | +0.09% | +7.36% | Monthly Rebound Continued |
| USD1 | $4.61B | -1.75% | -0.71% | Losing Weekly Momentum |
| USDe | $4.43B | -0.57% | -1.56% | Synthetic-Dollar Demand Softer |
| USYC | $3.10B | -0.09% | +9.84% | Tokenized Cash Segment Still Growing |
| BUIDL | $3.05B | -0.21% | +3.31% | Institutional Tokenized Cash Remains Resilient |
| USDG | $2.88B | -0.74% | +15.40% | Strongest 30D Growth Among Large Mid-Tier Names |
| PYUSD | $2.84B | +4.19% | -0.70% | Weekly Rebound, Still Down On Month |
The anomaly is the growing overlap between classic payment stablecoins and tokenized cash products. USYC, BUIDL, and USDY sit beside USDT and USDC on stablecoin dashboards, but they do not represent the same market function. USDT and USDC are payment and settlement instruments. Tokenized cash and yield products are closer to on-chain money-market exposure. They can both be “digital dollars,” but they do not carry identical liquidity, redemption, or legal profiles.
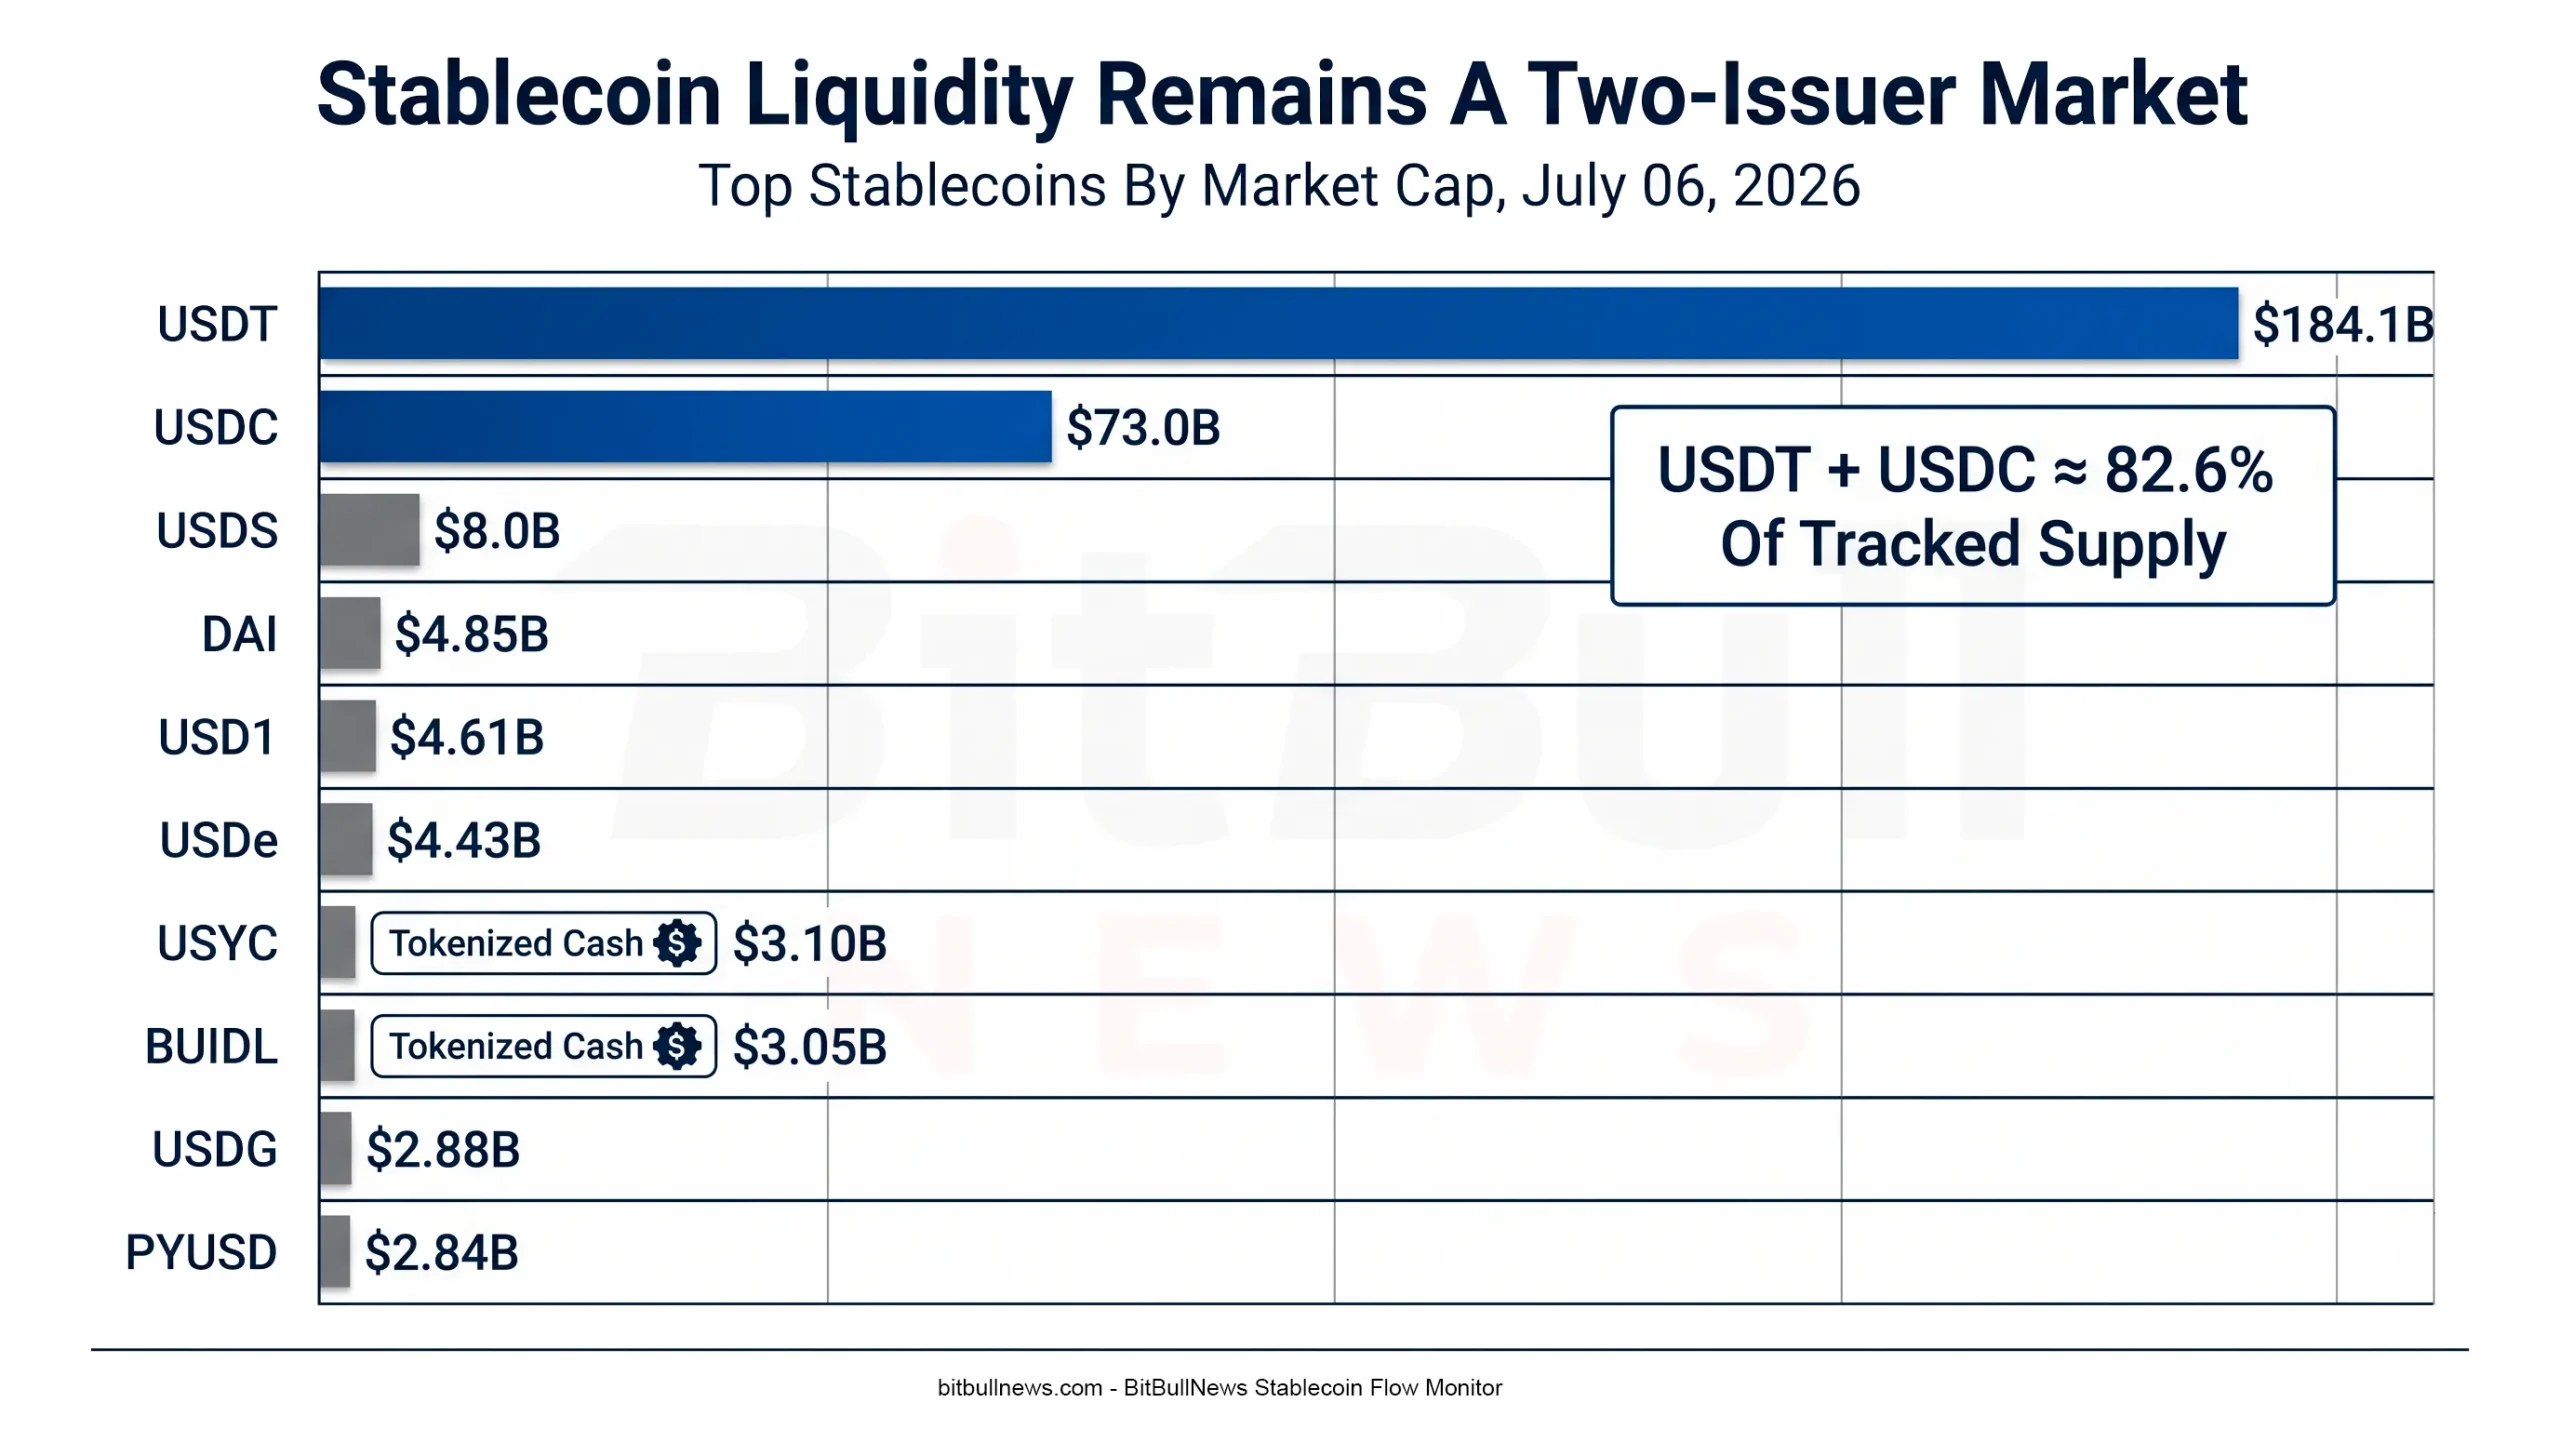
Chart: Horizontal Bar Chart Ranking The Top 10 Stablecoins By Market Cap. Highlight USDT And USDC As The Two Dominant Issuers And Use A Separate Visual Tag For Tokenized Cash Products Such As USYC And BUIDL.
Chain-Level Flows: Ethereum And Tron Still Dominate, But Growth Is Elsewhere
Chain distribution remains brutally concentrated. DefiLlama’s chain dashboard showed total chain-level stablecoin market cap at $311.0 billion, with Ethereum at $153.3 billion and Tron at $89.4 billion. Together, they held roughly 78% of tracked chain-level stablecoin liquidity.
| Chain | Stablecoin Market Cap | 7D Change | Dominant Stablecoin | Market Interpretation |
|---|---|---|---|---|
| Ethereum | $153.3B | -1.07% | USDT: 51.18% | Still The Main Institutional And DeFi Settlement Layer |
| Tron | $89.4B | -0.26% | USDT: 97.91% | USDT Transfer Rail Remains Massive But Flat-To-Down |
| Solana | $15.2B | +1.14% | USDC: 48.45% | Selective Inflow Into Faster Payment/Trading Rail |
| BSC | $13.7B | -0.12% | USDT: 67.12% | Mostly Stable, Slightly Negative |
| Hyperliquid L1 | $6.0B | +1.82% | USDC: 96.79% | Perp-Native Liquidity Recovered |
| Base | $5.0B | +1.71% | USDC: 86.44% | USDC-Centric L2 Growth Continued |
| Arbitrum | $3.7B | -2.19% | USDC: 60.84% | L2 Liquidity Fell |
| Polygon | $3.4B | +0.85% | USDC: 54.72% | Modest Weekly Growth |
| Aptos | $1.9B | +0.61% | USDT: 45.46% | Smaller Positive Flow |
| X Layer | $1.9B | +2.56% | USDG: 94.69% | Small But Fast-Growing Stablecoin Base |
Ethereum remains the institutional base layer for DeFi collateral, tokenized cash, and composable settlement. Tron remains the USDT transfer machine. The difference this week is that neither of the two giants grew. The growth came from smaller rails: Solana, Hyperliquid, Base, Polygon, Aptos, and X Layer.
That is a classic late-cycle liquidity pattern. The market is not adding broad stablecoin supply, but application-specific venues still attract balances where users need cheaper settlement, faster execution, derivatives collateral, or ecosystem incentives.
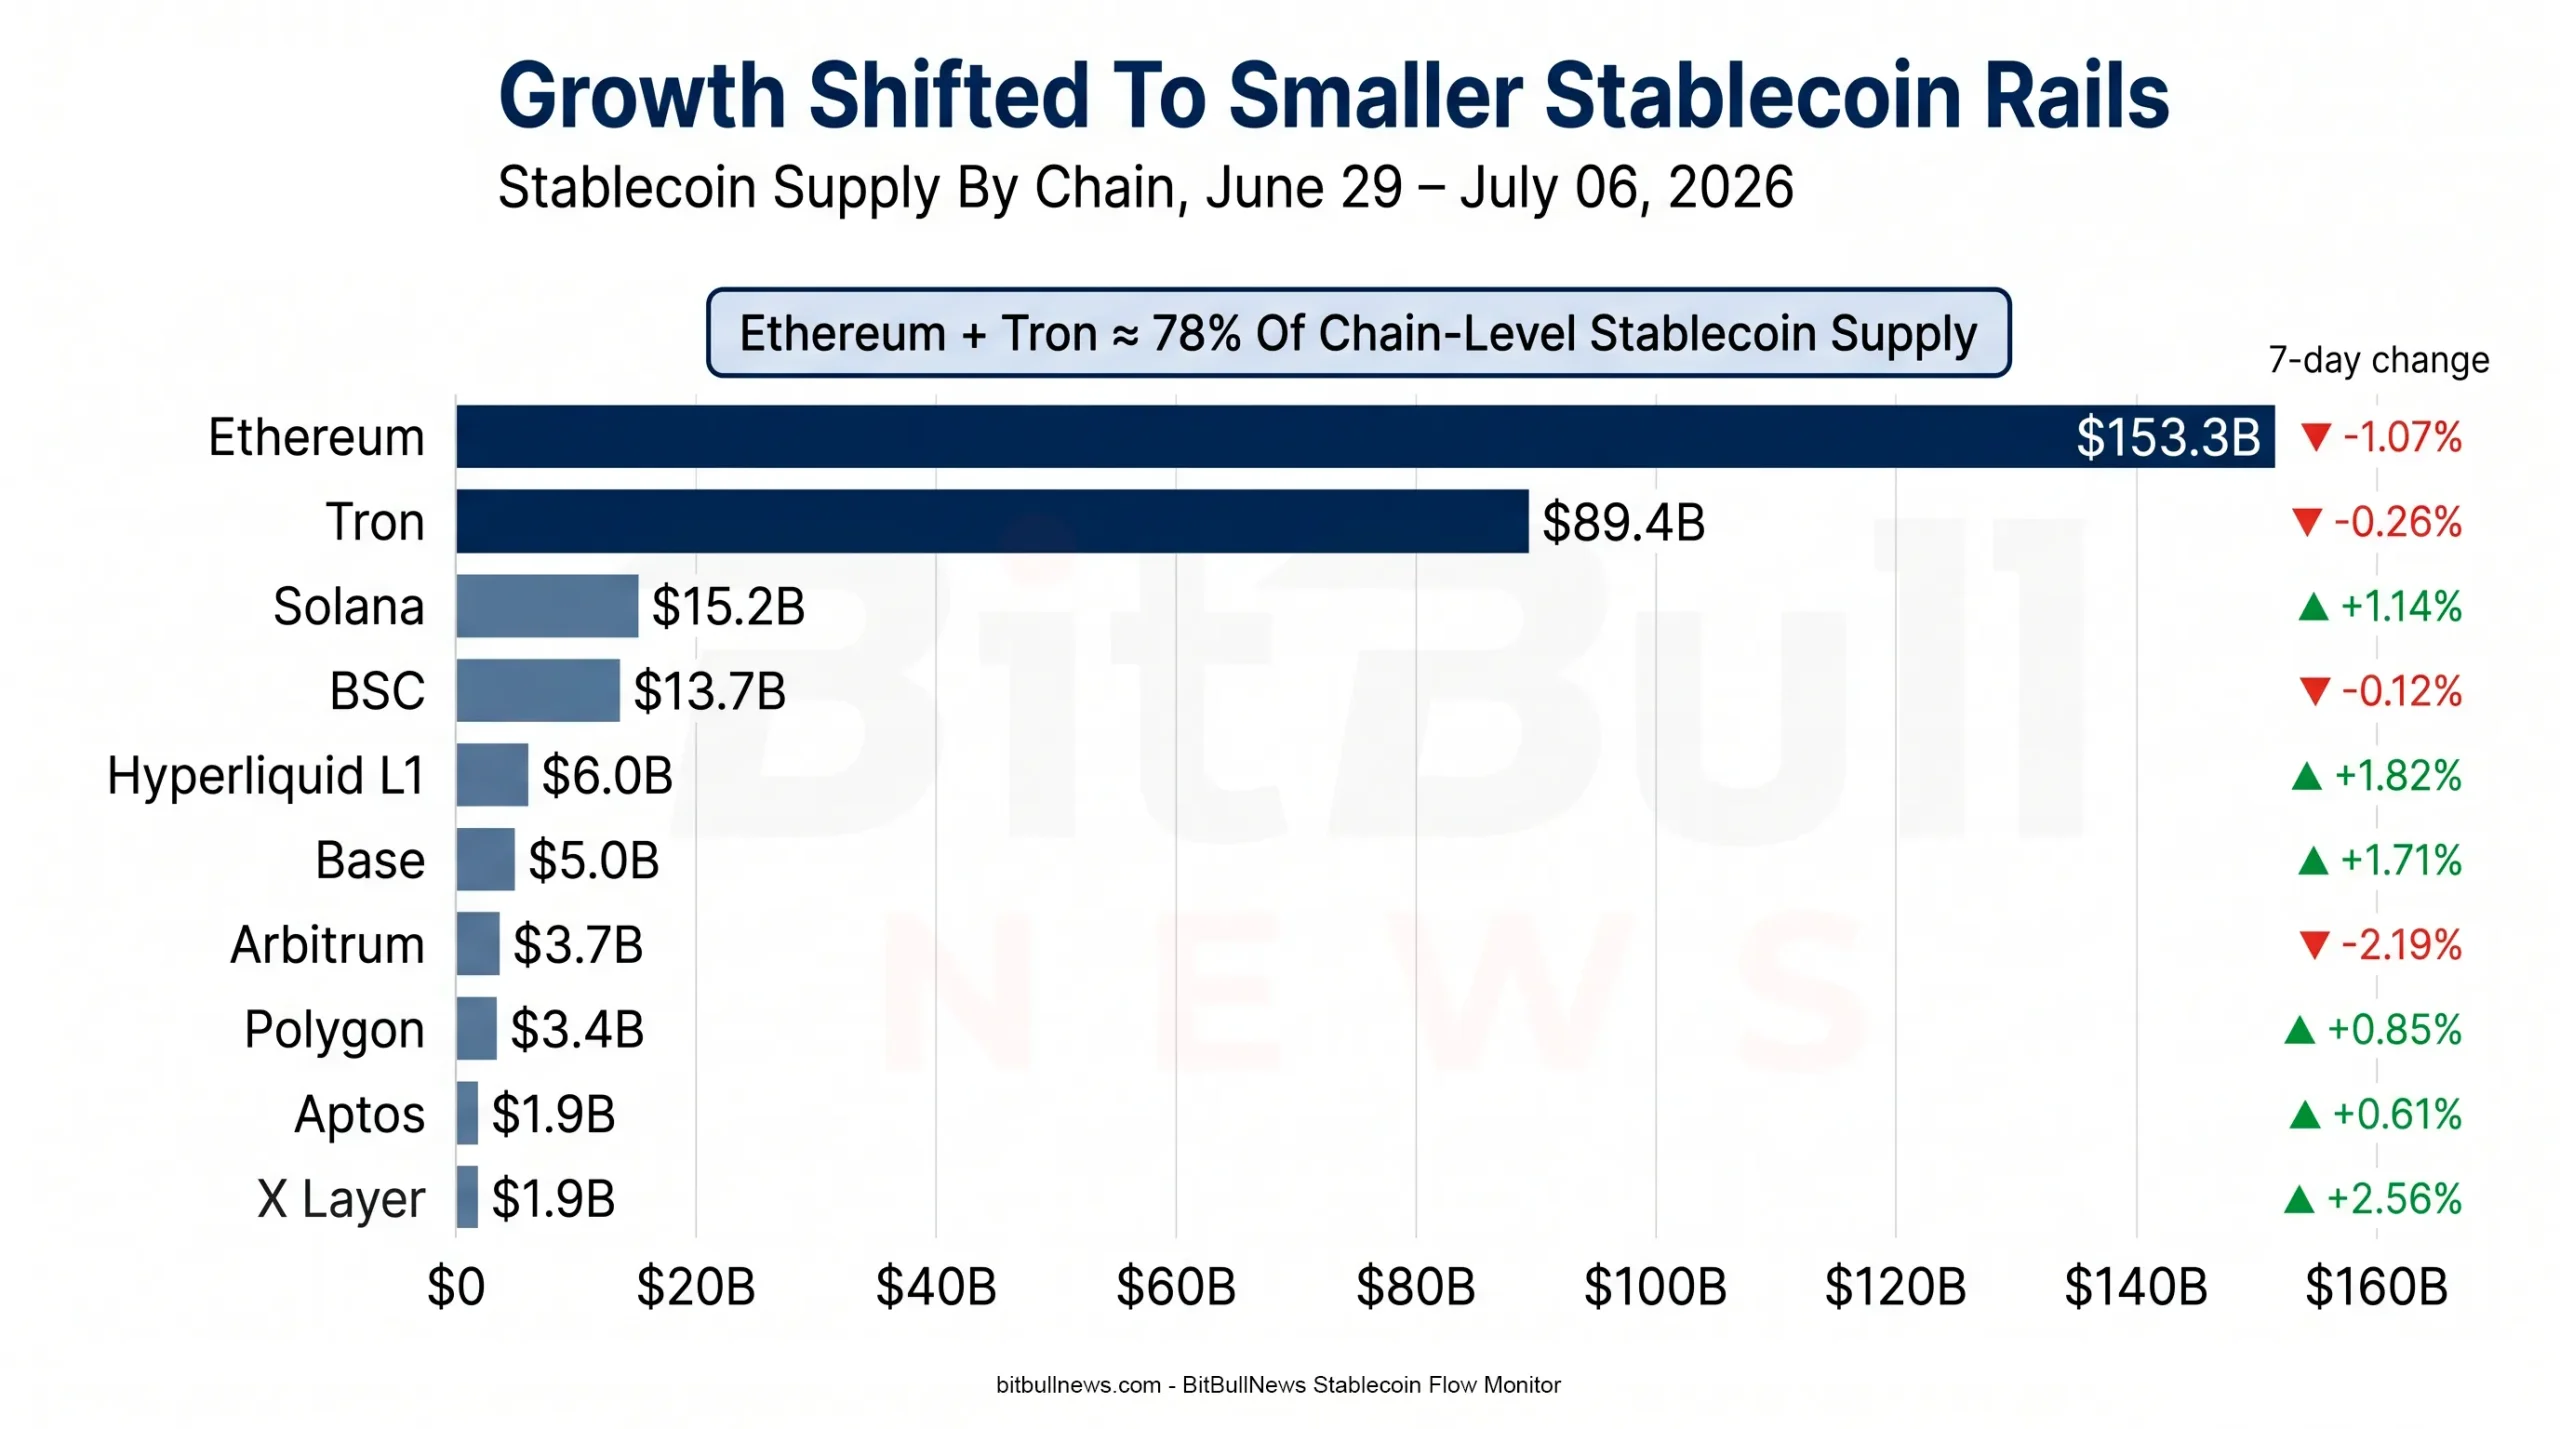
Chart: Horizontal Bar Chart Showing Stablecoin Supply By Chain, With Ethereum And Tron Highlighted. Add A Secondary Marker For 7D Change To Show Smaller Networks Gaining While Ethereum And Tron Decline.
What The Flows Actually Mean
This was a defensive week, not a panic week.
A $1.46 billion weekly decline on a $311.4 billion stablecoin base is not large enough to call a liquidity shock. But the direction still matters. Stablecoin supply is one of the cleanest public proxies for deployable crypto-dollar liquidity. When both USDT and USDC contract, traders lose a part of the “fresh cash sitting on-chain” argument.
The chain data adds nuance. Ethereum and Tron declined, while Solana, Base, Hyperliquid, and X Layer grew. That suggests liquidity is not leaving crypto evenly. It is being reallocated toward specific venues and use cases. The market is pulling back at the aggregate level, but some networks are still capturing working capital.
For traders, this means rallies need confirmation from spot demand, ETF inflows, or derivatives positioning rather than stablecoin supply alone.
For DeFi desks, the message is more selective. The Base and Hyperliquid readings show that USDC liquidity can still grow where the product loop is strong. The Arbitrum decline shows that L2 liquidity is not automatically sticky.
For issuers, the week reinforces the same lesson: distribution matters, but redemption behavior matters more. A stablecoin can have strong brand presence and still lose supply if holders are rotating into bank deposits, tokenized yield, or other stablecoin rails.
Issuer Quality And Institutional Rails
Reserve transparency remains a market-structure issue. Tether’s latest public Q1 2026 attestation reported $191.8 billion in total assets, $183.5 billion in liabilities, and an $8.23 billion excess-reserve buffer, with reserves concentrated in short-duration liquid instruments. Circle says USDC reserve holdings are disclosed weekly, mint and burn flows are published, and monthly third-party assurance is provided by a Big Four accounting firm.
The BNY development matters because it changes how institutions interact with USDC. BNY said it would allow institutional clients to store, transfer, mint, and burn USDC through its digital-asset platform by the end of July. For a stablecoin that already leans on regulated reserve infrastructure, bank-side mint and burn access improves the institutional operating case.
That does not make USDC immune to outflows. The market data says the opposite this week. USDC contracted more than USDT on a percentage basis. The distinction is important: reserve quality and institutional rails can strengthen long-term adoption, while short-term supply still moves with trading demand, treasury decisions, and market risk appetite.
Adjusted Volume: Do Not Confuse Transfers With Economic Use
Stablecoin transfer volume can mislead if it is read raw. Visa’s Onchain Analytics Dashboard, built with Allium Labs, exists specifically to separate stablecoin movement from more meaningful adjusted activity. Visa describes the dashboard as a way to understand how fiat-backed stablecoins move across public blockchains and includes adjusted transaction volume, adjusted transaction count, supply, and active-address metrics.
That methodology matters for this monitor. A stablecoin can generate enormous transaction volume because of exchange movements, internal transfers, smart-contract routing, bot activity, or treasury rebalancing. None of that automatically means retail payments or real-economy settlement.
This week’s supply data is therefore more useful than raw volume for market direction. Supply contracted. The market had fewer stablecoin dollars outstanding than a week earlier. That is the cleaner liquidity signal.
Structural Risks To Watch
| Risk Area | Current Signal | Why It Matters |
|---|---|---|
| Issuer Concentration | USDT And USDC Hold ~82.6% Of DefiLlama-Tracked Supply | A disruption At Either Issuer Would Hit Exchange Liquidity, DeFi Collateral, And Payment Rails |
| Chain Concentration | Ethereum And Tron Hold ~78% Of Chain-Level Supply | Stablecoin Settlement Risk Remains Clustered Around Two Networks |
| USDC Contraction | USDC Fell 1.04% Over 7D And 3.40% Over 30D | Regulated-Dollar Demand Is Not Immune To Liquidity Pullbacks |
| Tokenized Cash Overlap | USYC, BUIDL, USDY, And Similar Products Sit Beside Payment Stablecoins | Analysts Need To Separate Payment Liquidity From Yield-Bearing Cash Exposure |
| Volume Quality | Visa/Allium Use Adjusted Metrics To Filter Stablecoin Activity | Raw Transfer Volume Can Overstate Real Economic Use |
The largest risk is not a peg event. It is concentration. USDT dominates issuer share. Tron is almost entirely USDT-driven. Ethereum and Tron together still carry most stablecoin settlement. That structure works while the dominant rails are liquid and functioning, but it leaves the market exposed to issuer, chain, banking, and policy shocks.
Key Findings
- Total stablecoin market cap stood at $311.4 billion, down $1.46 billion over seven days and 1.59% over 30 days.
- USDT remained the largest stablecoin at $184.1 billion, with 59.12% dominance.
- USDC fell to $73.0 billion, down 1.04% over seven days and 3.40% over 30 days.
- USDT and USDC together represented roughly 82.6% of tracked stablecoin supply.
- Ethereum and Tron together held roughly 78% of chain-level stablecoin liquidity.
- Solana, Hyperliquid L1, Base, Polygon, Aptos, and X Layer posted positive weekly stablecoin growth while Ethereum and Tron declined.
- Stablecoin Beat’s narrower tracker showed $302.3 billion in market cap as of July 05 and a 1.6% contraction over 90 days, confirming the broader cooling pattern.
What To Watch Next
The first watch item is whether USDC stabilizes. A regulated-dollar rail can have strong transparency and still lose supply if institutional users are redeeming or rotating into off-chain cash. A return to weekly USDC growth would be a cleaner signal than isolated inflows into smaller stablecoins.
The second watch item is Ethereum versus Tron. If both continue to contract while smaller chains grow, the market is shifting liquidity to application-specific venues rather than expanding system-wide cash.
The third watch item is tokenized cash. USYC, BUIDL, and USDY remain relevant because they compete for the same treasury attention as stablecoins, even when their use case is different. If tokenized cash keeps growing while payment stablecoins contract, the market is choosing yield and institutional structure over pure settlement utility.
The fourth watch item is Base and Hyperliquid. Both gained stablecoin supply this week. If that continues, it would show that product-specific liquidity loops are strong enough to attract dollars even in a flat or shrinking market.
BitBullNews View
Stablecoin liquidity is still deep. It is not expanding.
That distinction matters. A market with more than $311 billion in stablecoin supply is not liquidity-starved. But a market where USDT, USDC, Ethereum, and Tron all decline over the week is not showing broad new dollar demand either. The stablecoin base is large, useful, and institutionally important. It is also sending a cautious signal.
The best interpretation is selective consolidation. Core liquidity is cooling. Smaller venues with specific use cases are still gaining. Tokenized cash products continue to blur the line between stablecoins and on-chain treasury management.
For traders, the message is caution: do not assume fresh stablecoin supply will support every rebound.
For investors, the message is quality: issuer structure, redemption rights, and reserve transparency matter more as growth slows.
For policymakers, the message is concentration: stablecoins are already large enough that issuer rules, reserve rules, and chain-level operational risk are market-structure issues, not crypto side notes.
Data Sources & References
- DefiLlama Stablecoins Market Cap, Supply, Peg Data, And Issuer Rankings.
- DefiLlama Stablecoins By Chain Dashboard.
- Stablecoin Beat Market Cap Charts, Updated July 05, 2026.
- Visa Onchain Analytics Dashboard, Developed With Allium Labs.
- Tether Q1 2026 Reserve Attestation And Reserve Buffer Disclosure.
- Circle Transparency And USDC Reserve Disclosure Process.
- Circle USDC Reserve Structure And Circle Reserve Fund Description.
- BNY USDC Digital-Asset Platform Expansion Report.