


BitBullNews Derivatives Market Structure Monitor – July 01 – July 07: Leverage Rebuilds


Content
Crypto derivatives moved from forced de-risking to cautious leverage rebuild during the July 01 – July 08, 2026 reporting window.

Bitcoin closed at $62,247 on July 08, up from $59,968 on July 01, while Ether closed at $1,742.15, up from $1,608.34 over the same period. That puts BTC up roughly 3.8% and ETH up roughly 8.3% during the week. The rebound was real, but it did not come with a clean risk-on structure. BTC still sold off on July 08 as broader macro risk hit markets, and ETH followed lower intraday.
The futures market stayed deep. CoinGlass showed BTC futures open interest at $45.89 billion, with $49.77 billion in 24-hour futures volume and $4.55 billion in spot volume. ETH futures open interest stood at $23.76 billion, with $30.62 billion in 24-hour futures volume and $1.70 billion in spot volume. That means futures turnover remained roughly 11x spot volume for BTC and 18x spot volume for ETH in the captured CoinGlass snapshot.
Options risk stayed concentrated on Deribit. CoinGlass’s Deribit options page showed 371,555 BTC in total BTC options open interest, equal to $23.33 billion in notional value. Calls accounted for 238,840.97 BTC, puts for 132,714.23 BTC, and the open-interest put/call ratio stood at 0.36. The call-heavy structure remains intact, but the market is not euphoric. It is rebuilding leverage after a violent June reset.
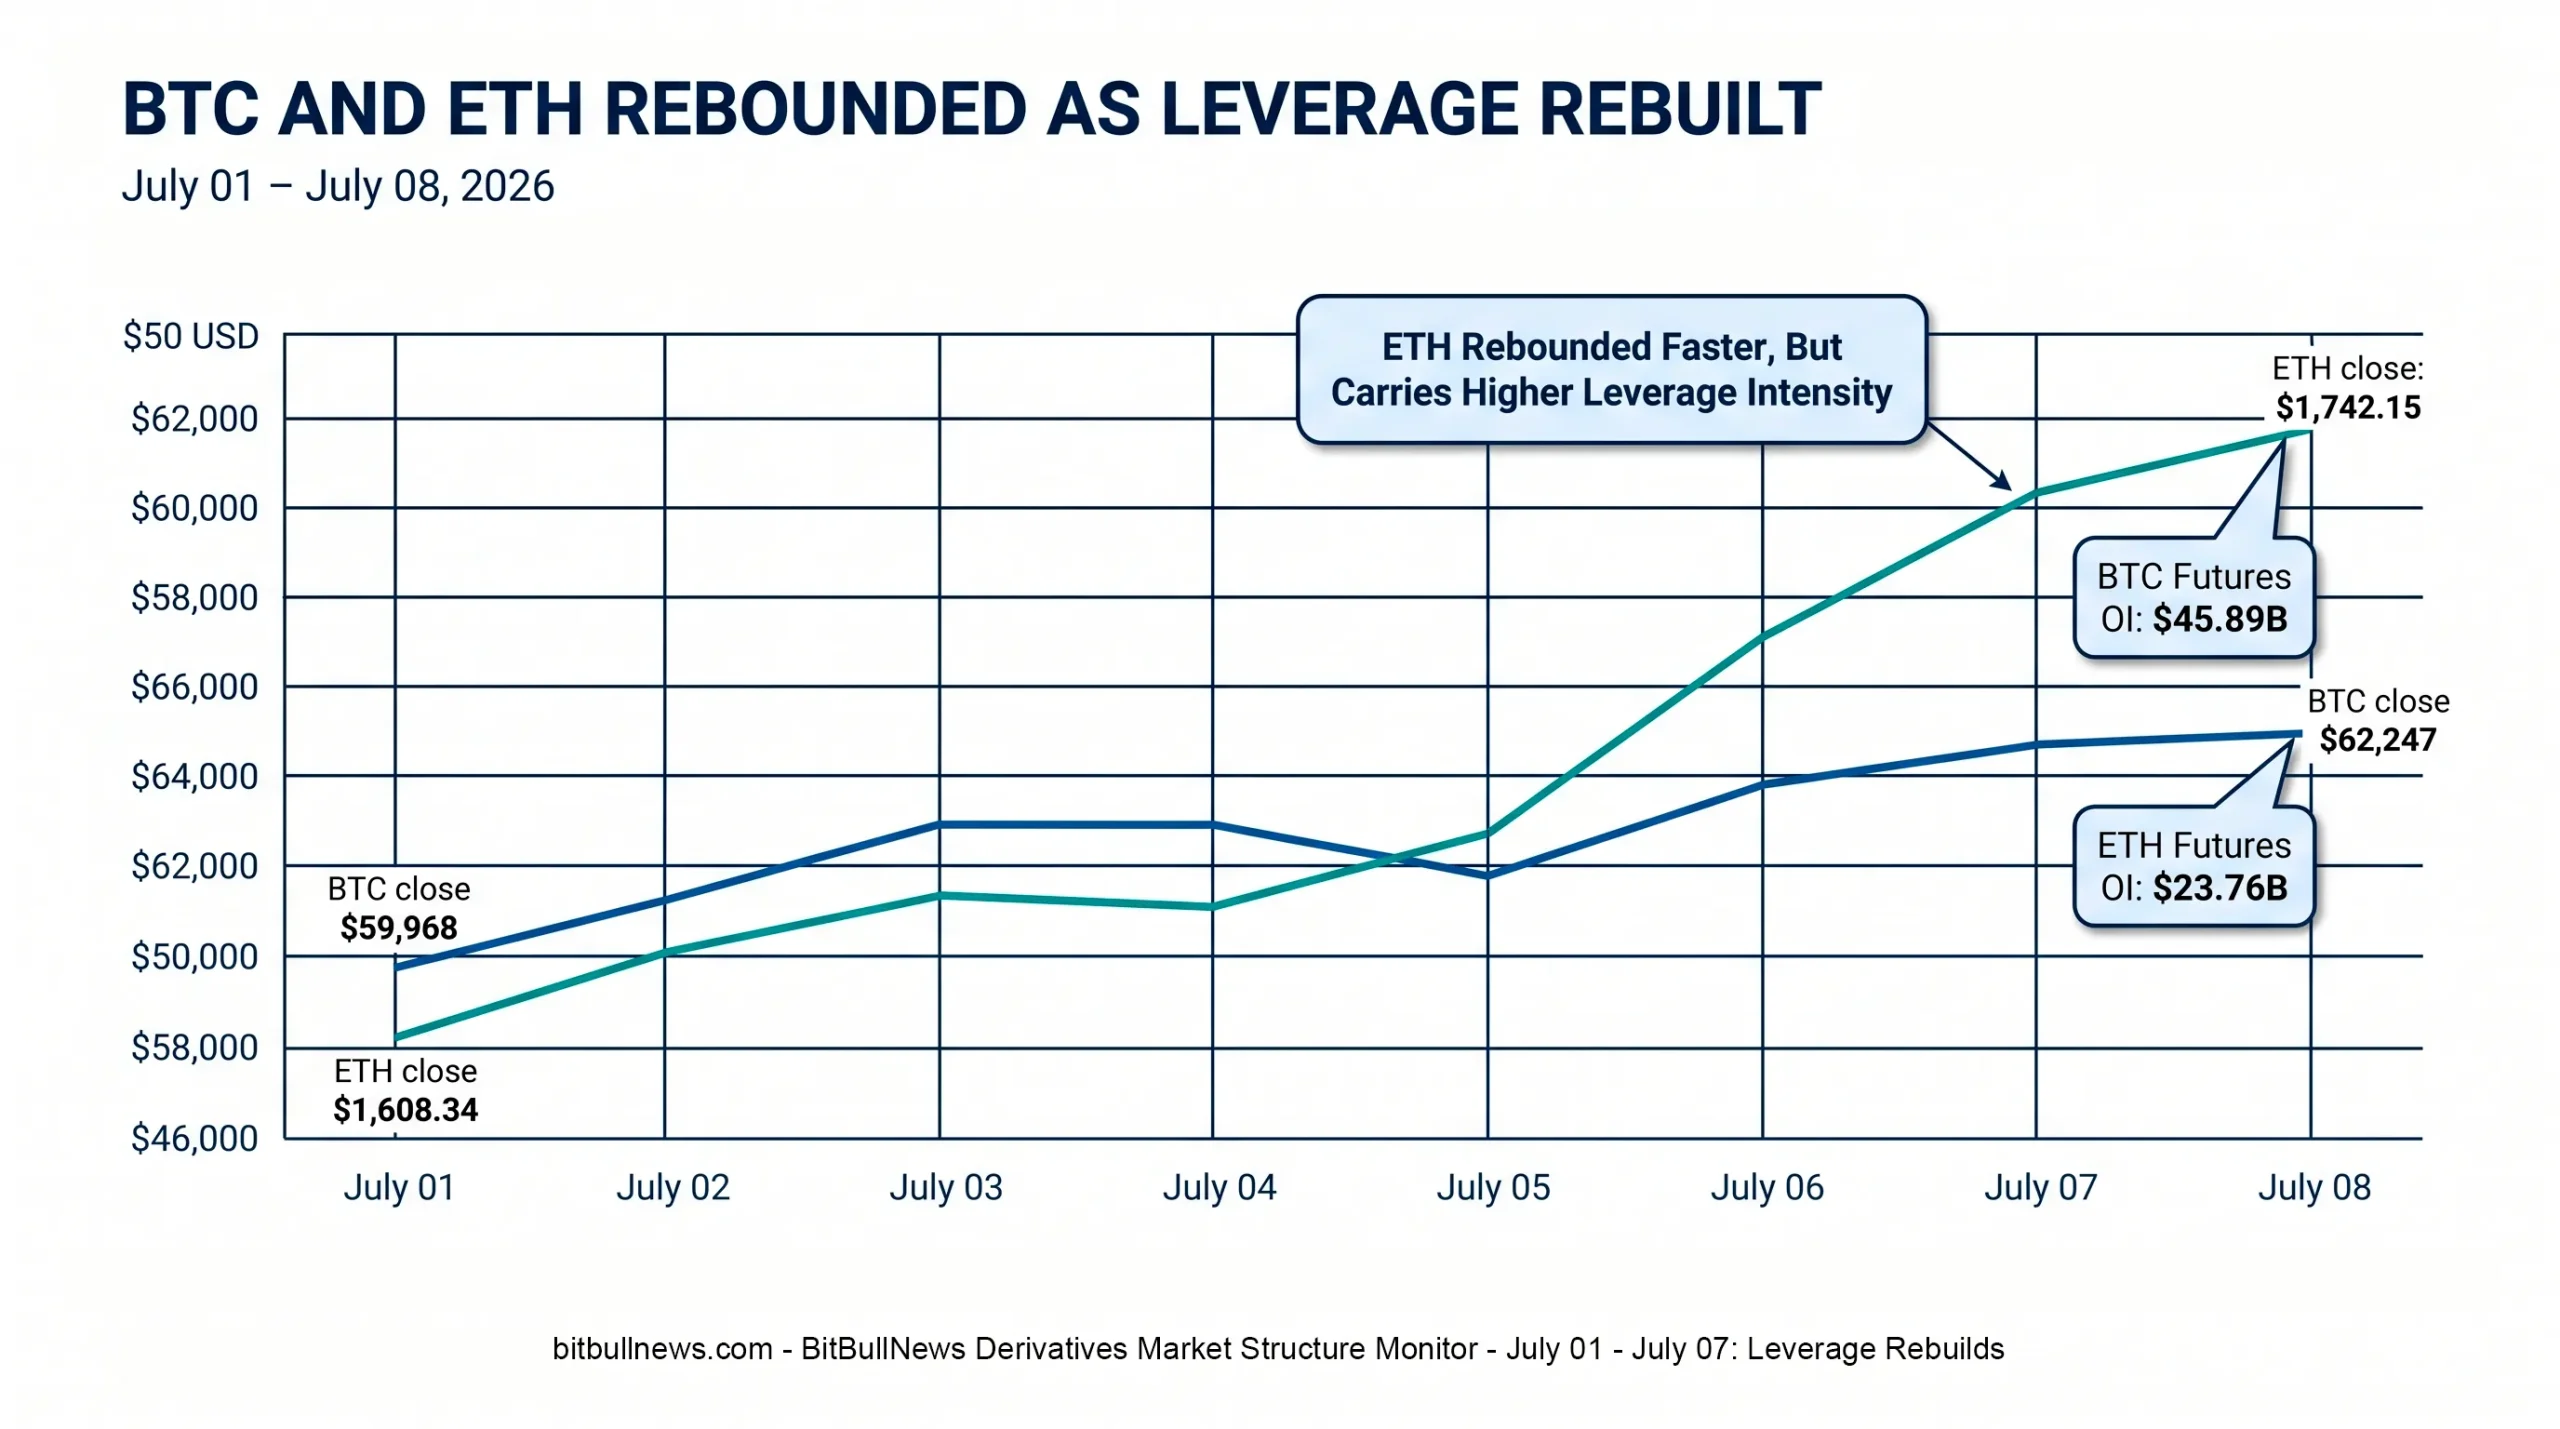
Chart: Line And Bar Combo Showing BTC And ETH Closing Prices From July 01 To July 08, With Current Futures Open Interest Markers: BTC $45.89B And ETH $23.76B. Highlight ETH’s Stronger Weekly Rebound And Higher OI-To-Market-Cap Ratio.
Market Structure Snapshot
| Metric | Latest Public Reading | Market Read |
|---|---|---|
| BTC Close, July 08 | $62,247 | Recovered From July 01 But Still Fragile |
| ETH Close, July 08 | $1,742.15 | Stronger Weekly Rebound Than BTC |
| BTC Futures Open Interest | $45.89B | Leverage Remains Deep |
| ETH Futures Open Interest | $23.76B | High Leverage Relative To ETH Market Cap |
| BTC Futures Volume / Spot Volume | ~10.9x | Derivatives Still Dominate BTC Turnover |
| ETH Futures Volume / Spot Volume | ~18.0x | ETH Trading Is Even More Derivatives-Heavy |
| Deribit BTC Options OI | $23.33B | Options Risk Remains Highly Concentrated |
| CME BTC Futures OI | 18,763 Contracts | Regulated Futures Exposure Stayed Material |
The market structure is not weak. It is leveraged, liquid, and uneven.
BTC is still the anchor for institutional derivatives exposure, especially through CME and Deribit. ETH is smaller in absolute dollar terms, but it carries a heavier derivatives footprint relative to its market cap. CoinGlass showed BTC market cap near $1.25 trillion and ETH market cap near $210.37 billion. Based on the same CoinGlass snapshot, BTC futures open interest was roughly 3.7% of market cap, while ETH futures open interest was roughly 11.3%.
That gap matters. ETH can move faster when positioning shifts because the futures stack is large relative to the underlying market. A strong ETH rebound can pull in leverage quickly; a downside break can force it out just as fast.
BTC And ETH: Spot Recovered, But Leverage Did Not Reset Fully
The week’s price action looks constructive at first glance. BTC moved from $59,968 on July 01 to $62,247 on July 08. ETH moved from $1,608.34 to $1,742.15. Both assets recovered from the late-June washout, and ETH led the rebound.
| Asset | July 01 Close | July 08 Close | Weekly Change | Futures OI | OI / Market Cap |
|---|---|---|---|---|---|
| BTC | $59,968 | $62,247 | +3.8% | $45.89B | ~3.7% |
| ETH | $1,608.34 | $1,742.15 | +8.3% | $23.76B | ~11.3% |
The stronger ETH rebound does not automatically mean stronger market quality. ETH’s open-interest-to-market-cap ratio remains far higher than BTC’s. That makes ETH more sensitive to liquidation clusters, funding shifts, and exchange-specific positioning.
BTC remains the cleaner institutional benchmark. Its derivatives market is larger, more distributed across regulated and offshore venues, and more directly connected to ETF and CME basis flows. ETH remains a higher-beta derivatives market.
Futures Turnover Is Still Running The Tape
The futures market still dominates active crypto trading.
CoinGlass showed BTC 24-hour futures volume of $49.77 billion versus spot volume of $4.55 billion. ETH showed $30.62 billion in futures volume versus $1.70 billion in spot volume. This is not unusual for crypto, but it matters more during a rebound because price discovery can become leverage-led rather than spot-led.
| Asset | Futures Volume | Spot Volume | Futures / Spot Ratio | Read |
|---|---|---|---|---|
| BTC | $49.77B | $4.55B | ~10.9x | Futures Continue To Lead Execution |
| ETH | $30.62B | $1.70B | ~18.0x | ETH Rebound Is More Derivatives-Driven |
| BTC Futures OI | $45.89B | N/A | N/A | Positioning Stayed Large |
| ETH Futures OI | $23.76B | N/A | N/A | High Leverage Intensity |
The clean bullish version of this setup would be rising spot volume, controlled funding, and open interest expanding gradually. The riskier version is futures volume leading spot while open interest rebuilds into a macro-sensitive market. The current structure sits closer to the second version.
CME: Regulated Participation Stayed Active, But Not Aggressive
CME’s Bitcoin futures data shows institutional participation remained present, but not aggressively expanding.
For trade date July 08, 2026, CME reported 8,223 total Bitcoin futures contracts traded and 18,763 contracts of open interest, with open interest down 69 contracts at the close. The July 2026 contract accounted for 7,468 contracts of volume and 15,381 contracts of open interest, while August 2026 had 745 contracts of volume and 2,871 contracts of open interest.
| CME BTC Futures Contract | Volume | Open Interest | OI Change | Read |
|---|---|---|---|---|
| Total BTC Futures | 8,223 | 18,763 | -69 | Regulated Exposure Stable, Slightly Lower |
| July 2026 | 7,468 | 15,381 | -296 | Front-Month Still Dominates |
| August 2026 | 745 | 2,871 | +229 | Some Positioning Rolling Forward |
| September 2026 | 10 | 326 | -2 | Limited Activity |
The key signal is the roll. July open interest fell while August open interest rose. That is normal around contract management, but it also means CME exposure was not simply disappearing. Some risk moved forward on the curve.
CME’s value to this monitor is not that it always leads price. It shows how regulated desks are holding or adjusting exposure. Offshore venues still set much of the high-frequency leverage pulse, but CME remains the institutional read-through.
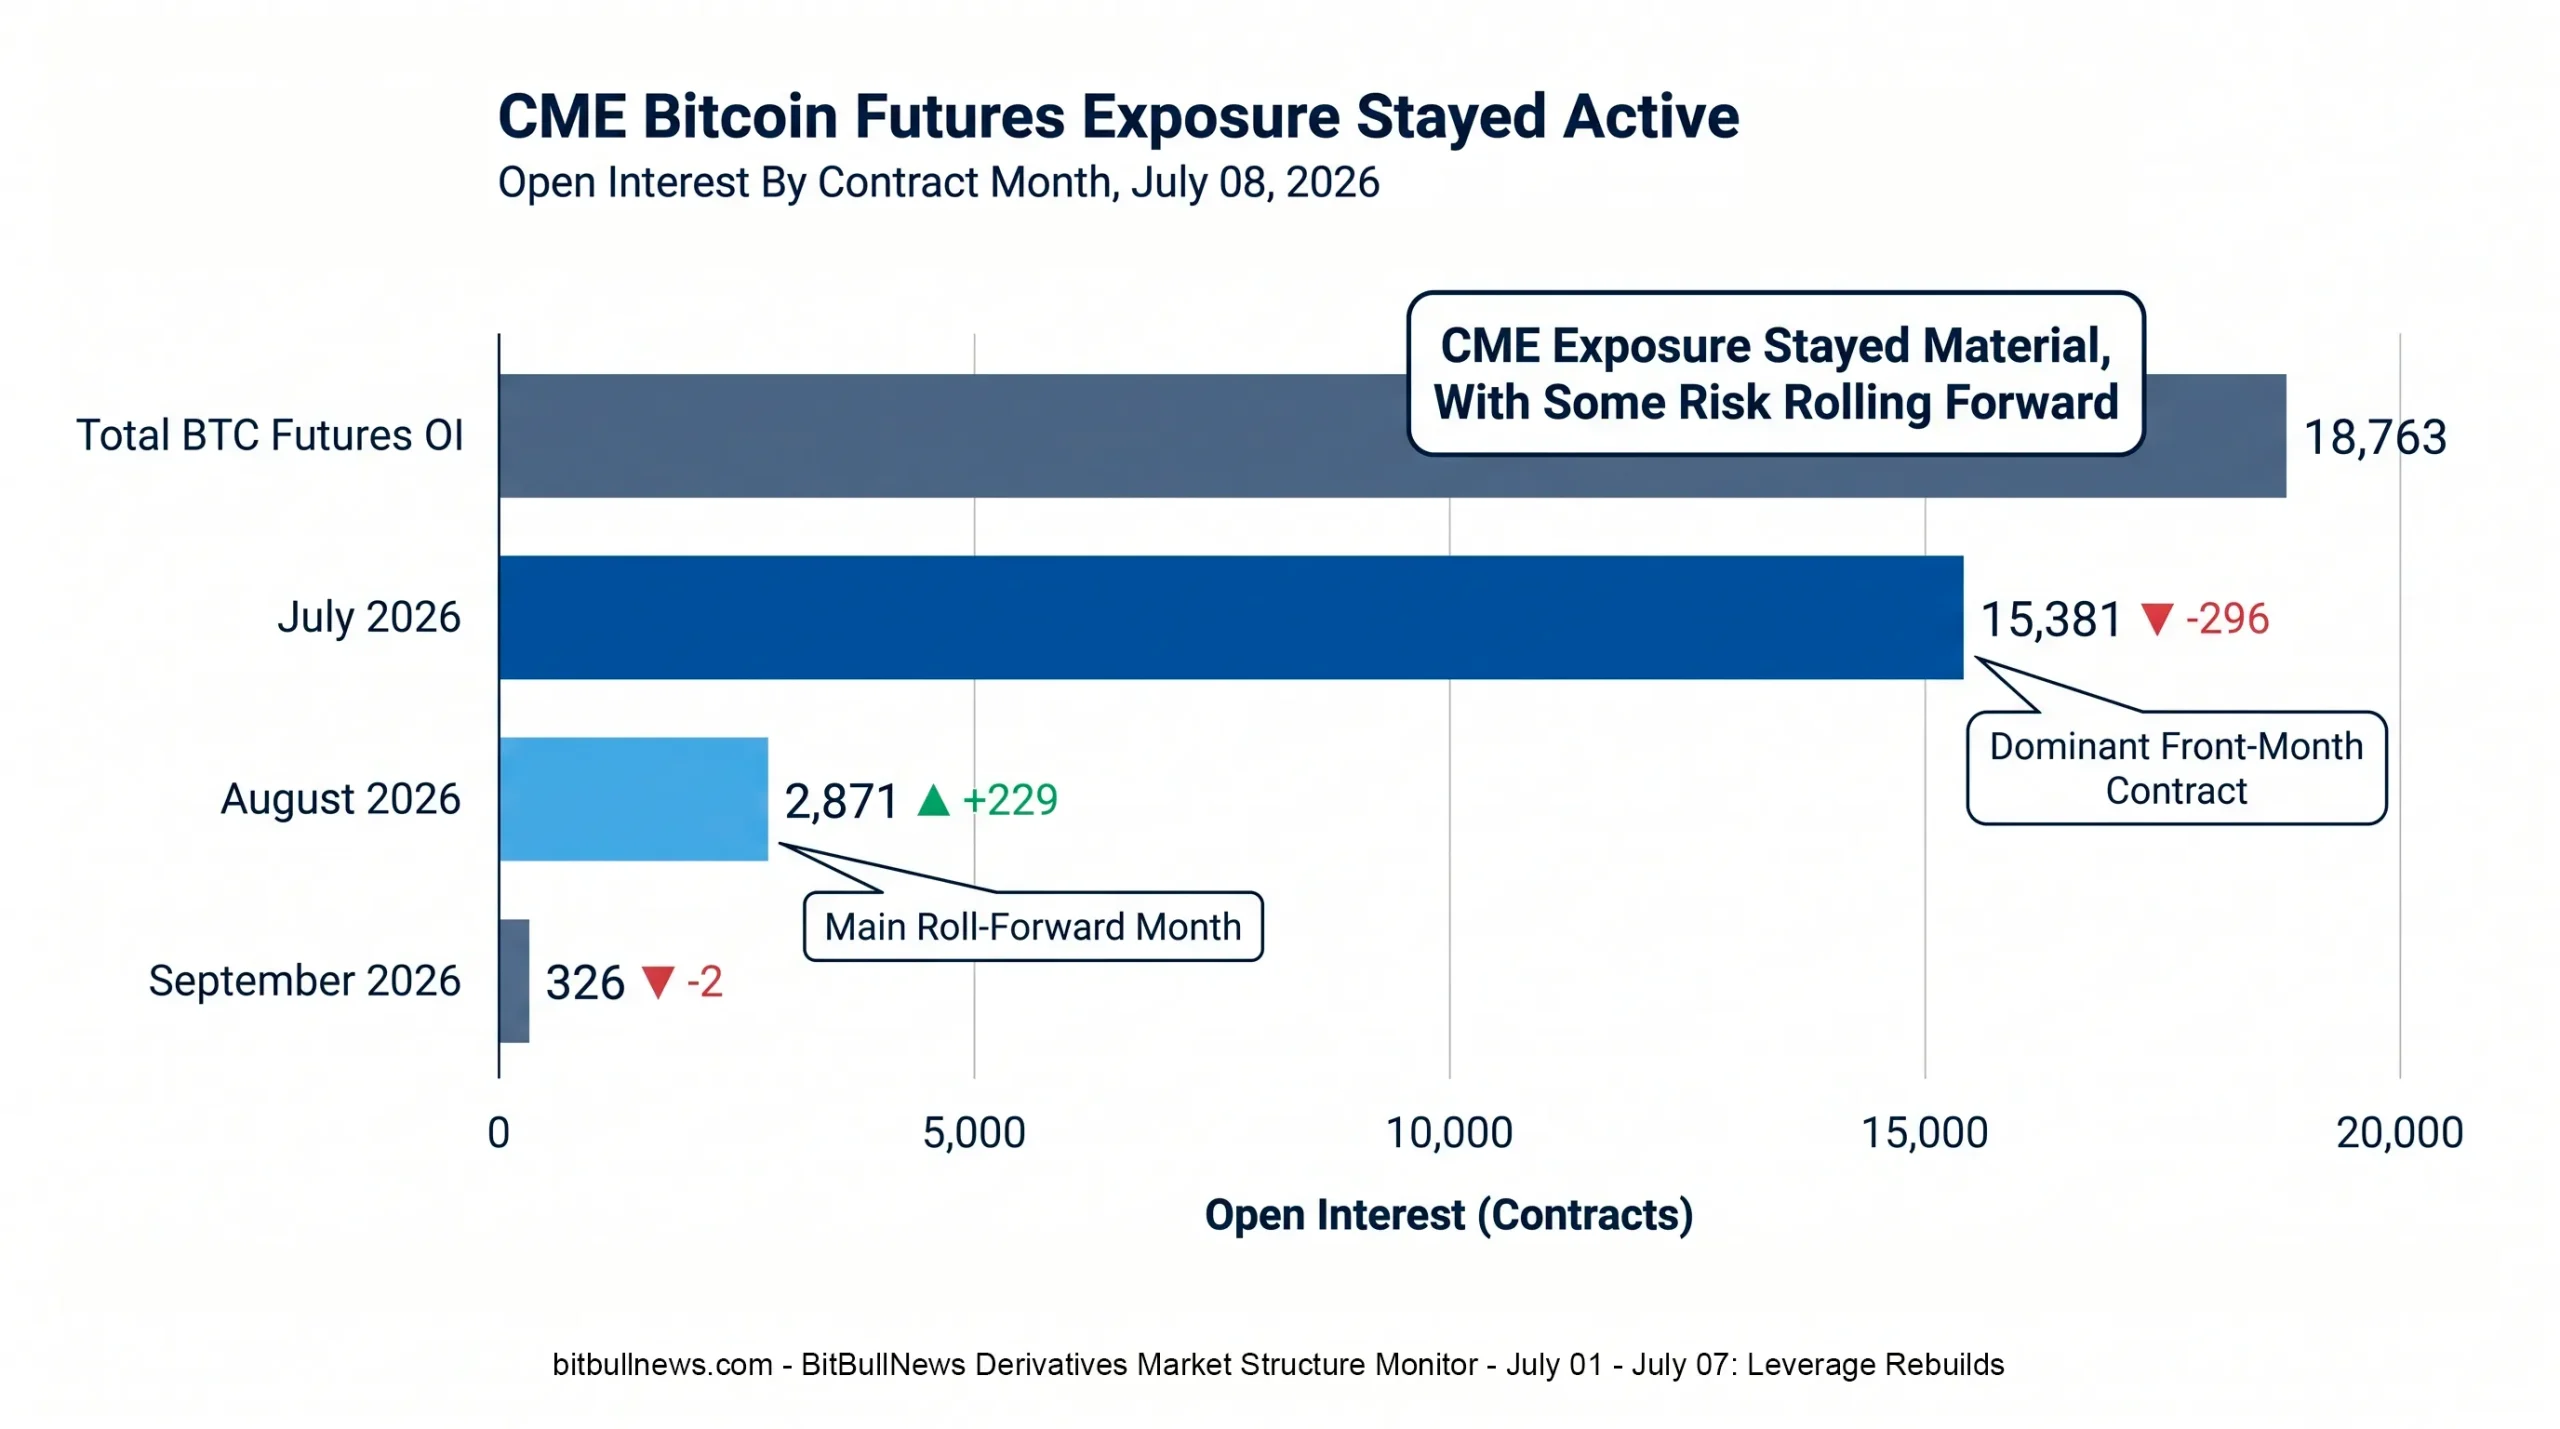
Chart: Horizontal Bar Chart Showing CME BTC Futures Open Interest By Contract Month. Highlight July 2026 And August 2026, With OI Change Labels: July -296, August +229.
CME Positioning: Asset Managers Long, Leveraged Funds Short
The latest CFTC-linked CME BTC positioning snapshot, dated June 30, 2026, still showed the familiar split between asset managers and leveraged funds.
CoinGlass reported asset managers at 4,754 long contracts, 2,754 short contracts, and 275 spreads. Leveraged funds held 5,408 long contracts, 10,721 short contracts, and 436 spreads. Dealers were long 6,260 contracts and short 1,735 contracts.
| Trader Category | Long Contracts | Short Contracts | Net Long / Short | Market Read |
|---|---|---|---|---|
| Dealers | 6,260 | 1,735 | +4,525 | Intermediation And Hedging Bias |
| Asset Managers | 4,754 | 2,754 | +2,000 | Structural Long Exposure |
| Leveraged Funds | 5,408 | 10,721 | -5,313 | Basis / Hedge / Short Bias |
| Other Reportables | 145 | 1,123 | -978 | Smaller Net Short |
The leveraged-fund short should not be read as pure bearishness. In BTC futures, leveraged funds often short futures against spot, ETF, or basis trades. The useful point is structural: regulated Bitcoin exposure is split between long-only or long-biased asset managers and short-biased leveraged funds. That structure can absorb spot demand, but it can also create squeeze risk if basis trades are forced to unwind.
Options: Deribit Still Owns The BTC Volatility Stack
Deribit remains the main venue for BTC options risk.
CoinGlass’s Deribit options data showed 238,840.97 BTC in call open interest and 132,714.23 BTC in put open interest. In notional terms, calls represented $15.00 billion, puts represented $8.33 billion, and total BTC options open interest was $23.33 billion. The open-interest put/call ratio stood at 0.36.
| Deribit BTC Options Metric | Reading | Market Read |
|---|---|---|
| Call Open Interest | 238,840.97 BTC / $15.00B | Upside Structures Still Dominate |
| Put Open Interest | 132,714.23 BTC / $8.33B | Downside Protection Remains Material |
| Total Open Interest | 371,555.20 BTC / $23.33B | Deribit Is Still The Core BTC Options Venue |
| Open Interest Put / Call Ratio | 0.36 | Call-Heavy Positioning |
| 24H Call Volume | 7,906.4 BTC | Calls Led Volume |
| 24H Put Volume | 5,832.18 BTC | Put Demand Still Active |
| 24H Volume Put / Call Ratio | 0.58 | Volume Less Bullish Than OI |
The split between open interest and volume matters. Open interest is heavily call-skewed, but the 24-hour volume put/call ratio of 0.58 is less one-sided. That suggests traders still hold upside exposure, but they are actively using puts around shorter-term risk.
The market is not positioned like a panic hedge. It is positioned like a rebound with protection.
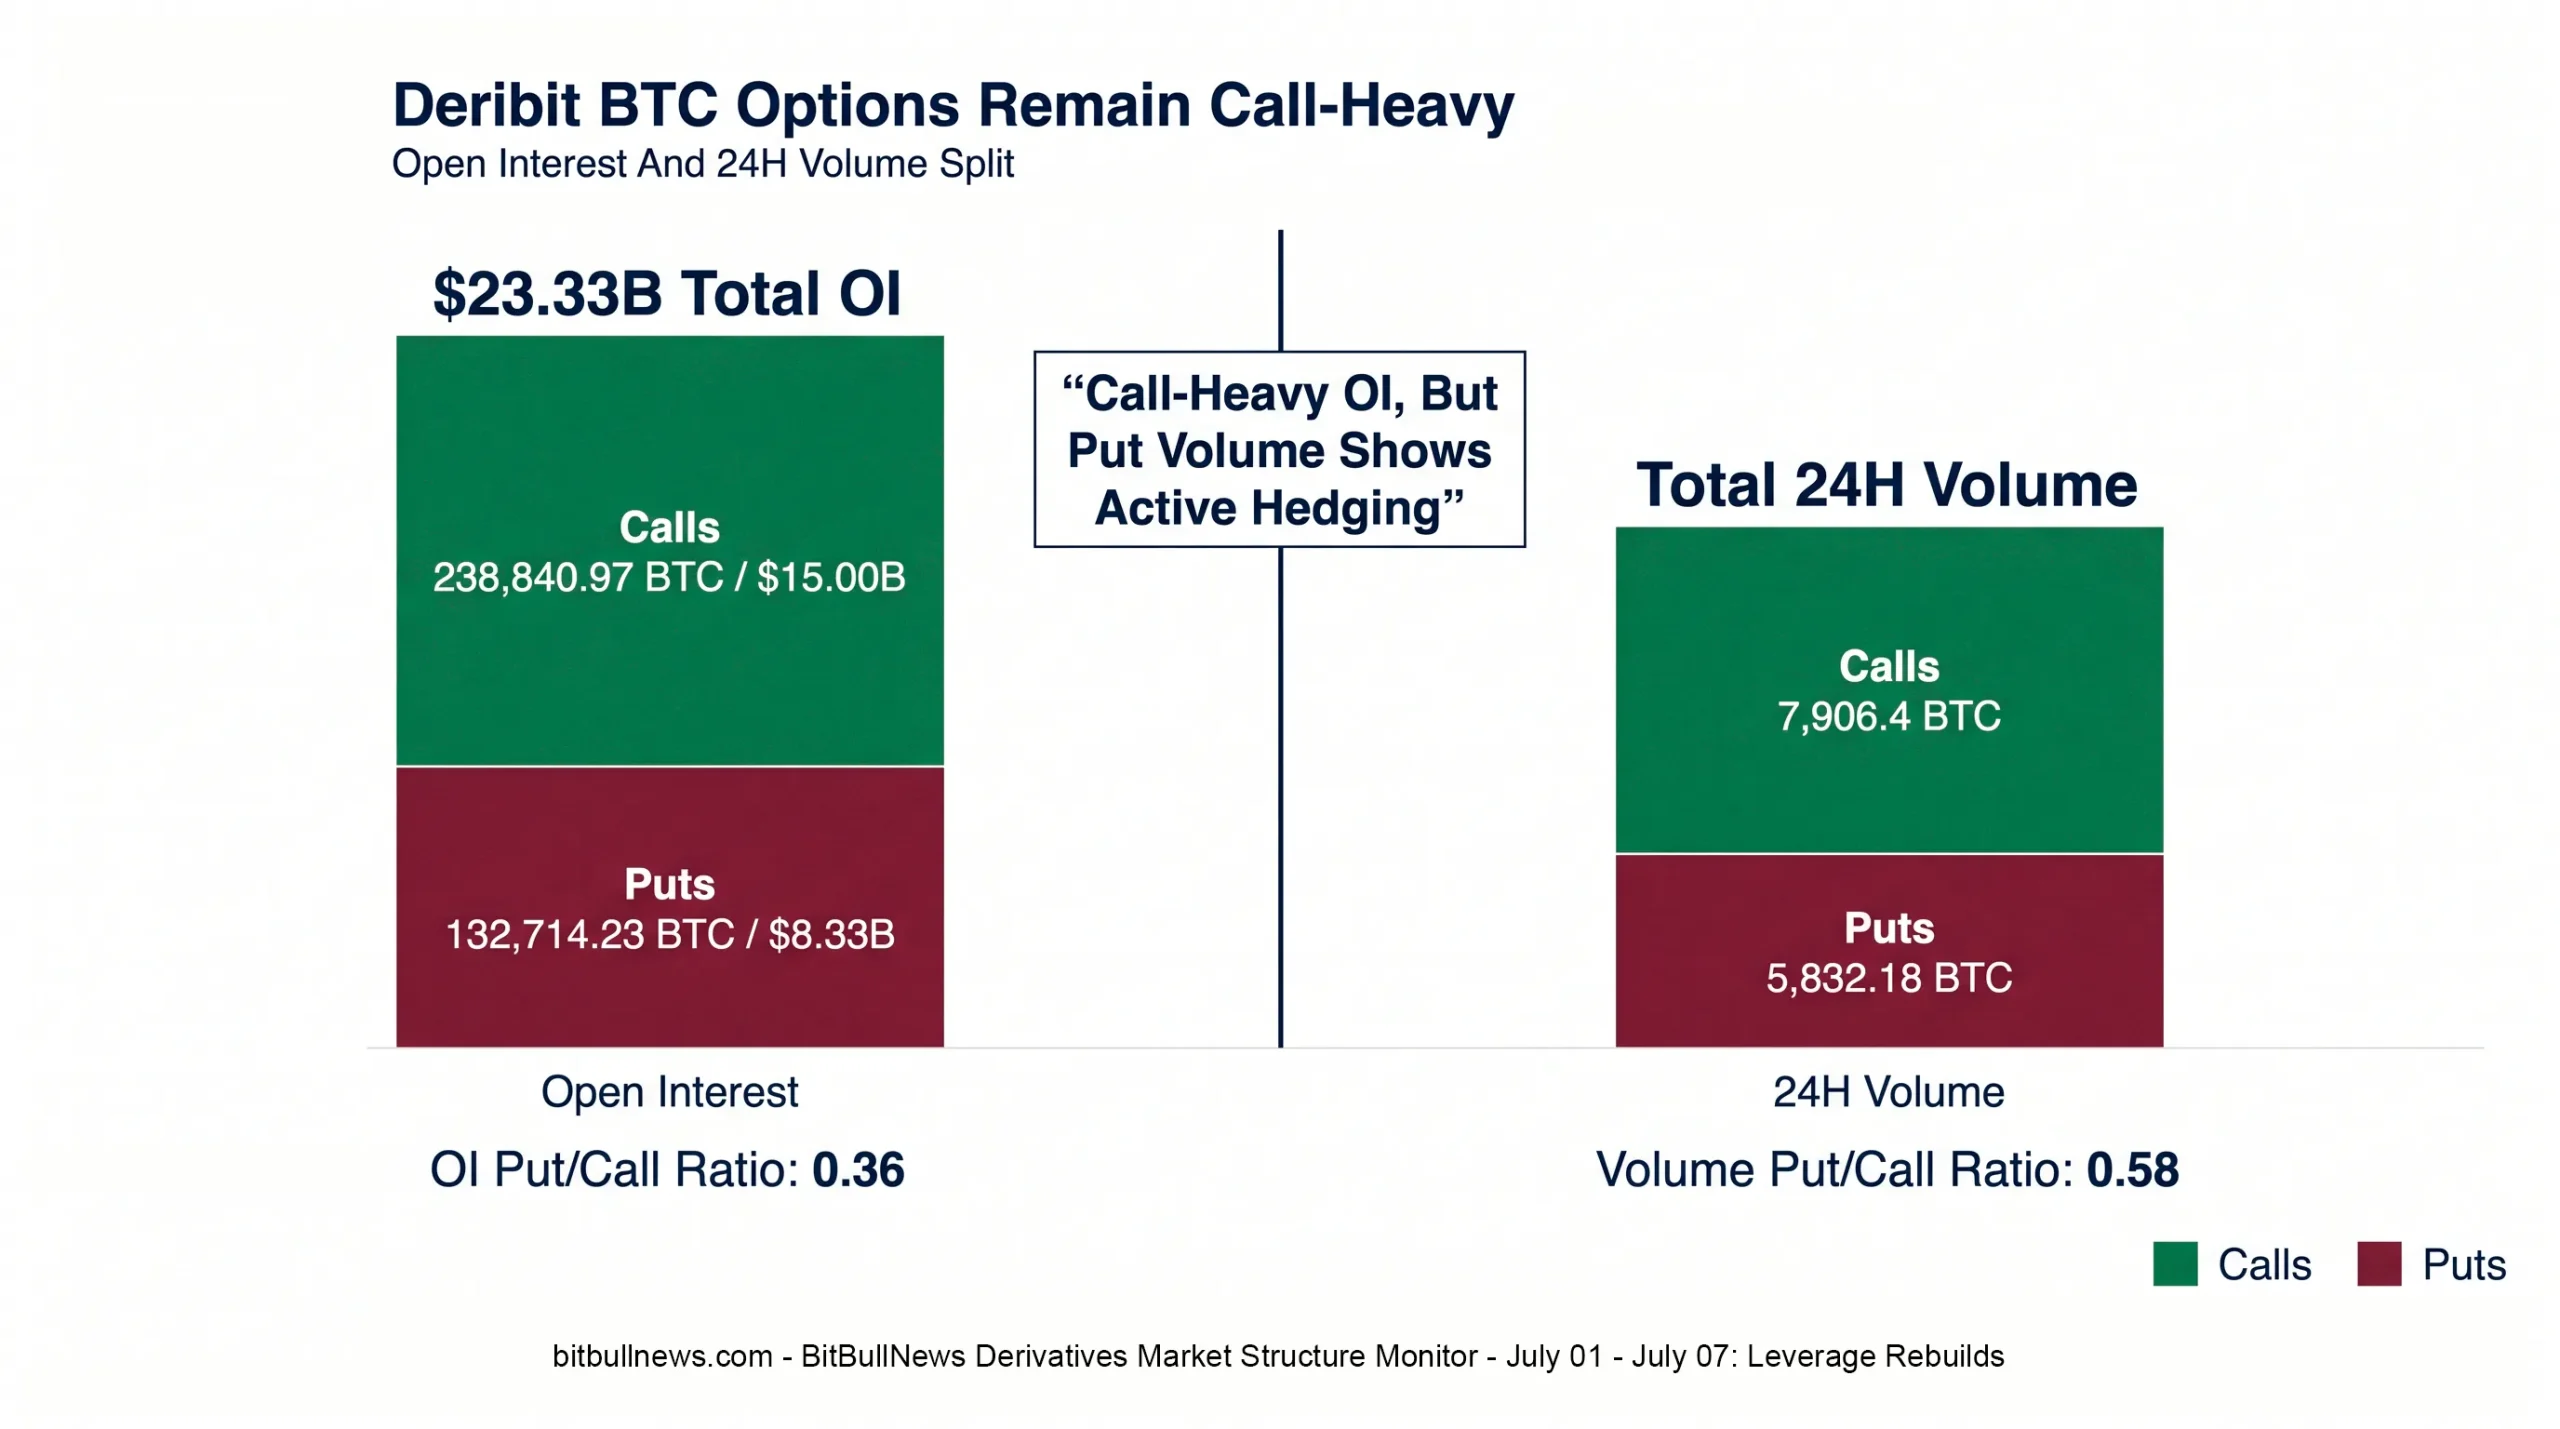
Chart: Stacked Bar Chart Showing Deribit BTC Options Open Interest By Calls And Puts, With A Second Smaller Bar Showing 24H Volume Split. Label OI Put/Call Ratio 0.36 And Volume Put/Call Ratio 0.58.
Liquidations: Stress Is Still Long-Skewed
Liquidation data stayed important because the week included both rebound attempts and fresh macro-driven selling.
A CoinPerps liquidation snapshot showed $263.81 million in 24-hour liquidations across covered crypto markets, with $192.15 million from longs and $71.66 million from shorts. Its exchange table showed Binance accounting for $124.03 million of liquidations, Hyperliquid for $42.79 million, OKX for $31.45 million, and Bybit for $22.00 million.
| Liquidation Metric | Reading | Market Read |
|---|---|---|
| Total 24H Liquidations | $263.81M | Stress Still Visible |
| Long Liquidations | $192.15M | Longs Took Most Of The Damage |
| Short Liquidations | $71.66M | Shorts Were Less Exposed |
| Long Share | ~72.8% | Downside Moves Still Punished Long Leverage |
| Binance Liquidations | $124.03M | Largest Venue Share In Snapshot |
| Hyperliquid Liquidations | $42.79M | Perp-Native Risk Still Material |
This is the weak spot in the rebound. A healthier trend would show rising spot, controlled OI, and smaller liquidation spikes. Instead, the market is still punishing long leverage during risk-off moves.
What The Market Structure Actually Says
The derivatives market is giving four signals.
First, leverage is rebuilding. BTC and ETH recovered during the reporting window, and futures open interest remained large. That makes the market tradable, but also more vulnerable to forced moves if spot momentum fades.
Second, ETH carries more leverage intensity than BTC. ETH’s futures OI is smaller in dollar terms, but much larger relative to market cap. That makes ETH the more fragile structure if risk reverses.
Third, options remain call-heavy, but not blindly bullish. Deribit BTC calls dominate open interest, while put volume remains active enough to show hedging demand.
Fourth, CME is stable rather than aggressive. Open interest dipped slightly on July 08, but the contract-month roll shows regulated exposure moving forward rather than vanishing.
Actionable Signals For Traders, Investors, And Risk Teams
| Audience | Signal To Watch | Why It Matters |
|---|---|---|
| Traders | BTC And ETH Futures OI Versus Spot Volume | A Leverage-Led Rally Is Easier To Reverse |
| Market Makers | Deribit Put/Call Volume Ratio | Rising Put Volume Would Confirm Heavier Downside Hedging |
| Institutional Investors | CME Front-Month Roll And OI Change | Shows Whether Regulated Desks Are Maintaining Exposure |
| Risk Teams | ETH OI / Market Cap | ETH Is More Sensitive To Liquidation Cascades |
| DeFi And Perp Desks | Long Liquidation Share | Long-Skewed Liquidations Signal Weak Rebound Quality |
For traders, the key setup is not trend-following by default. It is leverage monitoring. If BTC holds above the July 01 close while OI rises gradually, the rebound can mature. If OI jumps faster than spot and funding heats up, the market becomes vulnerable again.
For investors, CME positioning and options skew matter more than short-term price. Asset-manager long exposure remains constructive, but leveraged-fund shorts and call-heavy options positioning keep the market complex.
For risk teams, ETH deserves tighter monitoring. Its rebound was stronger, but its leverage ratio is heavier.
Key Findings
- BTC closed at $62,247 on July 08, up from $59,968 on July 01.
- ETH closed at $1,742.15 on July 08, up from $1,608.34 on July 01.
- CoinGlass showed BTC futures open interest at $45.89 billion, with $49.77 billion in 24-hour futures volume.
- CoinGlass showed ETH futures open interest at $23.76 billion, with $30.62 billion in 24-hour futures volume.
- CME reported 8,223 BTC futures contracts traded and 18,763 contracts of open interest on trade date July 08, 2026.
- Deribit BTC options open interest stood at 371,555.20 BTC, or $23.33 billion, with a 0.36 open-interest put/call ratio.
- CoinPerps showed $263.81 million in 24-hour crypto liquidations, with longs accounting for roughly 73% of the total.
What To Watch Next
The first watch item is BTC OI versus price. If BTC futures open interest rises while BTC stays capped near the low-$60,000 range, leverage is rebuilding without enough spot confirmation.
The second watch item is ETH’s leverage ratio. ETH has a stronger weekly price rebound, but its futures open interest remains heavy relative to market cap. That is supportive in an uptrend and dangerous in a reversal.
The third watch item is Deribit put volume. Open interest is still call-heavy, but daily put activity can reveal whether traders are quietly buying protection.
The fourth watch item is CME roll behavior. A clean roll from July into August with stable total open interest would suggest regulated desks are maintaining exposure. A broader OI drop would point to institutional de-risking.
BitBullNews View
The derivatives market is healthier than it was at the end of June, but it is not clean.
BTC and ETH both recovered. Futures liquidity stayed deep. CME exposure did not vanish. Deribit options still show a strong upside stack. Those are constructive signals.
The problem is quality. Futures volume still dominates spot turnover. ETH carries a large open-interest load relative to market cap. Long liquidations still account for most forced selling. Options open interest is bullish on the surface, but put volume says traders are not ignoring downside risk.
This is a leverage rebuild, not a confirmed risk-on cycle.
Data Sources & References
- CoinGlass — Bitcoin Futures Market Data, Open Interest, Volume, Spot Volume, And Market Cap
- CoinGlass — Ethereum Futures Market Data, Open Interest, Volume, Spot Volume, And Market Cap
- CME Group — Bitcoin Futures Volume And Open Interest
- CoinGlass — Deribit Options Data, BTC Calls, Puts, Open Interest, Volume, And Put/Call Ratio
- CoinGlass — CME Bitcoin Futures Long/Short Report And CFTC Position Data
- CFTC — Commitments Of Traders Report Index
- CoinGecko — Bitcoin Historical Market Data
- CoinGecko — Ethereum Historical Market Data
- CoinPerps — Crypto Liquidations Tracker
- Barron’s — Bitcoin Falls On Speculation On Cycle Bottom