



Content
Crypto derivatives are still doing the heavy lifting for market liquidity, but the tape is no longer cleanly bullish.
As of July 1, 2026, CoinGlass showed total crypto futures open interest at $102.59 billion, up 0.64% over 24 hours, while 24-hour futures volume stood at $168.74 billion, down 4.38%. Liquidations rose to $383.72 million, up 33.84%, with the long/short split nearly flat at 48.96% long versus 51.04% short. That is not a panic reading. It is a leverage market trying to stabilize after a sharp spot drawdown.
Bitcoin remains the center of gravity. CoinGlass showed BTC futures open interest around $44.46 billion, BTC options open interest around $25.04 billion, and 24-hour BTC liquidations at $173.21 million, of which $140.67 million came from long positions. Ether showed a smaller but still material structure: $21.80 billion in futures open interest, $3.54 billion in options open interest, and $74.36 million in 24-hour liquidations.
The key signal is not just lower price. It is leverage staying active while spot momentum weakens. CoinGecko’s historical data shows Bitcoin closed at $58,573 on June 30, down from $66,292 on June 15. Ether closed at $1,570.07 on June 30, down from $1,795.04 on June 15. That two-week price reset did not clear the derivatives market; it shifted the market into a more defensive structure.
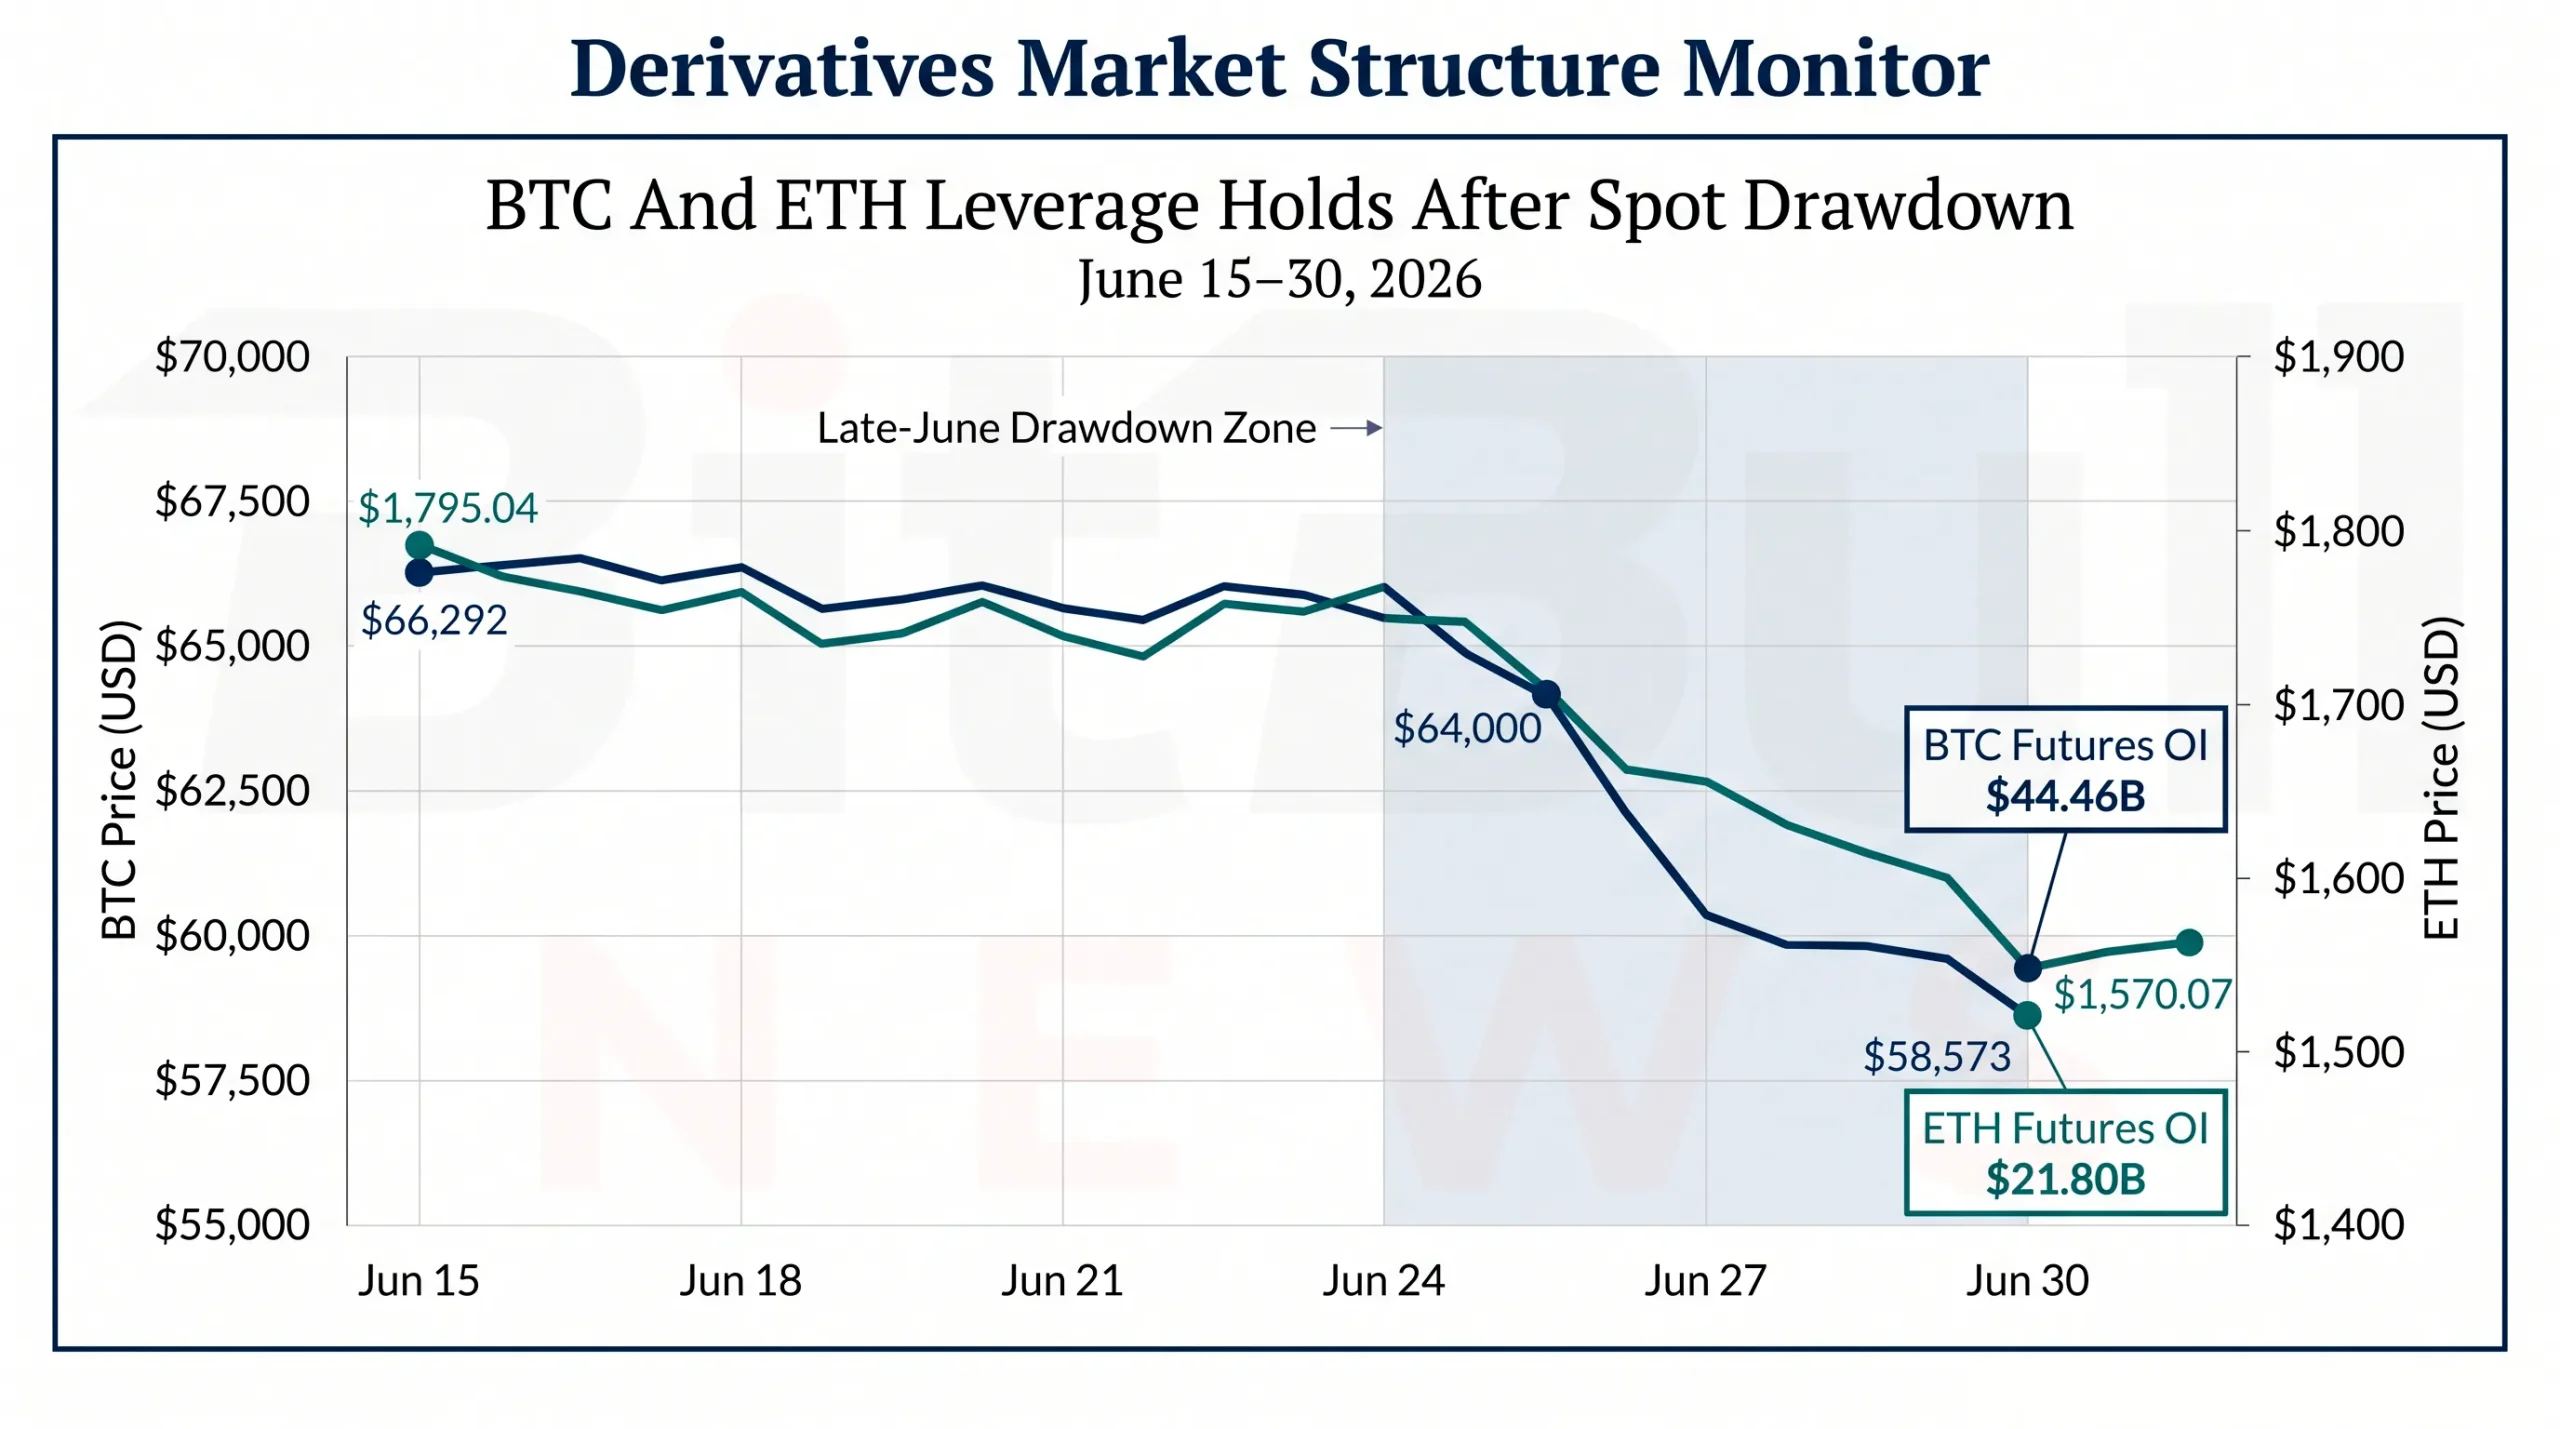
Chart: Dual-Axis Line Chart Showing BTC And ETH Spot Price From June 15 To June 30, Overlaid With Current Futures Open Interest For BTC And ETH. Highlight The Price Drawdown And Label Current OI: BTC $44.46B, ETH $21.80B.
Market Structure Snapshot
| Metric | Latest Reading | 24H Change | Market Read |
|---|---|---|---|
| Total Crypto Futures Open Interest | $102.59B | +0.64% | Leverage Remains Active |
| Total Crypto Futures Volume | $168.74B | -4.38% | Trading Activity Slowed |
| Total 24H Liquidations | $383.72M | +33.84% | Forced De-Risking Increased |
| Market Long / Short Split | 48.96% / 51.04% | N/A | Positioning Is Close To Neutral |
| BTC Futures Open Interest | $44.46B | +2.14% | BTC Leverage Rebuilt After Selloff |
| ETH Futures Open Interest | $21.80B | -0.83% | ETH Leverage Softened |
The headline number is the gap between activity and conviction. Open interest is still large, but funding is muted and liquidations are skewed toward longs. That tells us traders have not left the market, but they are no longer being paid to chase directional upside with aggressive leverage.
BTC and ETH futures are also trading far above spot turnover on CoinGlass’s exchange coverage. BTC showed $67.17 billion in 24-hour futures volume versus $5.55 billion in spot volume. ETH showed $34.54 billion in futures volume versus $1.67 billion in spot volume. That gap is normal for crypto, but it matters more during drawdowns because derivatives become the main venue for both hedging and forced liquidation.
BTC Leads, ETH Carries More Leverage Per Dollar Of Market Cap
Bitcoin has the larger derivatives complex in absolute terms. Ether has the heavier leverage load relative to its market capitalization.
| Asset | Spot Price Reference | Market Cap | Futures OI | OI / Market Cap | Futures Vol / Spot Vol |
|---|---|---|---|---|---|
| BTC | $58,573 Close On June 30 | $1.174T | $44.46B | 3.8% | 12.1x |
| ETH | $1,570.07 Close On June 30 | $189.48B | $21.80B | 11.5% | 20.7x |
That spread is worth watching. BTC still has the deeper institutional derivatives base, especially through CME and options. ETH, however, carries a much higher open-interest-to-market-cap ratio. In plain terms: a smaller ETH spot market is supporting a large futures stack. That can amplify moves when price breaks key levels or when funding flips sharply.
The ETH reading is not automatically bearish. It means ETH is more sensitive to forced positioning changes. When open interest stays large and spot liquidity is thinner, the market becomes less forgiving around liquidation bands.
Exchange Structure: Offshore Venues Still Dominate, CME Still Matters
BTC futures liquidity remains fragmented across offshore crypto exchanges and regulated CME exposure. CoinGlass’s BTC open-interest table showed total BTC open interest at 757,800 BTC, or $44.53 billion. Binance led with 142,220 BTC in OI, equal to 18.75% of the tracked total. CME ranked second with 94,760 BTC, or 12.49%.
| Venue | BTC Open Interest | USD Value | Share Of Tracked BTC OI | 24H OI Change |
|---|---|---|---|---|
| Binance | 142.22K BTC | $8.35B | 18.75% | +1.73% |
| CME | 94.76K BTC | $5.57B | 12.49% | +1.17% |
| Bybit | 67.98K BTC | $3.99B | 8.97% | -1.95% |
| Gate | 63.87K BTC | $3.75B | 8.42% | +2.55% |
| OKX | 44.89K BTC | $2.64B | 5.92% | +3.07% |
| KuCoin | 32.11K BTC | $1.89B | 4.23% | +4.41% |
| Bitget | 27.61K BTC | $1.62B | 3.64% | -0.17% |
CME’s own Bitcoin futures report for trade date June 30, 2026 showed 8,488 contracts in total volume and 18,411 contracts in open interest, with open interest rising by 405 contracts at the close. The near-month July 2026 contract accounted for most of the activity, with 7,355 contracts in volume and 16,377 contracts in open interest.
That creates a clean institutional read. Offshore venues still set the high-frequency leverage pulse. CME tells us whether regulated money is participating or stepping back. On June 30, CME participation was not exiting; open interest rose.
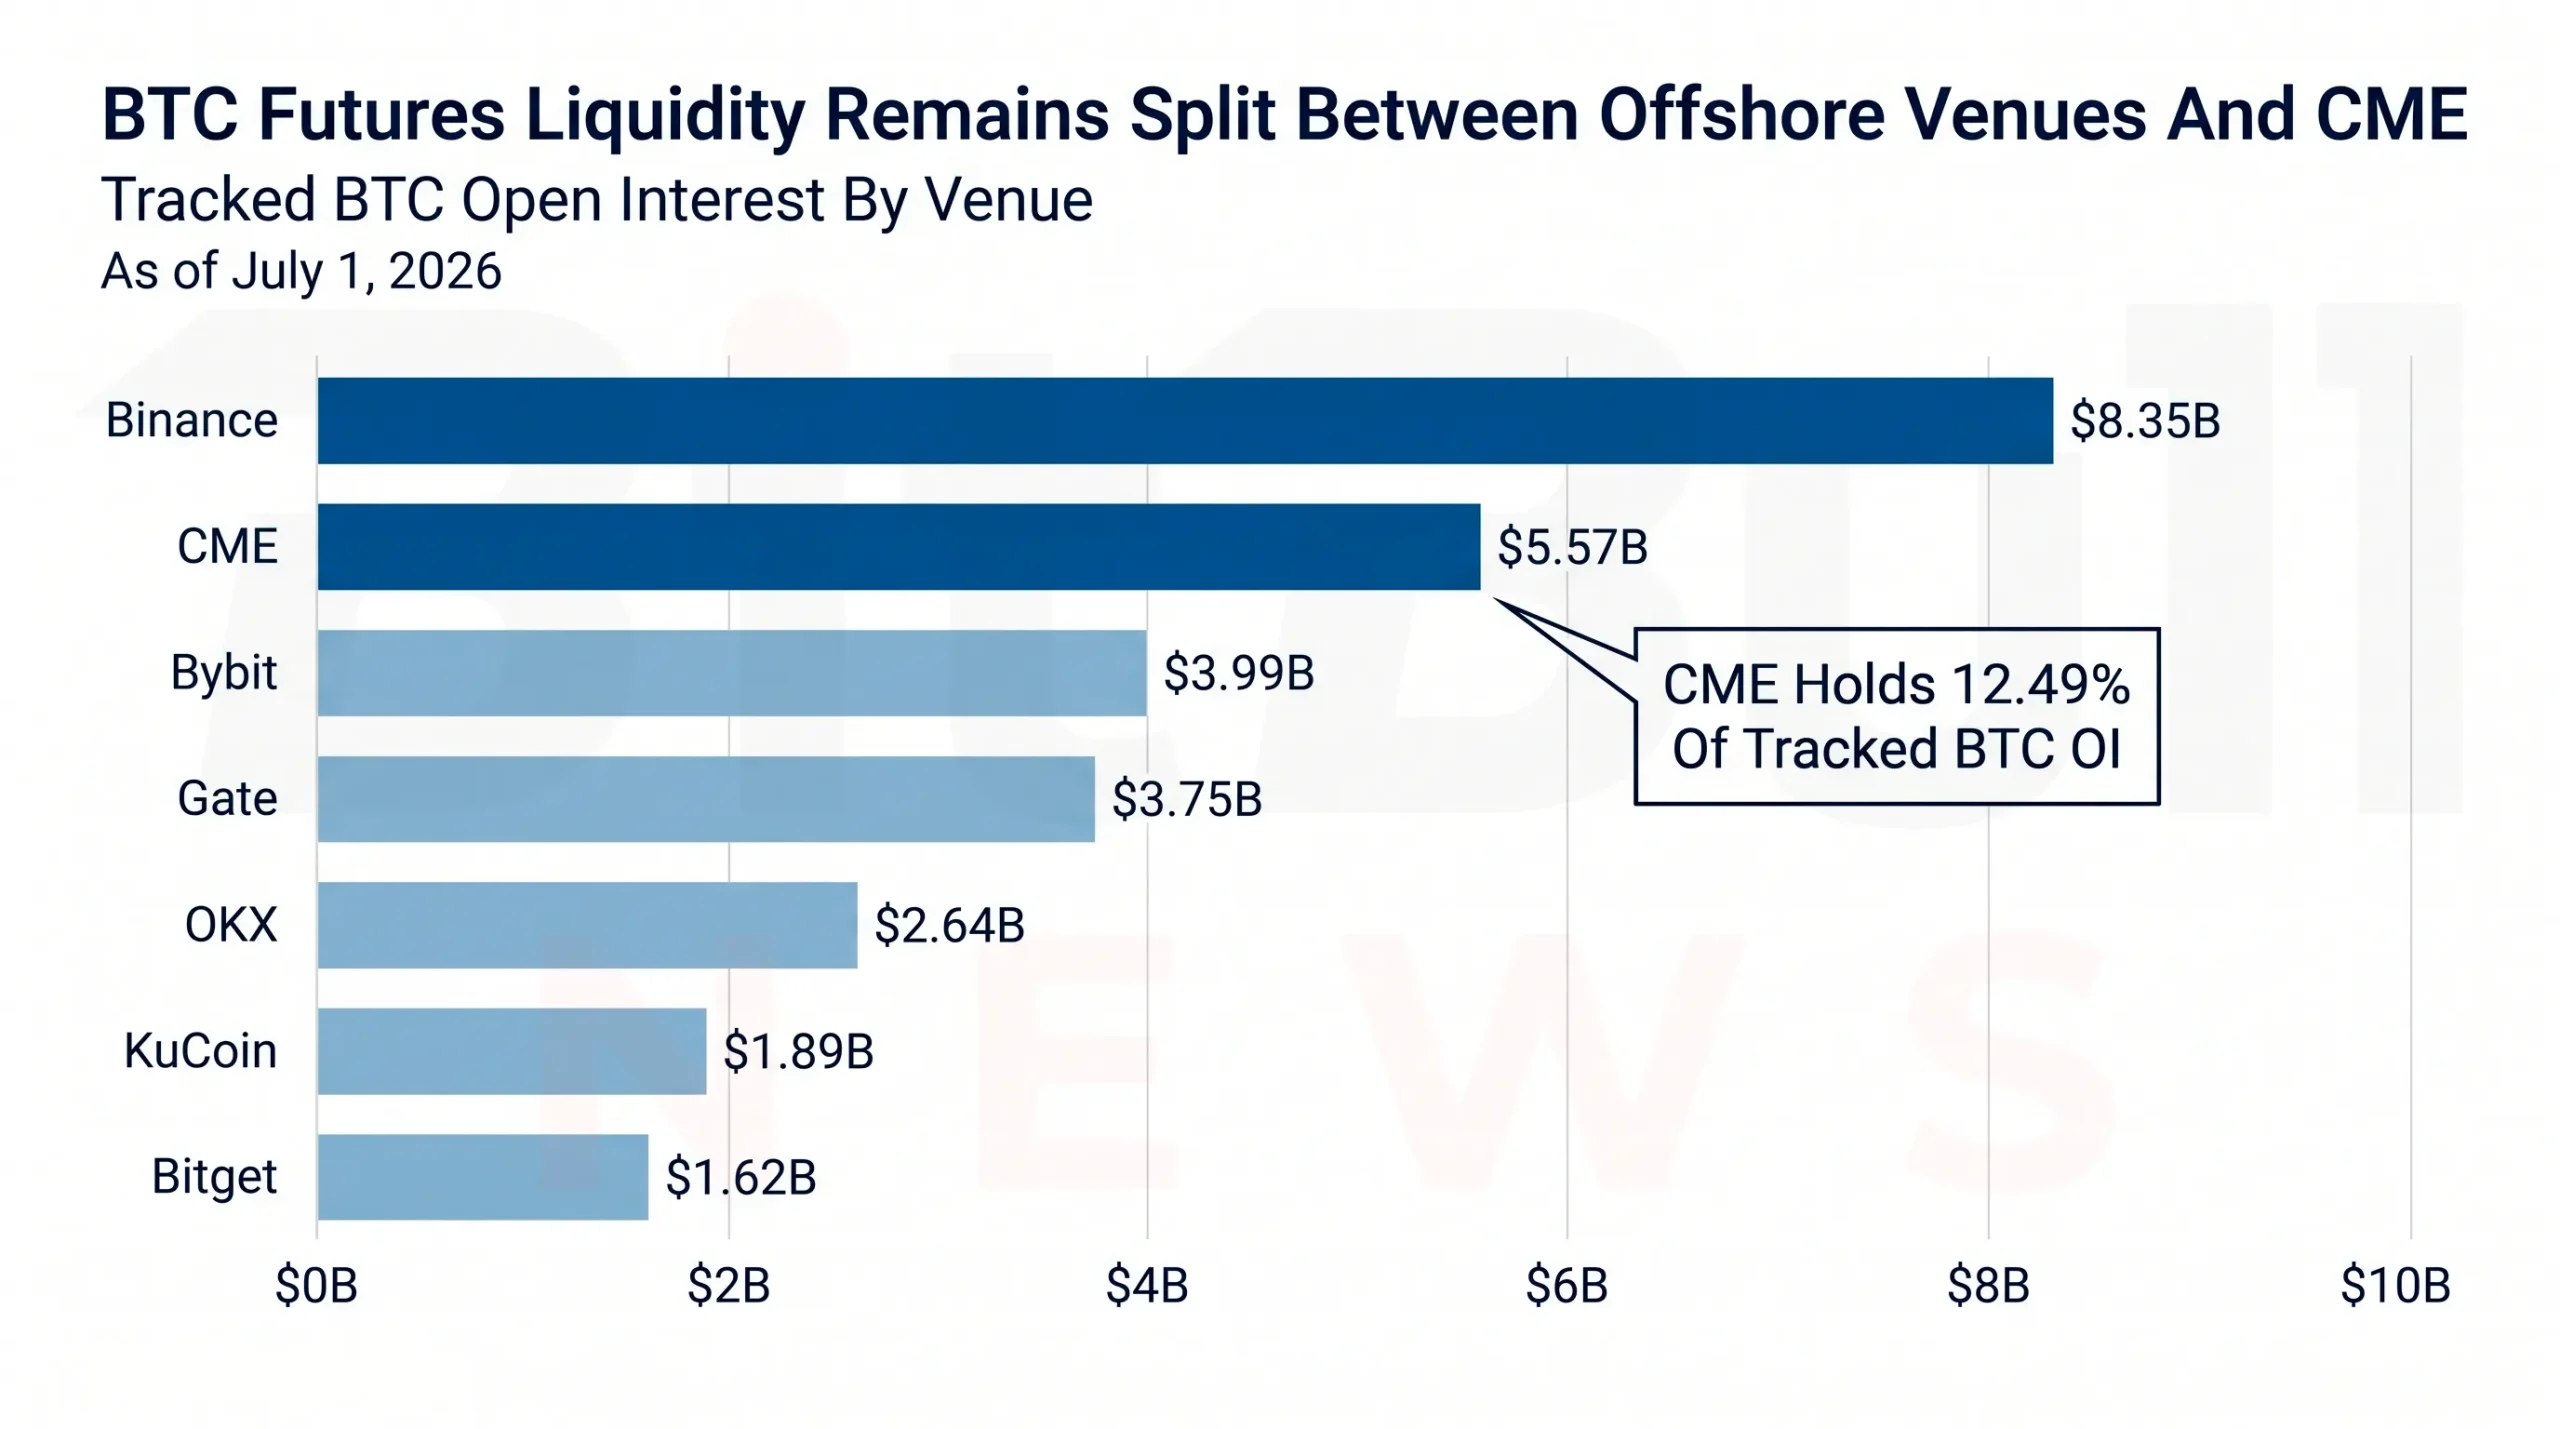
Chart: Horizontal Bar Chart Ranking BTC Futures Open Interest By Venue. Highlight Binance And CME As The Two Largest Pools. Add A Callout: “CME Holds 12.49% Of Tracked BTC OI”.
Funding Rates Are Not Screaming Risk-On
Funding is mixed, not overheated. BTC funding on major perpetual venues sat near flat to slightly positive, with Binance BTC/USDT at 0.0019%, OKX BTC/USDT at 0.0014%, Bybit BTC/USDT at 0.0100%, and Gate BTC/USDT at -0.0110%. ETH showed a similar split: Binance ETH/USDT at 0.0051%, OKX ETH/USDT at 0.0031%, Bybit ETH/USDT at -0.0042%, and Gate ETH/USDT at 0.0049%.
| Asset | Venue | Perp Pair | Funding Rate | Read |
|---|---|---|---|---|
| BTC | Binance | BTC/USDT | 0.0019% | Mild Long Bias |
| BTC | OKX | BTC/USDT | 0.0014% | Near Neutral |
| BTC | Bybit | BTC/USDT | 0.0100% | Positive But Not Extreme |
| BTC | Gate | BTC/USDT | -0.0110% | Short Bias |
| ETH | Binance | ETH/USDT | 0.0051% | Mild Long Bias |
| ETH | OKX | ETH/USDT | 0.0031% | Near Neutral |
| ETH | Bybit | ETH/USDT | -0.0042% | Short Bias |
| ETH | Gate | ETH/USDT | 0.0049% | Mild Long Bias |
This is what a post-selloff market often looks like. Traders are active, but they are not paying extreme funding to hold longs. That reduces immediate liquidation risk compared with euphoric funding regimes, but it also means the market lacks the clean long-side momentum that usually accompanies strong trend continuation.
Liquidations Show The Pain Was Still On The Long Side
The liquidation data is the most direct sign of stress.
BTC recorded $173.21 million in 24-hour liquidations, with $140.67 million from longs and $32.54 million from shorts. That means longs accounted for roughly 81% of BTC liquidations. ETH recorded $74.36 million in 24-hour liquidations, with $48.17 million from longs and $26.19 million from shorts.
| Asset | 24H Liquidations | Long Liquidations | Short Liquidations | Long Share |
|---|---|---|---|---|
| BTC | $173.21M | $140.67M | $32.54M | 81.2% |
| ETH | $74.36M | $48.17M | $26.19M | 64.8% |
| Total Crypto Futures | $383.72M | N/A | N/A | N/A |
This is not a balanced washout. It is still a long-side cleanout. The market can rebound after long liquidations, but a healthier reset would require either lower open interest, stronger spot buying, or a shift toward more balanced liquidation flow.
Options: Calls Still Dominate, But The Tape Is Defensive
BTC options remain call-heavy by open interest. CoinGlass showed total BTC options open interest at $25.04 billion, up 2.32%, with 24-hour BTC options volume at $2.60 billion, down 4.53%. Across BTC options, calls represented 60.44% of open interest and puts represented 39.56%. By 24-hour volume, calls were 52.64% and puts were 47.36%.
Deribit remains the main BTC options venue. CoinGlass’s Deribit options page showed Deribit BTC calls at 224,839.9 BTC in open interest, worth $13.33 billion in notional value, and puts at 129,454.73 BTC, worth $7.67 billion. Total Deribit BTC options open interest stood at 354,294.63 BTC, or $21.00 billion in notional value, with a put/call ratio of 0.37.
| Options Metric | BTC Reading | ETH Reading | Market Read |
|---|---|---|---|
| Options Open Interest | $25.04B | $3.54B | BTC Dominates Options Risk |
| 24H Options Volume | $2.60B | $527.45M | ETH Options Activity Is Smaller |
| BTC Call Share Of OI | 60.44% | N/A | Calls Still Lead |
| BTC Put Share Of OI | 39.56% | N/A | Hedging Demand Is Present |
| Deribit BTC Options OI | $21.00B | N/A | Deribit Remains The Core Options Venue |
| Deribit BTC Put / Call Ratio | 0.37 | N/A | Positioning Still Skews Toward Calls |
The call-heavy structure does not mean the market is aggressively bullish. After a spot drawdown, call open interest can reflect old upside structures, covered-call positioning, or volatility trades rather than fresh directional conviction. The more useful signal is the mix: open interest remains call-heavy, but volume is much closer to balanced between calls and puts. That points to more active hedging around a market that has lost momentum.
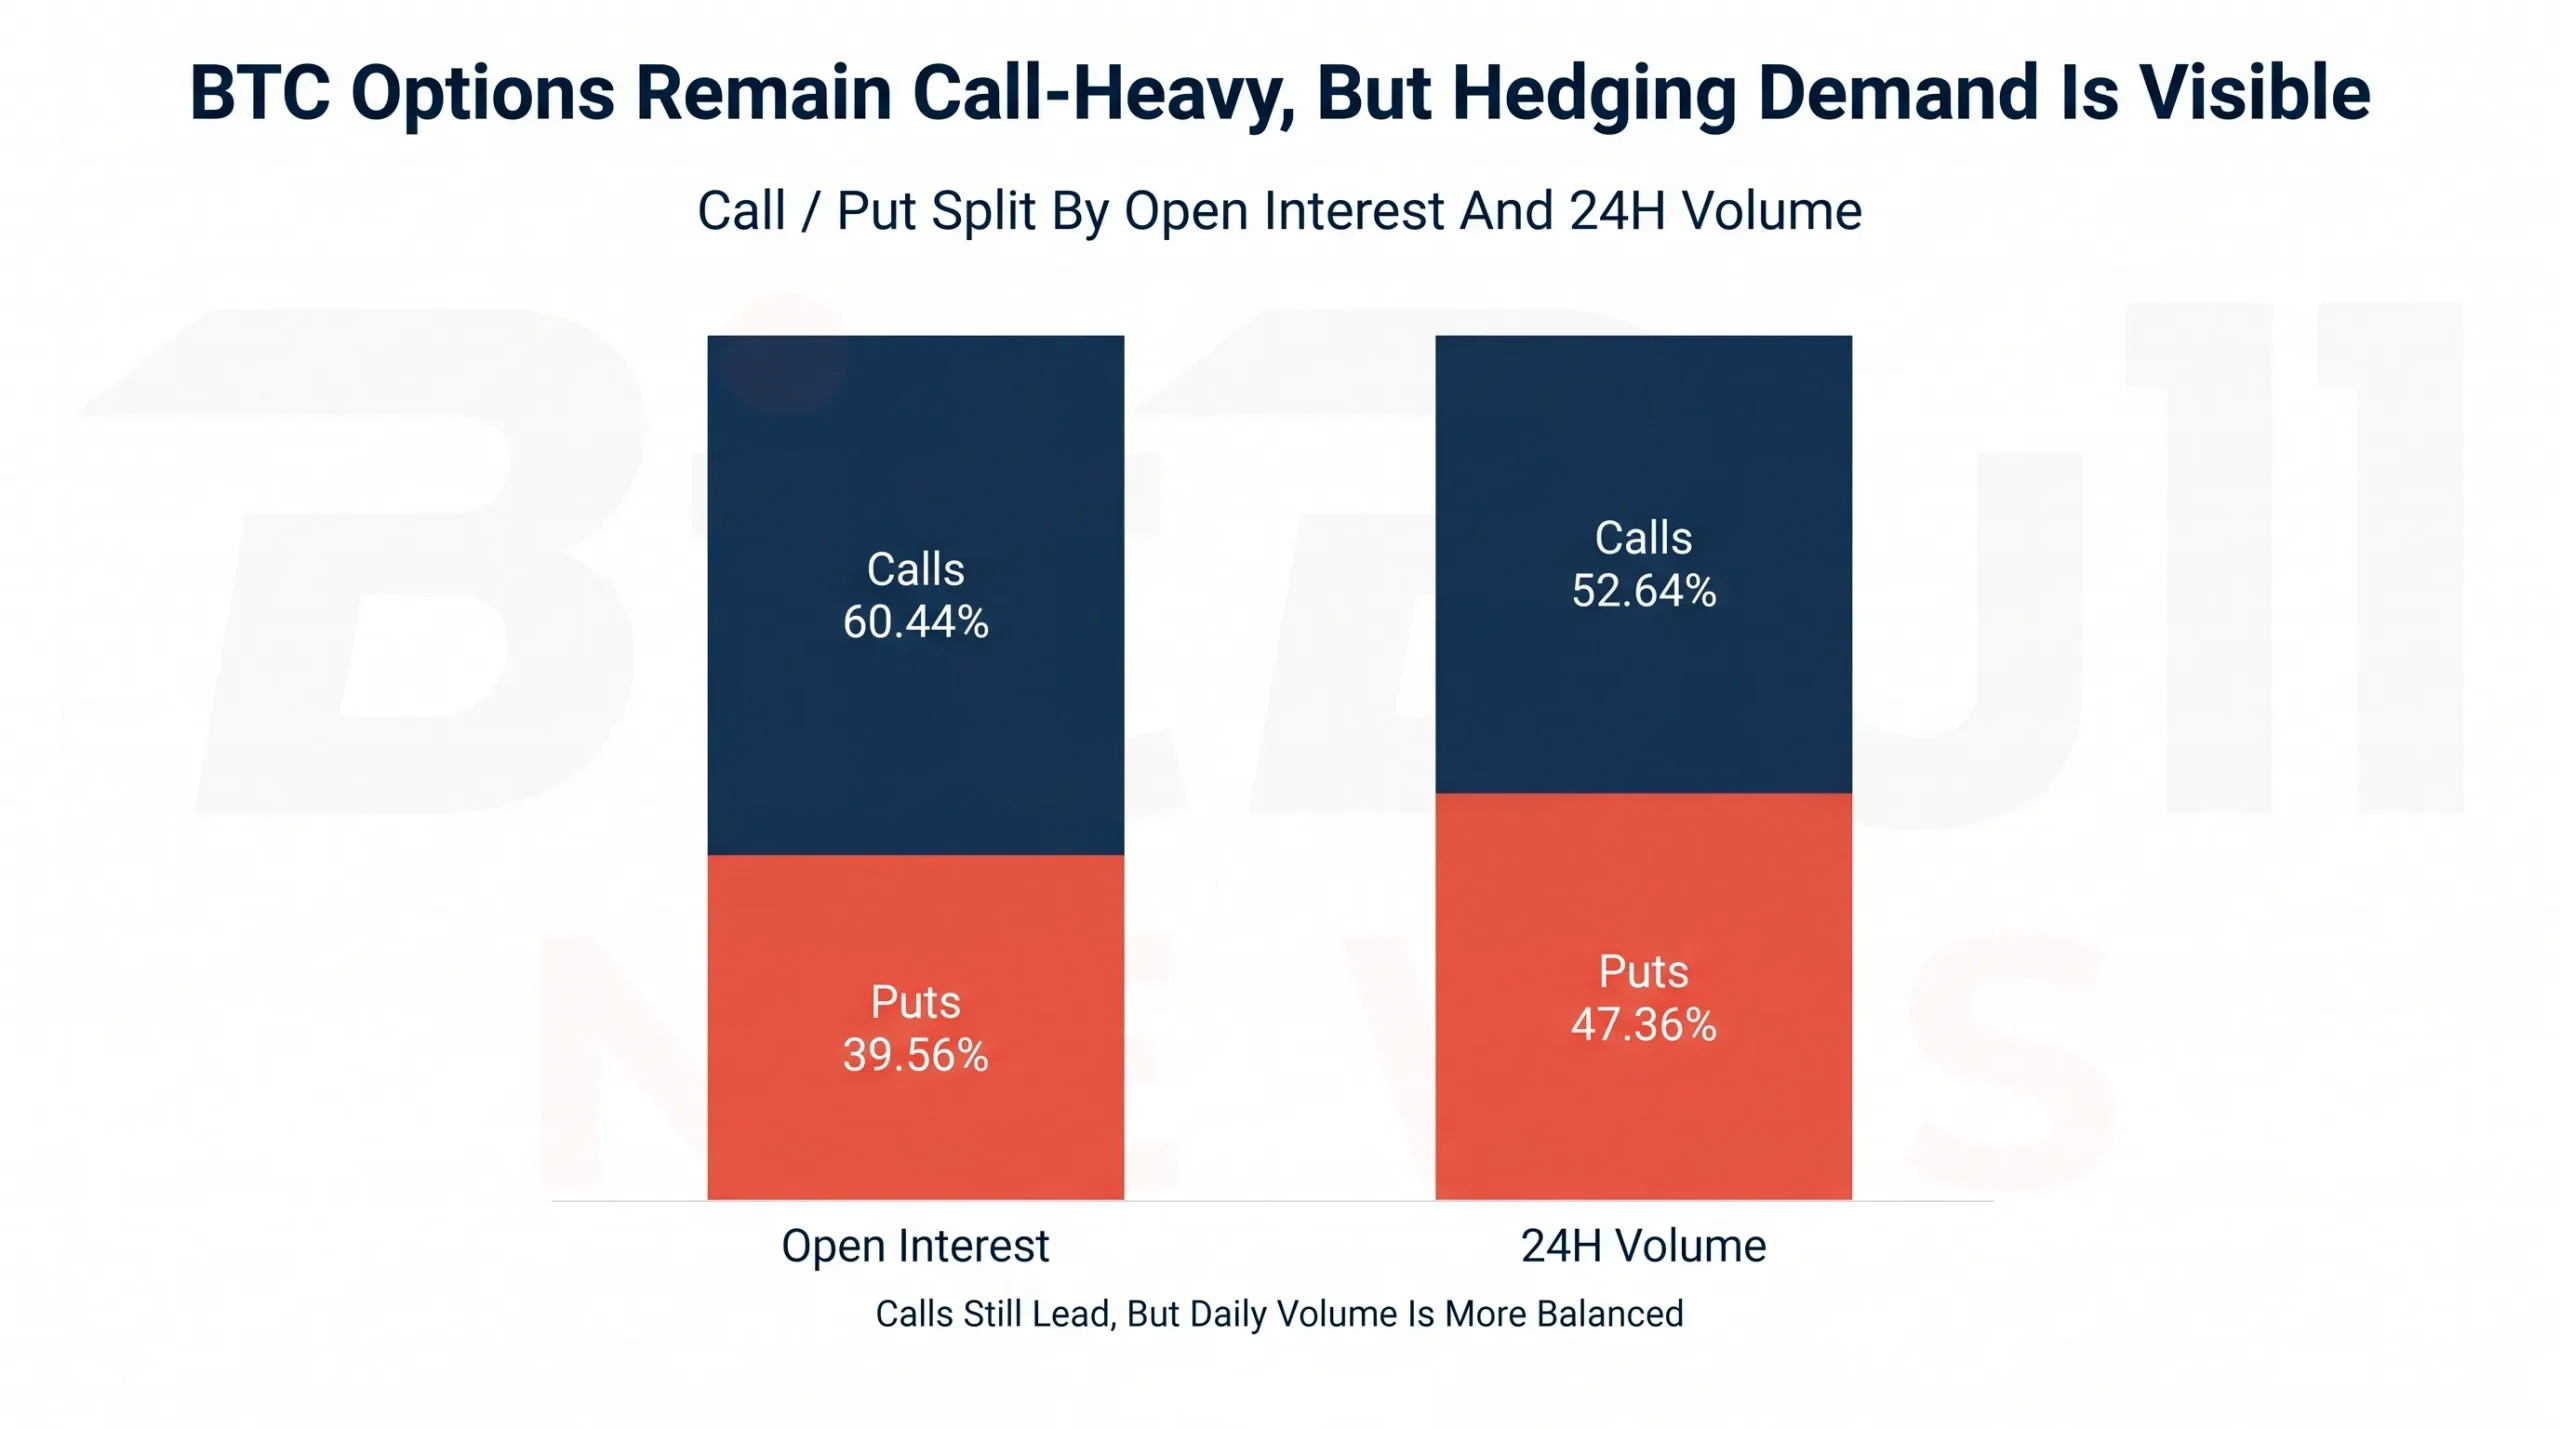
Chart: Stacked Bar Chart Showing BTC Options Open Interest By Calls And Puts, With A Separate Smaller Bar For 24H Volume Split. Label Call OI 60.44%, Put OI 39.56%, Call Volume 52.64%, Put Volume 47.36%.
CME Positioning: Asset Managers Long, Leveraged Funds Short
The latest public CFTC-linked positioning data shows the classic regulated-market split: asset managers were net long CME BTC futures, while leveraged funds were net short.
CoinGlass’s CME BTC CFTC table for June 23, 2026 showed asset managers with 5,202 long contracts and 2,617 short contracts, while leveraged funds held 4,925 long contracts and 11,055 short contracts. That puts asset managers net long by 2,585 contracts and leveraged funds net short by 6,130 contracts before spreads.
| Trader Category | Long Contracts | Short Contracts | Net Position | Read |
|---|---|---|---|---|
| Asset Managers | 5,202 | 2,617 | +2,585 | Structural Long Exposure |
| Leveraged Funds | 4,925 | 11,055 | -6,130 | Basis / Hedge / Short Bias |
| Dealers | 6,075 | 2,044 | +4,031 | Intermediation And Hedging |
| Other Reportables | 216 | 431 | -215 | Small Net Short |
This matters because CME open interest is not just a directional sentiment gauge. Asset managers can hold long BTC futures as exposure. Leveraged funds can short futures against spot, ETF, or basis trades. A large leveraged-fund short is not automatically a bearish macro call, but it does show how much regulated derivatives structure depends on basis and hedge activity rather than simple outright speculation.
What The Market Structure Actually Says
The derivatives market is giving three clear signals.
First, leverage is not gone. Total futures open interest above $100 billion means there is still enough positioning to move the market quickly if price breaks through liquidation zones.
Second, the long side absorbed most of the pain. BTC long liquidations were more than four times short liquidations over 24 hours. That usually forces traders to reduce leverage, but it does not guarantee a durable bottom. It only tells us forced selling already happened.
Third, options positioning is still structurally bullish on the surface, but less clean underneath. Calls dominate open interest, yet daily volume is much more balanced. That is the profile of a market hedging uncertainty, not one simply chasing upside.
Actionable Signals For Traders, Investors, And Risk Teams
| Audience | Signal To Watch | Why It Matters |
|---|---|---|
| Traders | BTC Funding Across Binance, Bybit, OKX, And Gate | A move from low funding to aggressive positive funding would show renewed long-side leverage. |
| Market Makers | BTC Options Volume Split | A rising put-volume share would confirm heavier downside hedging. |
| Institutional Investors | CME BTC Open Interest And COT Positioning | CME participation shows whether regulated exposure is expanding or reducing. |
| Risk Teams | ETH OI / Market Cap Ratio | ETH’s leverage intensity makes it more sensitive to liquidation cascades. |
| Policymakers | Offshore Versus Regulated OI Share | Most leverage still sits outside traditional regulated futures venues. |
For active traders, the cleanest near-term setup is not “bullish” or “bearish.” It is fragile but liquid. That means execution quality is good, but position sizing matters more than usual.
For institutional investors, CME participation is the key watch item. If CME open interest keeps rising while offshore funding stays muted, that points to hedged institutional participation rather than retail leverage mania.
For risk teams, ETH deserves special attention. Its derivatives footprint is large relative to market cap, and the spot market is thinner than BTC’s. That combination can make liquidation events more violent.
Key Findings
- Total crypto futures open interest stood at $102.59 billion, up 0.64% over 24 hours.
- Total crypto futures volume was $168.74 billion, down 4.38% over 24 hours.
- BTC futures open interest stood near $44.46 billion, while ETH futures open interest stood near $21.80 billion.
- BTC 24-hour liquidations reached $173.21 million, with longs accounting for roughly 81% of the total.
- Deribit held roughly $21.00 billion in BTC options open interest, making it the core BTC options venue in the cited dataset.
- CME BTC futures open interest rose by 405 contracts on June 30, with total open interest at 18,411 contracts.
- CME CFTC-linked data showed asset managers net long and leveraged funds net short BTC futures as of June 23.
What To Watch Next
The first watch item is BTC futures open interest. If BTC OI keeps rising while spot price stalls below the late-June range, leverage is rebuilding without enough spot confirmation. That raises liquidation risk.
The second watch item is ETH’s OI-to-market-cap ratio. A high ratio does not predict direction, but it makes ETH more exposed to forced moves when price breaks.
The third watch item is options volume. BTC call open interest remains dominant, but the daily call/put volume split is close enough to balanced that hedging demand should not be ignored.
The fourth watch item is CME versus offshore exchange share. A rising CME share would point to more regulated participation. A sharp offshore OI increase with hot funding would point to a more speculative market.
BitBullNews View
The derivatives market is not dead. It is not euphoric either.
This is a market with deep liquidity, active leverage, and defensive behavior under the surface. BTC remains the institutional anchor. ETH carries more leverage intensity. Deribit still dominates options risk. Binance remains the largest BTC futures venue in the tracked CoinGlass dataset, while CME keeps enough share to matter for institutional price discovery.
The clean bullish signal would be simple: rising spot price, rising open interest, stable funding, and lower long liquidation share. That is not what the current data shows.
The current structure says traders are still in the market, but they are trading around risk rather than pressing a broad upside trend.
Data Sources & References
- CoinGlass Cryptocurrency Futures Open Interest, Volume, Liquidations, Long/Short Data.
- CoinGlass Bitcoin Futures Market Data, Open Interest, Funding, Volume, Options, And Liquidations.
- CoinGlass Ethereum Futures Market Data, Open Interest, Funding, Volume, Options, And Liquidations.
- CoinGlass BTC Options Open Interest, Volume, Call/Put Split, And Strike Rankings.
- CoinGlass Deribit Options Open Interest And Put/Call Metrics.
- CME Group Bitcoin Futures Volume And Open Interest.
- CME Group Ether Futures Product And Market Data Page.
- CoinGlass CME BTC Futures CFTC Positioning Data.
- CFTC Commitments Of Traders Report Index.
- CoinGecko Bitcoin Historical Market Data.
- CoinGecko Ethereum Historical Market Data.