


Content
The tokenized real-world asset market expanded again this week. The quality of that growth became harder to read.
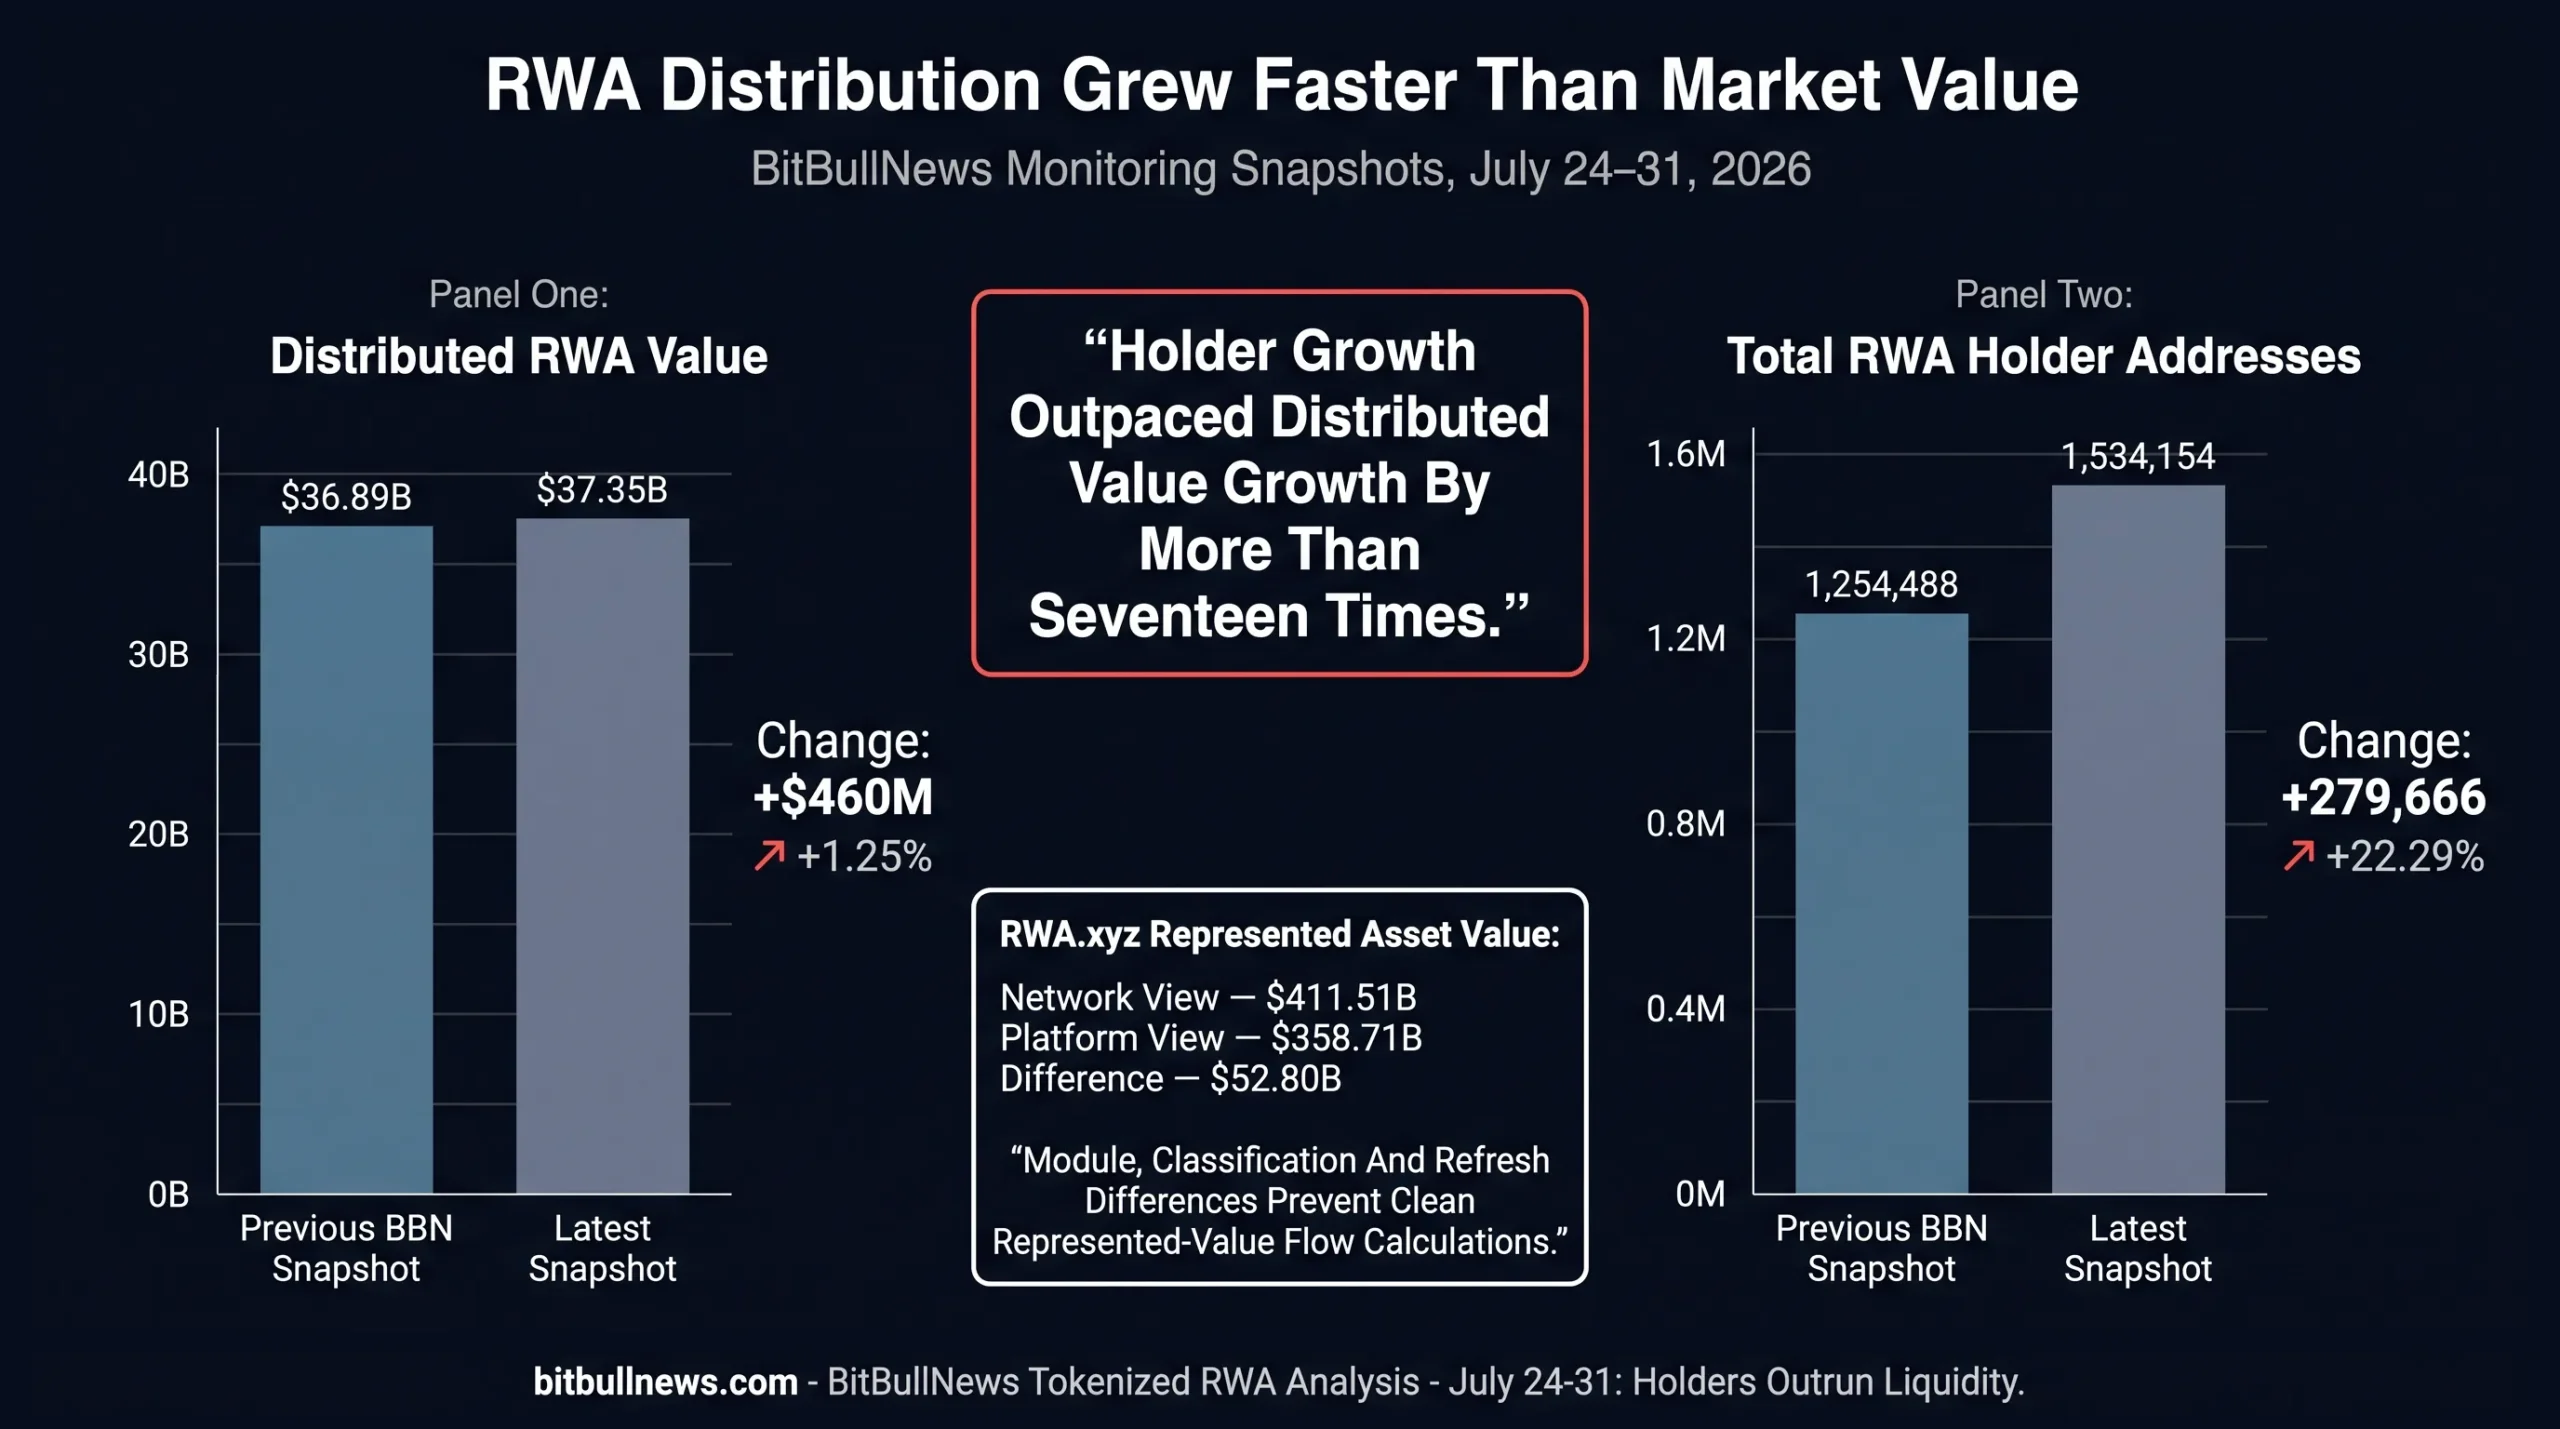
RWA.xyz recorded $37.35 billion of distributed assets in its network-level snapshot captured after the July 31 reporting period. That was approximately $460 million, or 1.25%, above the previous BitBullNews snapshot. Tracked RWA holder addresses increased much faster, rising by almost 280,000 to 1.53 million.
The increase in reach did not translate into stronger activity across every category.
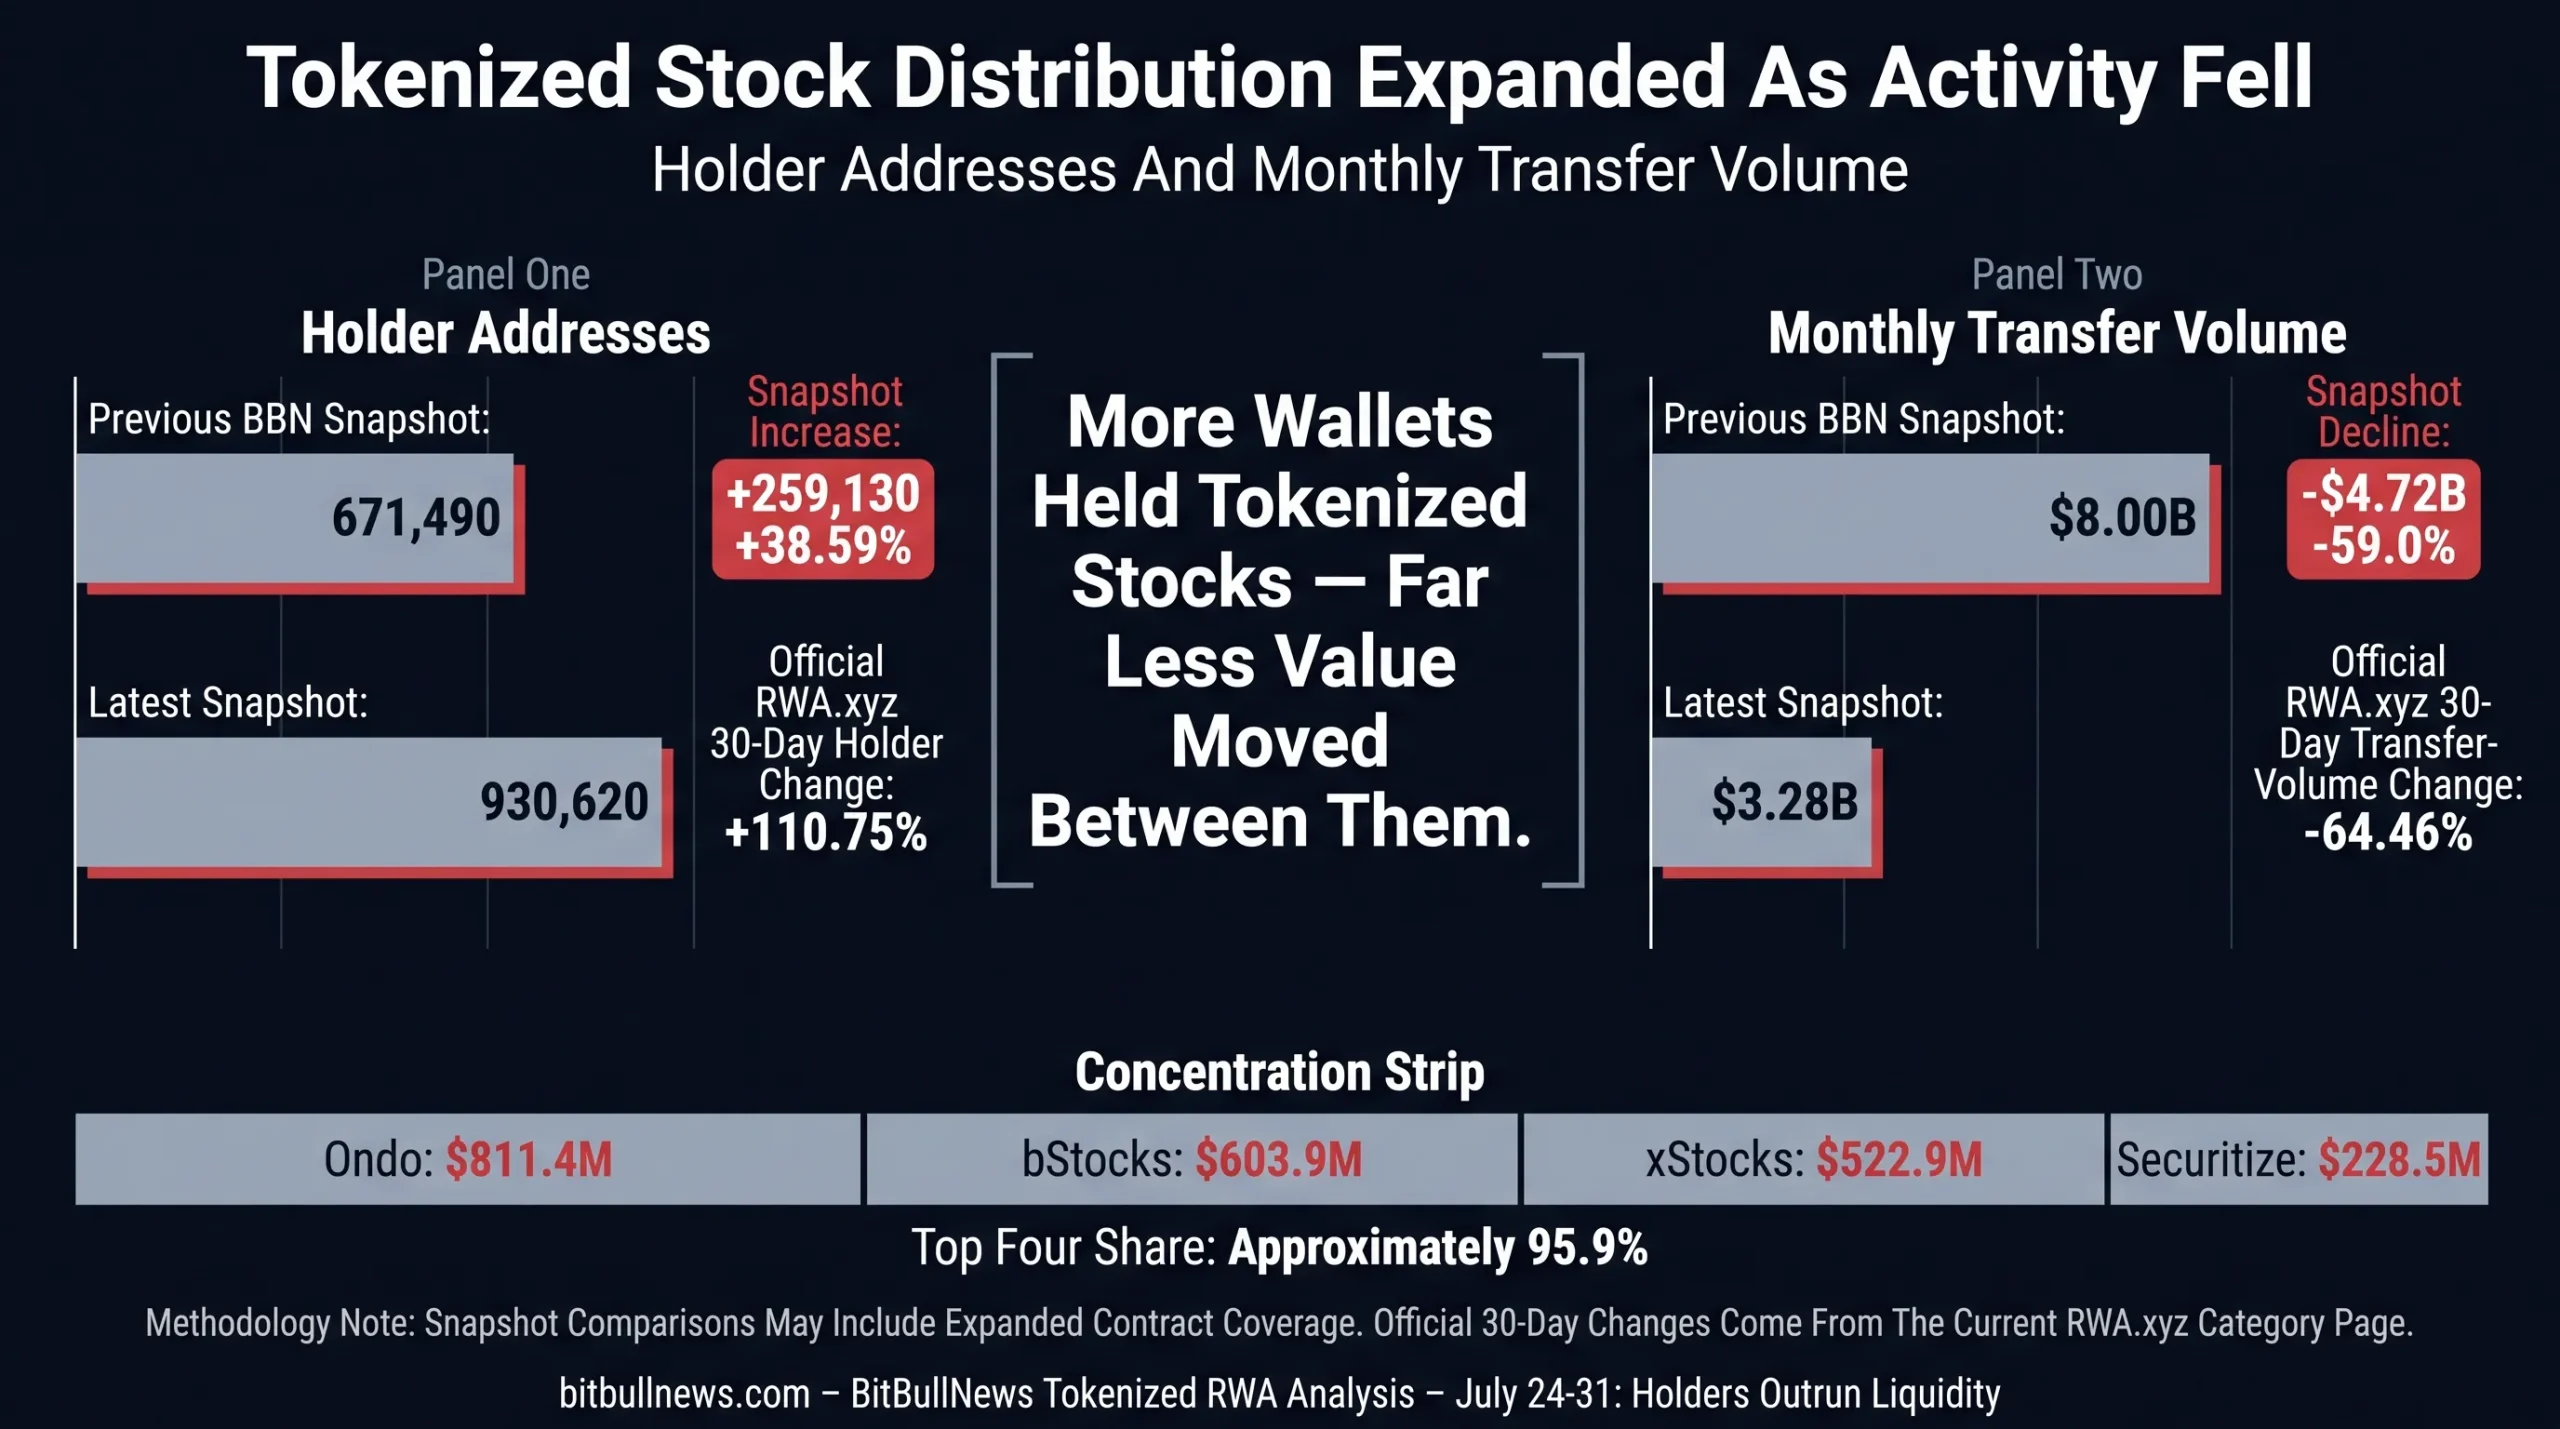
Tokenized-stock holder addresses climbed above 930,000, but monthly transfer volume fell to $3.28 billion, down 64.46% over 30 days. Ethereum and Solana also recorded declines of more than 60% in their respective 30-day RWA transfer volumes.
The week’s strongest progress came from infrastructure.
Ten banks and financial institutions launched Regulated Layer One, or RL1, as a member-owned European settlement network. Ondo introduced a separate execution architecture that processes orders privately while retaining public-blockchain settlement and verification. Both projects moved tokenization away from simple issuance and toward the systems required for trading, collateral and delivery-versus-payment.
The central signal is no longer market value alone.
Tokenization is reaching more wallets and more institutions. Liquidity remains concentrated, transfer activity is uneven and several headline changes still reflect coverage, classification or dashboard timing rather than clean subscriptions.
Data Scope And Methodology
Market-wide figures use RWA.xyz snapshots available after the July 31 reporting period. Individual category pages refresh at different times, so values may not reconcile perfectly across the network, platform and asset-class modules.
The difference is material.
RWA.xyz’s network view showed $37.35 billion of distributed assets and $411.51 billion of represented assets. Its platform view showed $37.63 billion distributed and $358.71 billion represented. The distributed totals differed by less than 1%, while represented value differed by $52.8 billion, or approximately 14.7%.
Distributed assets use blockchain as a transfer and distribution layer. Represented assets use blockchain primarily for recordkeeping inside controlled platforms. Assets can move between classifications as transferability or product information changes. Weekly changes should therefore be treated as monitoring-snapshot movements, not audited net fund flows.
RWA Market Scorecard
| Market Metric | Latest Snapshot | Previous BBN Snapshot | Snapshot Change | Market Read |
|---|---|---|---|---|
| Distributed Asset Value | $37.35B | $36.89B | +$460M, +1.25% | Transferable RWA value continued expanding |
| Represented Asset Value | $411.51B Network View / $358.71B Platform View | $366.97B | Not Directly Comparable | Module and classification differences remain material |
| Total RWA Holders | 1,534,154 | 1,254,488 | +279,666, +22.29% | Wallet-level distribution grew much faster than value |
| Stablecoin Value | $296.27B | $298.75B | -$2.48B, -0.83% | Stablecoins did not drive the RWA increase |
| Tokenized U.S. Treasuries | $16.17B | $15.86B | +$310M, +1.95% | Government debt remained the largest transferable RWA category |
| Tokenized Stocks | $2.26B | $1.86B | +$400M, +21.51% | Apparent jump includes coverage and classification effects |
| Tokenized Credit | $6.99B | $6.98B | +$10M, +0.14% | Transferable credit was effectively flat |
| Active Strategies | $3.52B | $3.50B | +$20M, +0.57% | Category remained concentrated in two products |
| Tokenized Commodities | $4.61B | $4.48B | +$130M, +2.90% | Snapshot value increased despite weaker 30-day activity |
| Private Equity And Venture Capital | $2.18B | $2.13B | +$50M, +2.35% | Institutional private-market value continued rising |
Latest market and network figures come from RWA.xyz. Previous figures are from the prior BitBullNews monitoring snapshot. Category refresh times and classifications differ.
Headline Growth Was Real — But Not Clean Fund Flow
The $460 million increase in distributed assets points to continued market expansion. It does not identify how much came from new subscriptions.
Several mechanisms can change the headline value:
- New issuance or redemptions.
- Changes in the market value of underlying securities.
- Newly indexed assets or networks.
- Movement from represented to distributed classification.
- Changes in token transferability.
- Dashboard timing and platform attribution.
This distinction is especially important for tokenized stocks. Their current category page shows a 0.26% decline in distributed value over 30 days, even though the latest total is $400 million above the previous BitBullNews snapshot. That combination strongly suggests a discontinuity in coverage or classification rather than a clean 21.5% weekly capital inflow.
The same caution applies to commodities. Their latest snapshot value was higher than in the previous report, while RWA.xyz showed a 0.63% decline over its own rolling 30-day window.
The more reliable signals are those measured inside one consistent module: current category value, current transfer volume, holder growth, concentration and legal structure.
Asset-Class Dashboard
| Asset Class | Distributed Value | Official 30-Day Change | Additional Activity Signal | Current Interpretation |
|---|---|---|---|---|
| U.S. Treasuries | $16.17B | +4.01% | 62,950 holders; 3.39% average seven-day yield | Largest and most established transferable RWA segment |
| Tokenized Credit | $6.99B | -0.55% | $36.43B represented value | Credit adoption remains mostly platform-bound |
| Tokenized Commodities | $4.61B | -0.63% | Monthly transfer volume down 44.51% | Value remained large while turnover weakened |
| Active Strategies | $3.52B | +4.03% | 61,888 holders | Growth remained highly concentrated |
| Tokenized Stocks | $2.26B | -0.26% | Monthly transfer volume down 64.46% | Distribution expanded faster than trading activity |
| Private Equity And Venture Capital | $2.18B | +4.88% | Only 7,234 holders | High-value institutional category with narrow ownership |
| Tokenized Real Estate | $202.63M | -0.01% | Monthly active addresses down 18.89% | Market remained fragmented and largely static |
Thirty-day changes come from the relevant RWA.xyz category dashboards and are more internally consistent than comparisons between separate weekly snapshots.
Treasuries still provide the market’s capital base. Stocks provide most of its new addresses. Credit provides the largest represented institutional balance. Those are three different forms of adoption and should not be combined into one growth narrative.
Tokenized Stocks Added Holders While Activity Collapsed
Tokenized stocks were the clearest example of distribution outrunning liquidity.
RWA.xyz recorded $2.26 billion of distributed stock and ETF value across 3,129 assets. Holder addresses increased 110.75% over 30 days to approximately 930,620. Monthly transfer volume fell 64.46% to $3.28 billion.
Tokenized Stock Reach Versus Activity
| Tokenized Stock Metric | Latest Reading | Official 30-Day Change | Previous BBN Snapshot | Snapshot Read |
|---|---|---|---|---|
| Distributed Value | $2.26B | -0.26% | $1.86B | Apparent snapshot increase is not consistent with the category’s rolling change |
| Represented Value | $20.04M | -7.57% | $20.25M | Platform-bound stock value remained small |
| Monthly Transfer Volume | $3.28B | -64.46% | $8.00B | Activity fell by $4.72B between BBN snapshots |
| Holder Addresses | Approximately 930,620 | +110.75% | 671,490 | Address count increased by approximately 259,130 |
| Monthly Active Addresses | 421,285 | Not Displayed | 168,368 | Comparison may be affected by expanded contract coverage |
| Tracked Assets | 3,129 | — | Not Comparable | Product coverage continued broadening |
| Top Four Platform Share | Approximately 95.9% | — | Not Previously Calculated | Value remained concentrated despite broad holder growth |
The four largest platforms by distributed stock value were Ondo, bStocks, xStocks and Securitize. Together they accounted for approximately 95.9% of the current category total.
The holder increase is not meaningless. It shows that tokenized securities are reaching more addresses and distribution channels.
The activity collapse changes the interpretation.
A market with more holders but less transfer volume may be experiencing:
- New users receiving small allocations and holding them.
- Promotional or introductory distributions.
- Expanded contract indexing.
- Fragmentation across more products.
- Lower secondary-market turnover.
- A move from trading toward passive ownership.
Research on tokenized RWAs has repeatedly warned that tokenization and secondary liquidity are separate outcomes. Putting an asset onchain can reduce administrative friction without producing deep two-way markets.
Four Platforms Controlled Almost The Entire Stock Market
Ondo led tokenized-stock platforms with approximately $811.4 million. bStocks held $603.9 million, xStocks $522.9 million and Securitize $228.5 million. The remaining platforms shared less than 5% of distributed category value.
The concentration is both an advantage and a risk.
Liquidity can consolidate around a limited number of issuers, market makers and technical standards. That can improve execution. It also makes the category dependent on a narrow set of custody arrangements, transfer agents, oracle systems and legal wrappers.
The number of assets does not solve this problem. More than 3,000 tracked instruments can still rely on the same few distribution platforms.
Robinhood Won Distribution, Not Capital Depth
Robinhood’s network produced the most extreme holder-to-value ratio in the market.
The latest network table showed approximately $27.25 million of distributed RWA value and 357,688 holder addresses. Robinhood therefore represented roughly 23.3% of all tracked RWA holder addresses but only 0.073% of distributed RWA value.
Network Distribution And Holder Density
| Network | Distributed RWA Value | RWA Holder Addresses | Approximate Value Per Holder Address | Market Pattern |
|---|---|---|---|---|
| Ethereum | $17.05B | 220,839 | $77,215 | Deep capital base with comparatively concentrated ownership |
| BNB Chain | $5.85B | 271,991 | $21,514 | Large balance and broad retail-facing distribution |
| Solana | $3.68B | 321,032 | $11,452 | Strong combination of value, products and wallet reach |
| Robinhood | $27.25M | 357,688 | $76 | Largest holder footprint among the four, but minimal value per address |
Holder addresses are not unique investors. One investor may control multiple wallets, while custodians and omnibus accounts may represent many investors through one address. Values are calculated from RWA.xyz’s latest network table.
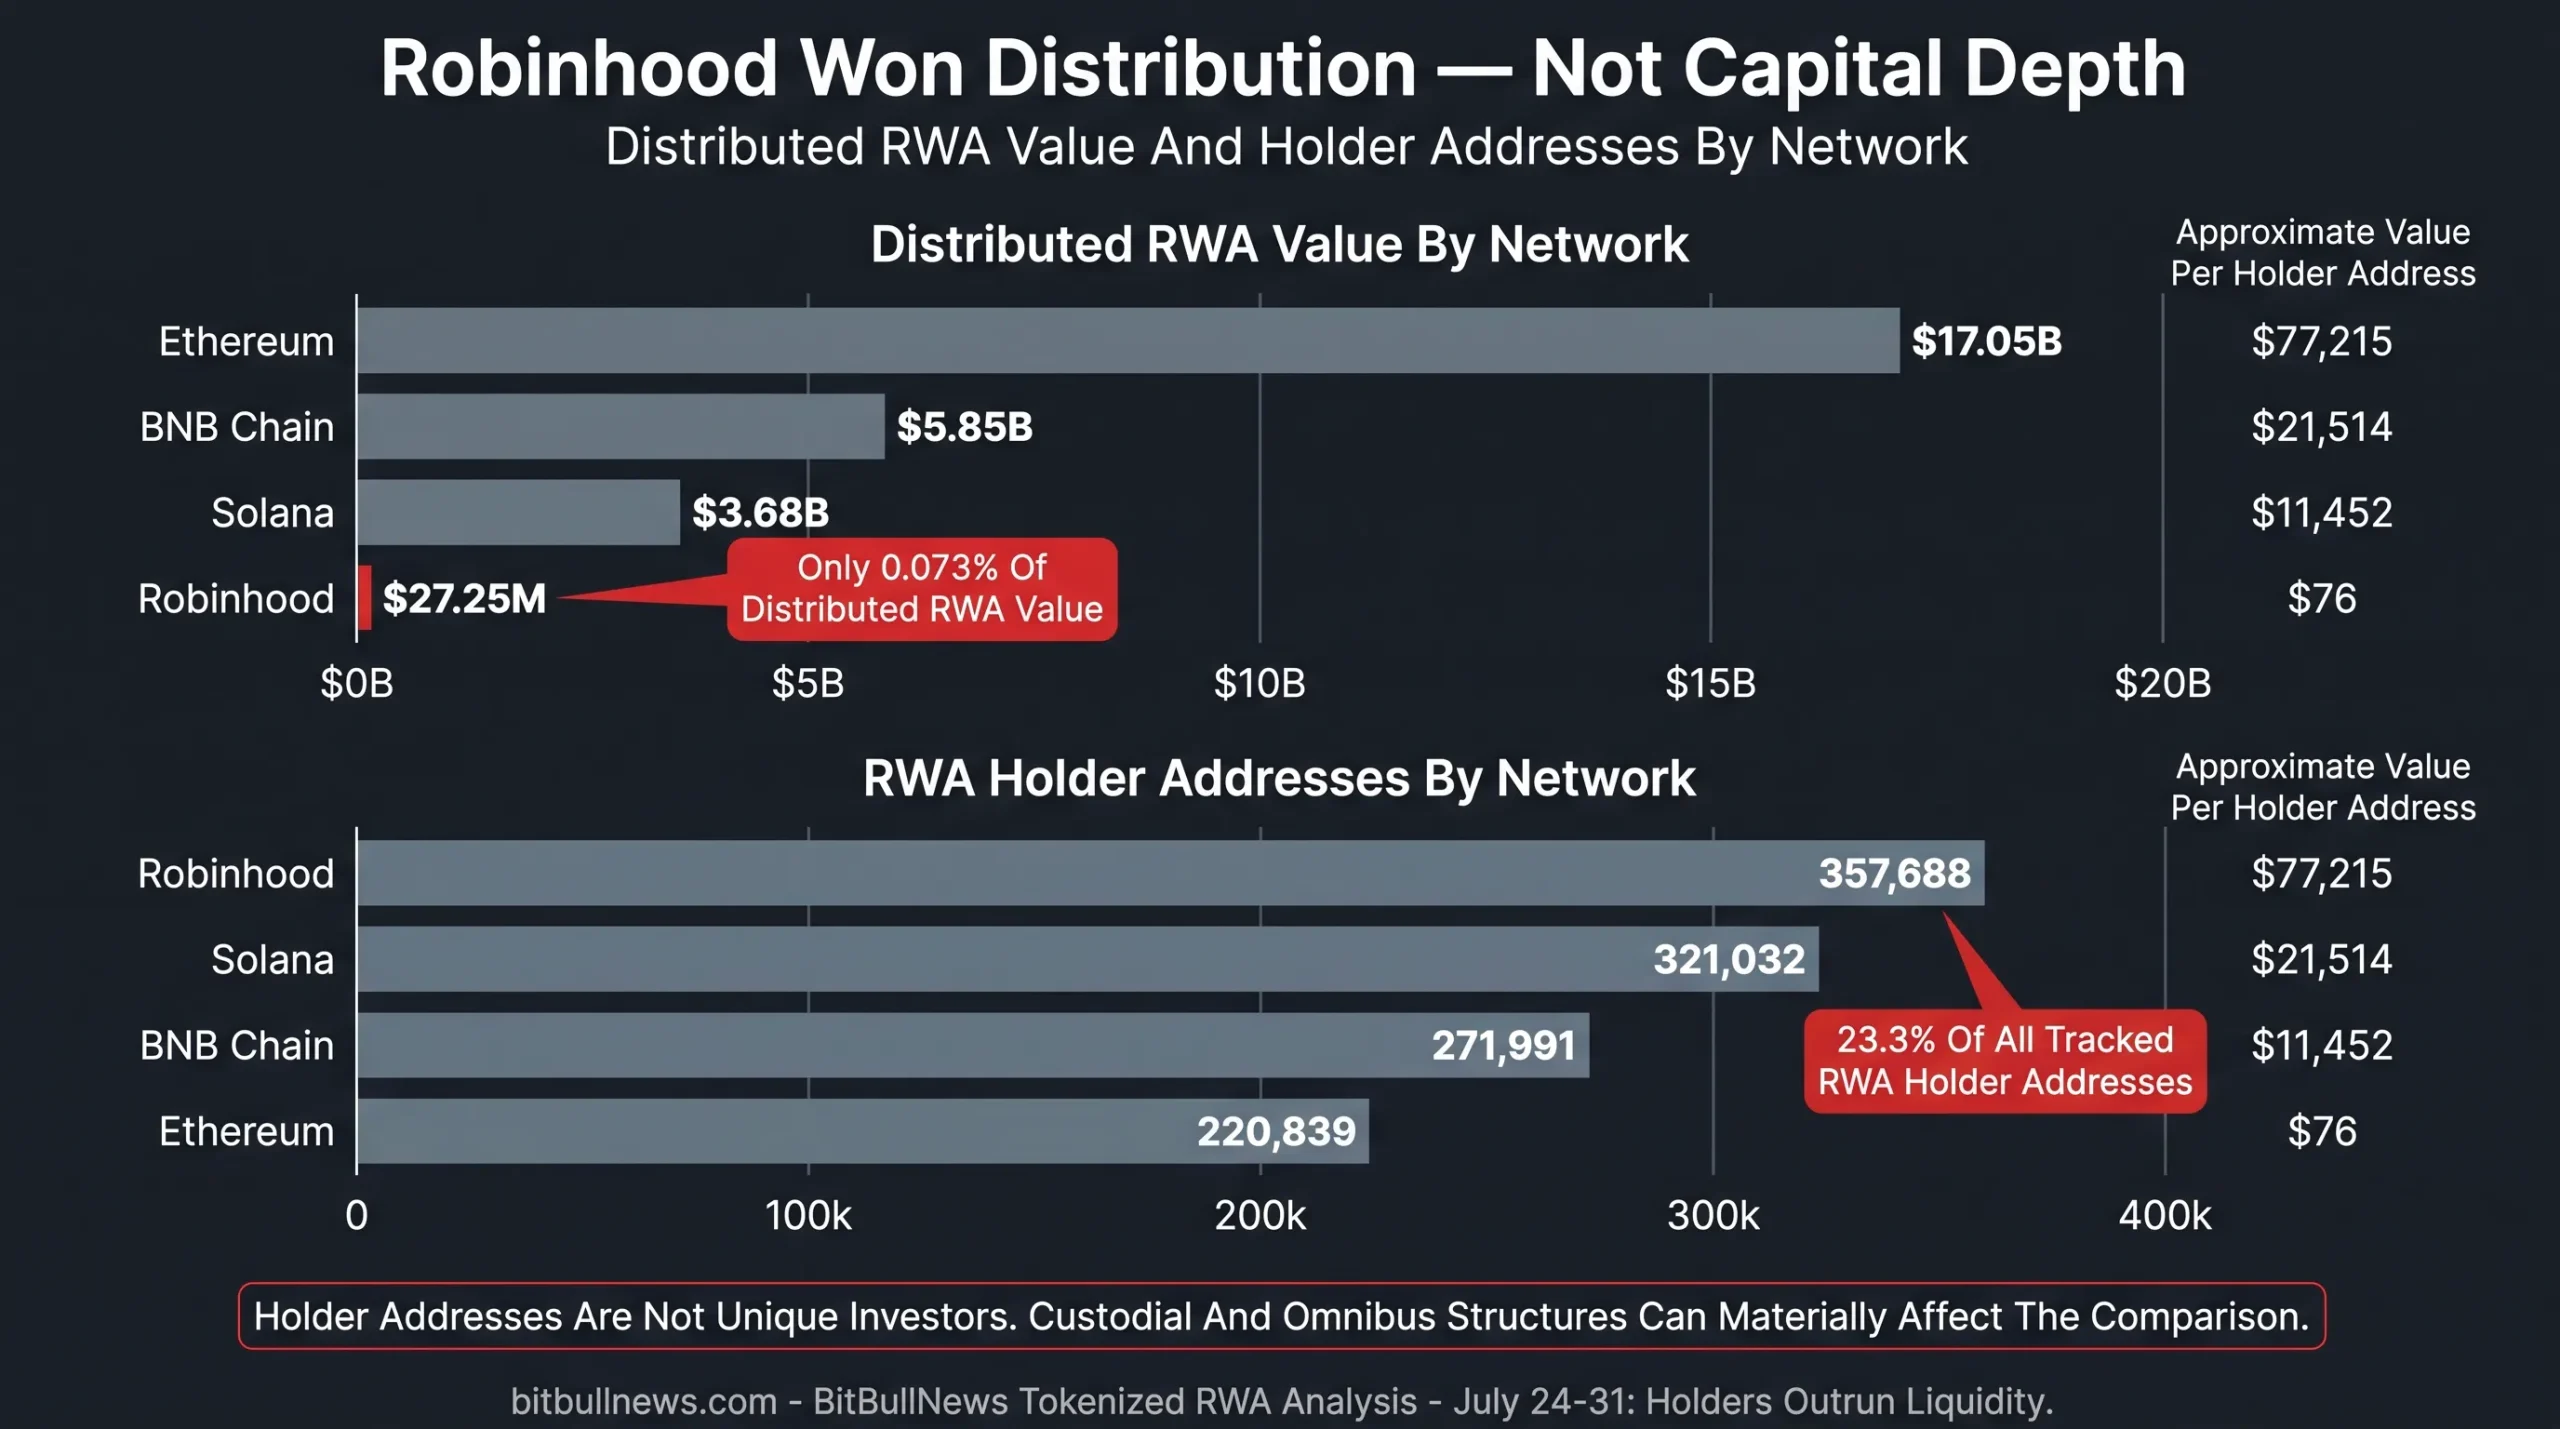
The result reflects two different tokenization models.
Ethereum remains the primary capital layer for institutional products. Its distributed value is more than 600 times Robinhood’s, despite having fewer tracked holder addresses.
Robinhood is functioning as a distribution layer. Small allocations can reach large numbers of users through a familiar brokerage interface. That is valuable for access, but it should not be mistaken for comparable capital depth.
Robinhood’s dedicated RWA page also recorded approximately $1.16 billion of 30-day transfer volume and rapid activity growth. Its value base remains small enough that turnover ratios can appear unusually high.
Ethereum Retained Capital Leadership
Ethereum held approximately $17.05 billion of distributed RWA value in the latest network table, equal to about 45.7% of the market-wide total. It also supported more than 1,500 tracked RWA contracts.
Its 30-day transfer volume fell 60.78% to $12.14 billion.
Solana recorded a similar activity decline. Its 30-day RWA transfer volume fell 62.84% to $3.43 billion, even as the network supported more than 2,500 tracked RWA contracts and more than 320,000 holder addresses.
The declines across both networks suggest the stock-market turnover weakness was part of a broader slowdown in onchain RWA movement, not a single-platform issue.
Treasuries Remained The Capital Anchor
Tokenized U.S. Treasury value reached $16.17 billion, up 4.01% over 30 days. The category’s average seven-day yield was 3.39%, and holder count remained stable near 62,950.
The largest products followed different growth paths.
Tokenized Treasury Market Leaders
| Product | Issuer Or Platform | Current Value | Recent Change | Seven-Day Yield | Holder Addresses |
|---|---|---|---|---|---|
| USYC | Circle | $3.01B | -3.27% Over 30 Days | 3.17% | 43 |
| BUIDL | BlackRock / Securitize | $2.66B | +19.19% Over 30 Days | 3.40% | 114 |
| USDY | Ondo | $2.16B | Approximately Flat Over 30 Days | 3.49% | 15,555 |
| iBENJI | Franklin Templeton | Approximately $1.80B | Not Displayed In Retrieved Snapshot | Not Displayed | Not Displayed |
| JTRSY | Janus Henderson / Centrifuge | $881.3M | +0.05% Over 30 Days | 3.19% | 28 |
| JLTXX | JPMorgan | Approximately $809.1M | Not Displayed In Retrieved Snapshot | Not Displayed | Not Displayed |
| Total Treasury Category | — | $16.17B | +4.01% Over 30 Days | 3.39% Average | 62,950 |
Product values and yields come from RWA.xyz’s Treasury dashboard and product pages. Approximate values are used where the overview displayed rounded figures.
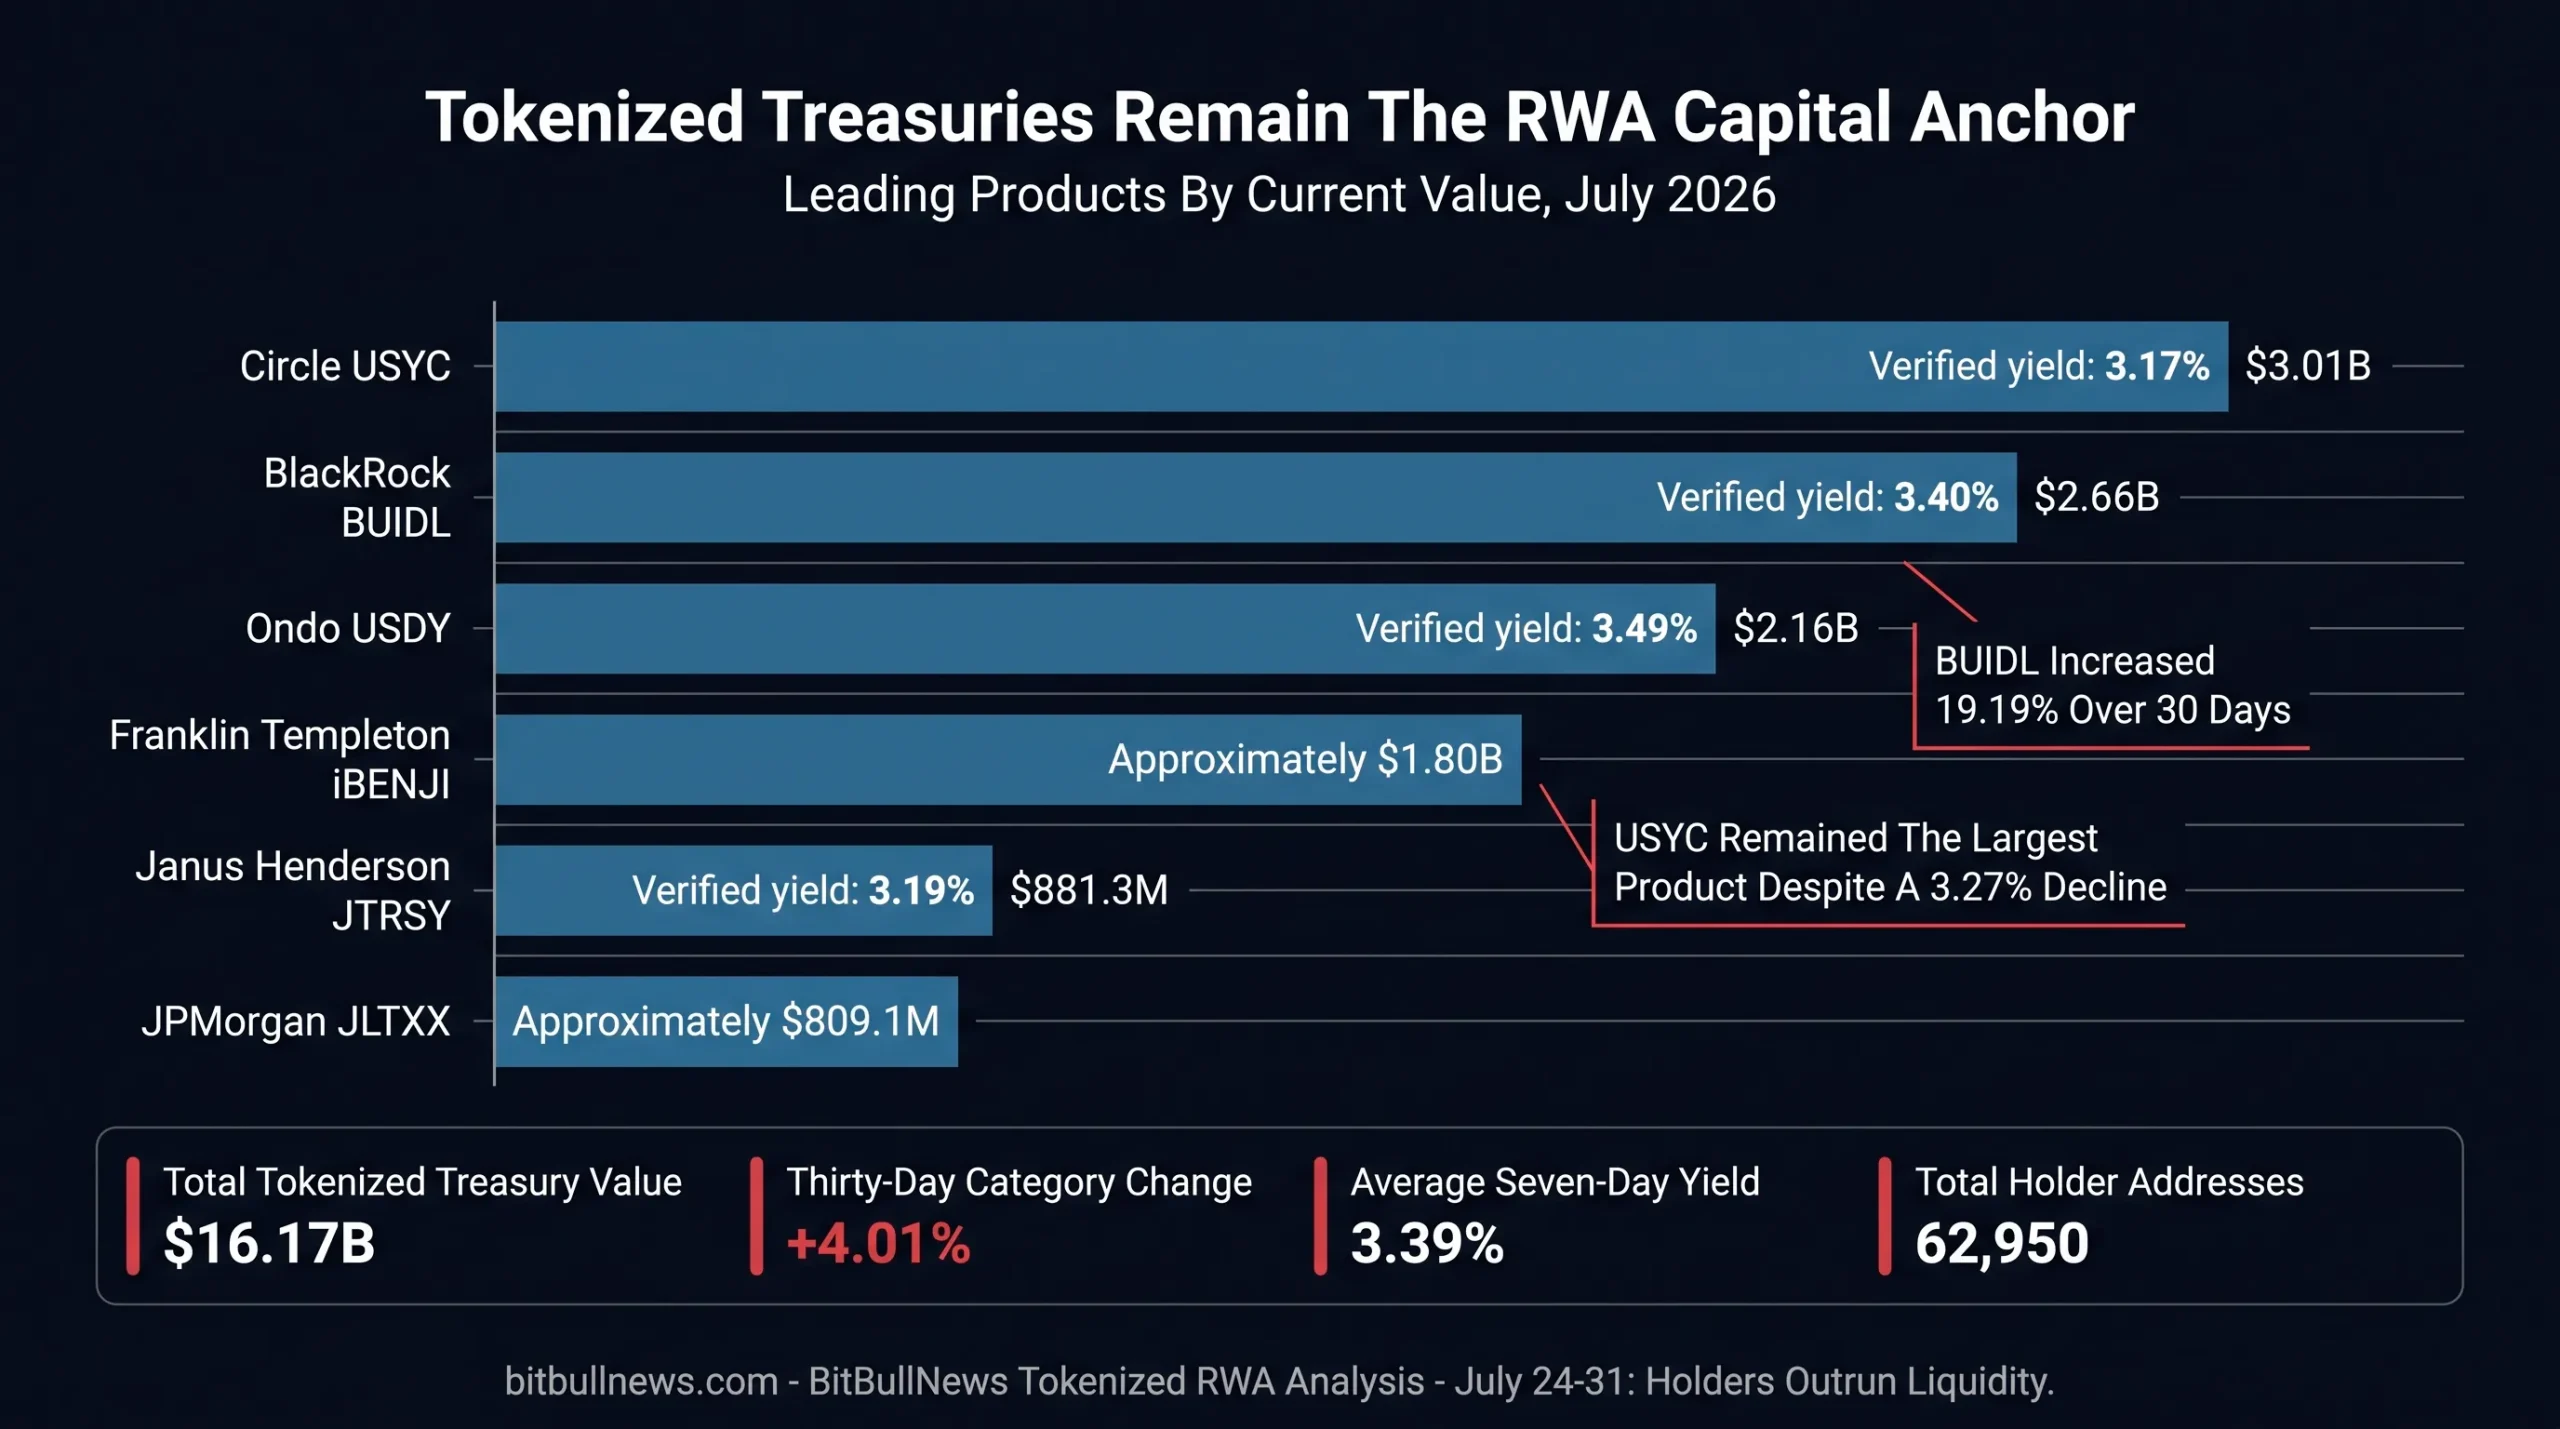
BUIDL was the strongest mover among the leading products, increasing 19.19% over 30 days. USYC remained the largest but declined 3.27%. USDY stayed broadly flat.
The holder counts reveal how institutional this category remains.
USYC and BUIDL together represented more than $5.6 billion while showing fewer than 200 tracked holder addresses. USDY had a smaller value base but more than 15,000 holders.
The contrast reflects product design and distribution. A fund can hold billions through a limited group of approved institutions, while a token built for wider wallet distribution can reach far more addresses with smaller average balances.
Treasury Growth Was Broader Than One Issuer
The platform dashboard recorded positive 30-day flows for Securitize, Franklin Templeton Benji and JPMorgan’s Kinexys-related products. Securitize led all platforms with approximately $843 million of positive net flow, followed by Spiko at $306 million and Figure at $158 million.
That is healthier than a market driven entirely by one fund.
It also reinforces the difference between tokenized cash products and tokenized equities. Treasuries continue attracting institutional capital even when transfer activity across the broader RWA market weakens.
The category’s appeal is straightforward: familiar underlying assets, short duration, visible yield, institutional custody and clearer valuation than private credit or real estate.
Credit Remained Five Times Larger Inside Controlled Systems
Distributed tokenized credit stood at $6.99 billion. Represented credit reached $36.43 billion.
The represented market was therefore approximately 5.2 times larger than the externally transferable market.
Tokenized Credit Structure
| Credit Metric | Current Reading | 30-Day Change | Interpretation |
|---|---|---|---|
| Distributed Credit Value | $6.99B | -0.55% | Transferable credit remained broadly flat |
| Represented Credit Value | $36.43B | +3.67% | Institutional recordkeeping expanded inside controlled platforms |
| Represented-To-Distributed Ratio | Approximately 5.2x | Increased | Most tokenized credit still cannot circulate freely |
| Tracked Credit Assets | 2,535 | — | Category breadth continued expanding |
| Credit Holder Addresses | 191,032 | +0.84% | Ownership growth remained slow |
| STOKR Distributed Value | Approximately $1.30B | Not Displayed | Largest distributed credit platform |
| Maple Distributed Value | Approximately $956.7M | Not Displayed | Large onchain private-credit and lending presence |
| Centrifuge Distributed Value | Approximately $746.5M | Not Displayed | Diversified structured-credit platform |
| Realiz Distributed Value | Approximately $500.0M | Not Displayed | Significant single-platform balance |
| Hastra Distributed Value | Approximately $490.8M | Not Displayed | Growing institutional credit platform |
| Securitize Distributed Value | Approximately $489.1M | Not Displayed | Credit exposure integrated with a broader tokenization platform |
Platform balances are taken from the current RWA.xyz credit dashboard. Values may include several underlying assets or structures.
The represented side remained dominated by large institutional records, including Figure’s tokenized home-equity credit and the DOM X Arizona mining project. These balances show blockchain adoption inside credit administration, but not necessarily liquid secondary markets.
Credit may remain platform-bound longer than Treasuries or public equities.
Borrower privacy, lender consent, suitability rules and transfer restrictions are normal features of private credit. Tokenization can still improve reconciliation and servicing without turning every loan into a freely transferable asset.
Active Strategies Remained Concentrated In Two Products
Active strategies reached $3.52 billion, up 4.03% over 30 days.
The category looked diversified at the platform level, with Ethena, Spiko, OpenTrade, Securitize, Accountable and DigiFT all represented. Asset-level value was far more concentrated.
Active Strategies Concentration
| Active Strategy Asset | Platform | Current Value | Share Of Category |
|---|---|---|---|
| Staked USDe | Ethena | $1.556B | 44.2% |
| Spiko Amundi Overnight Swap Fund EUR | Spiko | $922.6M | 26.2% |
| Spiko Amundi Overnight Swap Fund USD | Spiko | $149.4M | 4.2% |
| Mantle Index Four Fund | Securitize | $118.5M | 3.4% |
| Peakwater Volatility Alpha Fund | DigiFT | $101.7M | 2.9% |
| Hyperithm Delta Neutral Vault | Accountable | $99.9M | 2.8% |
| Bitwise Crypto Carry Fund | Superstate | $66.8M | 1.9% |
| Category Total | — | $3.52B | 100.0% |
Staked USDe and Spiko’s euro fund accounted for approximately 70.4% of active-strategy value.
The category is not yet a broad marketplace of equally scaled strategies.
One yield-bearing crypto-dollar product and one European money-market strategy control more than two-thirds of value. Performance, redemption or classification changes in either product can materially move the category total.
For allocators, gross category value therefore provides less information than strategy composition, custody, liquidity windows and underlying risk.
Private Markets Expanded With Narrow Ownership
Tokenized private equity and venture capital reached $2.18 billion, up 4.88% over 30 days. The category had only 7,234 tracked holder addresses.
Securitize controlled approximately $1.2 billion at the platform level. BCAP alone represented about $957.3 million, or 43.9% of category value. BCAP, TTN-III and HERA-I-E together accounted for approximately 73.7%.
This is institutional concentration, not mass-market distribution.
Private-market tokens can improve subscription processing, cap-table administration and eligible-investor transfers. Their underlying funds remain subject to lockups, valuation intervals and restricted buyer pools.
The token can transfer faster than the economic exposure becomes liquid.
Commodities Grew In Addresses But Lost Turnover
Tokenized commodities held $4.61 billion of distributed value. Monthly transfer volume fell 44.51% to $3.26 billion, while monthly active addresses increased 72.02% to 59,562.
That combination resembles the stock market’s divergence, although it is less extreme.
More addresses were active, but the average economic value moving through the market declined. Gold-backed products still dominated through Tether and Paxos.
The segment needs stronger turnover and more issuer diversity before holder growth can be treated as a durable liquidity improvement.
Real Estate Remained Stagnant
Tokenized real estate held $202.63 million of distributed value and $279.84 million of represented value. Distributed value was essentially flat over 30 days, while monthly active addresses declined 18.89%.
The category remains constrained by fragmented property structures, local securities rules, valuation frequency and limited secondary buyers.
Tokenization may improve administration. It has not yet solved the economic illiquidity of individual properties and private real-estate vehicles.
Europe Launched A Bank-Owned Settlement Network
Regulated Layer One launched on July 28 as a Luxembourg-based European Cooperative Society.
Its ten founding institutions were ABN AMRO, Cecabank, Chartered Investment, Crédit Mutuel Alliance Fédérale, DekaBank, DZ BANK, LBBW, Natixis CIB, SC Ventures and Seturion. Each founder received an equal governance voice, while SWIAT became the network’s technical operator.
RL1 inherited SWIAT infrastructure that had processed more than 50 transactions worth over €700 million during the preceding three years.
That figure is historical activity on the inherited infrastructure. It is not post-launch RL1 volume.
The network is designed for tokenized bonds, funds, collateral, stablecoins, repo, securities lending, derivatives margin and atomic delivery-versus-payment.
The structure addresses a problem public blockchains do not solve on their own: institutions need shared governance, identity, legal accountability and predictable operating rules before moving large regulated positions onto a common ledger.
Ondo Separated Private Execution From Public Settlement
Ondo introduced Ondo Network during the same reporting period.
The architecture processes orders inside trusted execution environments, or secure hardware enclaves, while using multiple attestors and public blockchains for verification, asset transfers and settlement. Ondo Perps became the network’s first application.
The model aims to combine private execution with non-custodial settlement.
It also introduces a different trust structure from a fully replicated public blockchain. Users must evaluate the security of the hardware environment, the attestor set, software updates and the rules governing failure or disagreement.
That is not necessarily weaker. It is a trade-off designed for institutional execution requirements such as confidentiality, speed and controlled order handling.
Institutional Infrastructure Comparison
| Design Dimension | Regulated Layer One | Ondo Network |
|---|---|---|
| Launch | July 28, 2026 | Introduced During The July 24–31 Period |
| Primary Objective | Shared regulated settlement network for financial institutions | Private execution with public verification and settlement |
| Governance | Member-owned European Cooperative Society with equal founder voice | Ondo-led architecture with trusted execution environments and attestors |
| Technical Operator | SWIAT | Ondo ecosystem infrastructure |
| Founding Or Initial Participants | Ten banks and financial institutions | Ondo Network and initial Ondo Perps application |
| Execution Model | Permissioned institutional DLT workflows | Private execution inside secure hardware enclaves |
| Settlement Model | Shared ledger supporting atomic delivery-versus-payment | Public-blockchain asset movement and non-custodial settlement |
| Intended Assets And Uses | Bonds, funds, RWAs, stablecoins, collateral, repo, securities lending and margin | Tokenized assets, trading and derivatives applications |
| Existing Proof Point | Inherited infrastructure processed more than 50 transactions worth over €700M | Ondo Perps launched as the first application |
| Key Dependency | Member onboarding, legal interoperability and cross-institution governance | Hardware security, attestor governance and execution-layer resilience |
| Main Market Signal | Banks are creating jointly governed tokenization infrastructure | Tokenization is separating execution privacy from public settlement |
RL1’s €700 million figure refers to historical transactions on inherited SWIAT infrastructure, not volume generated after the July 28 launch.
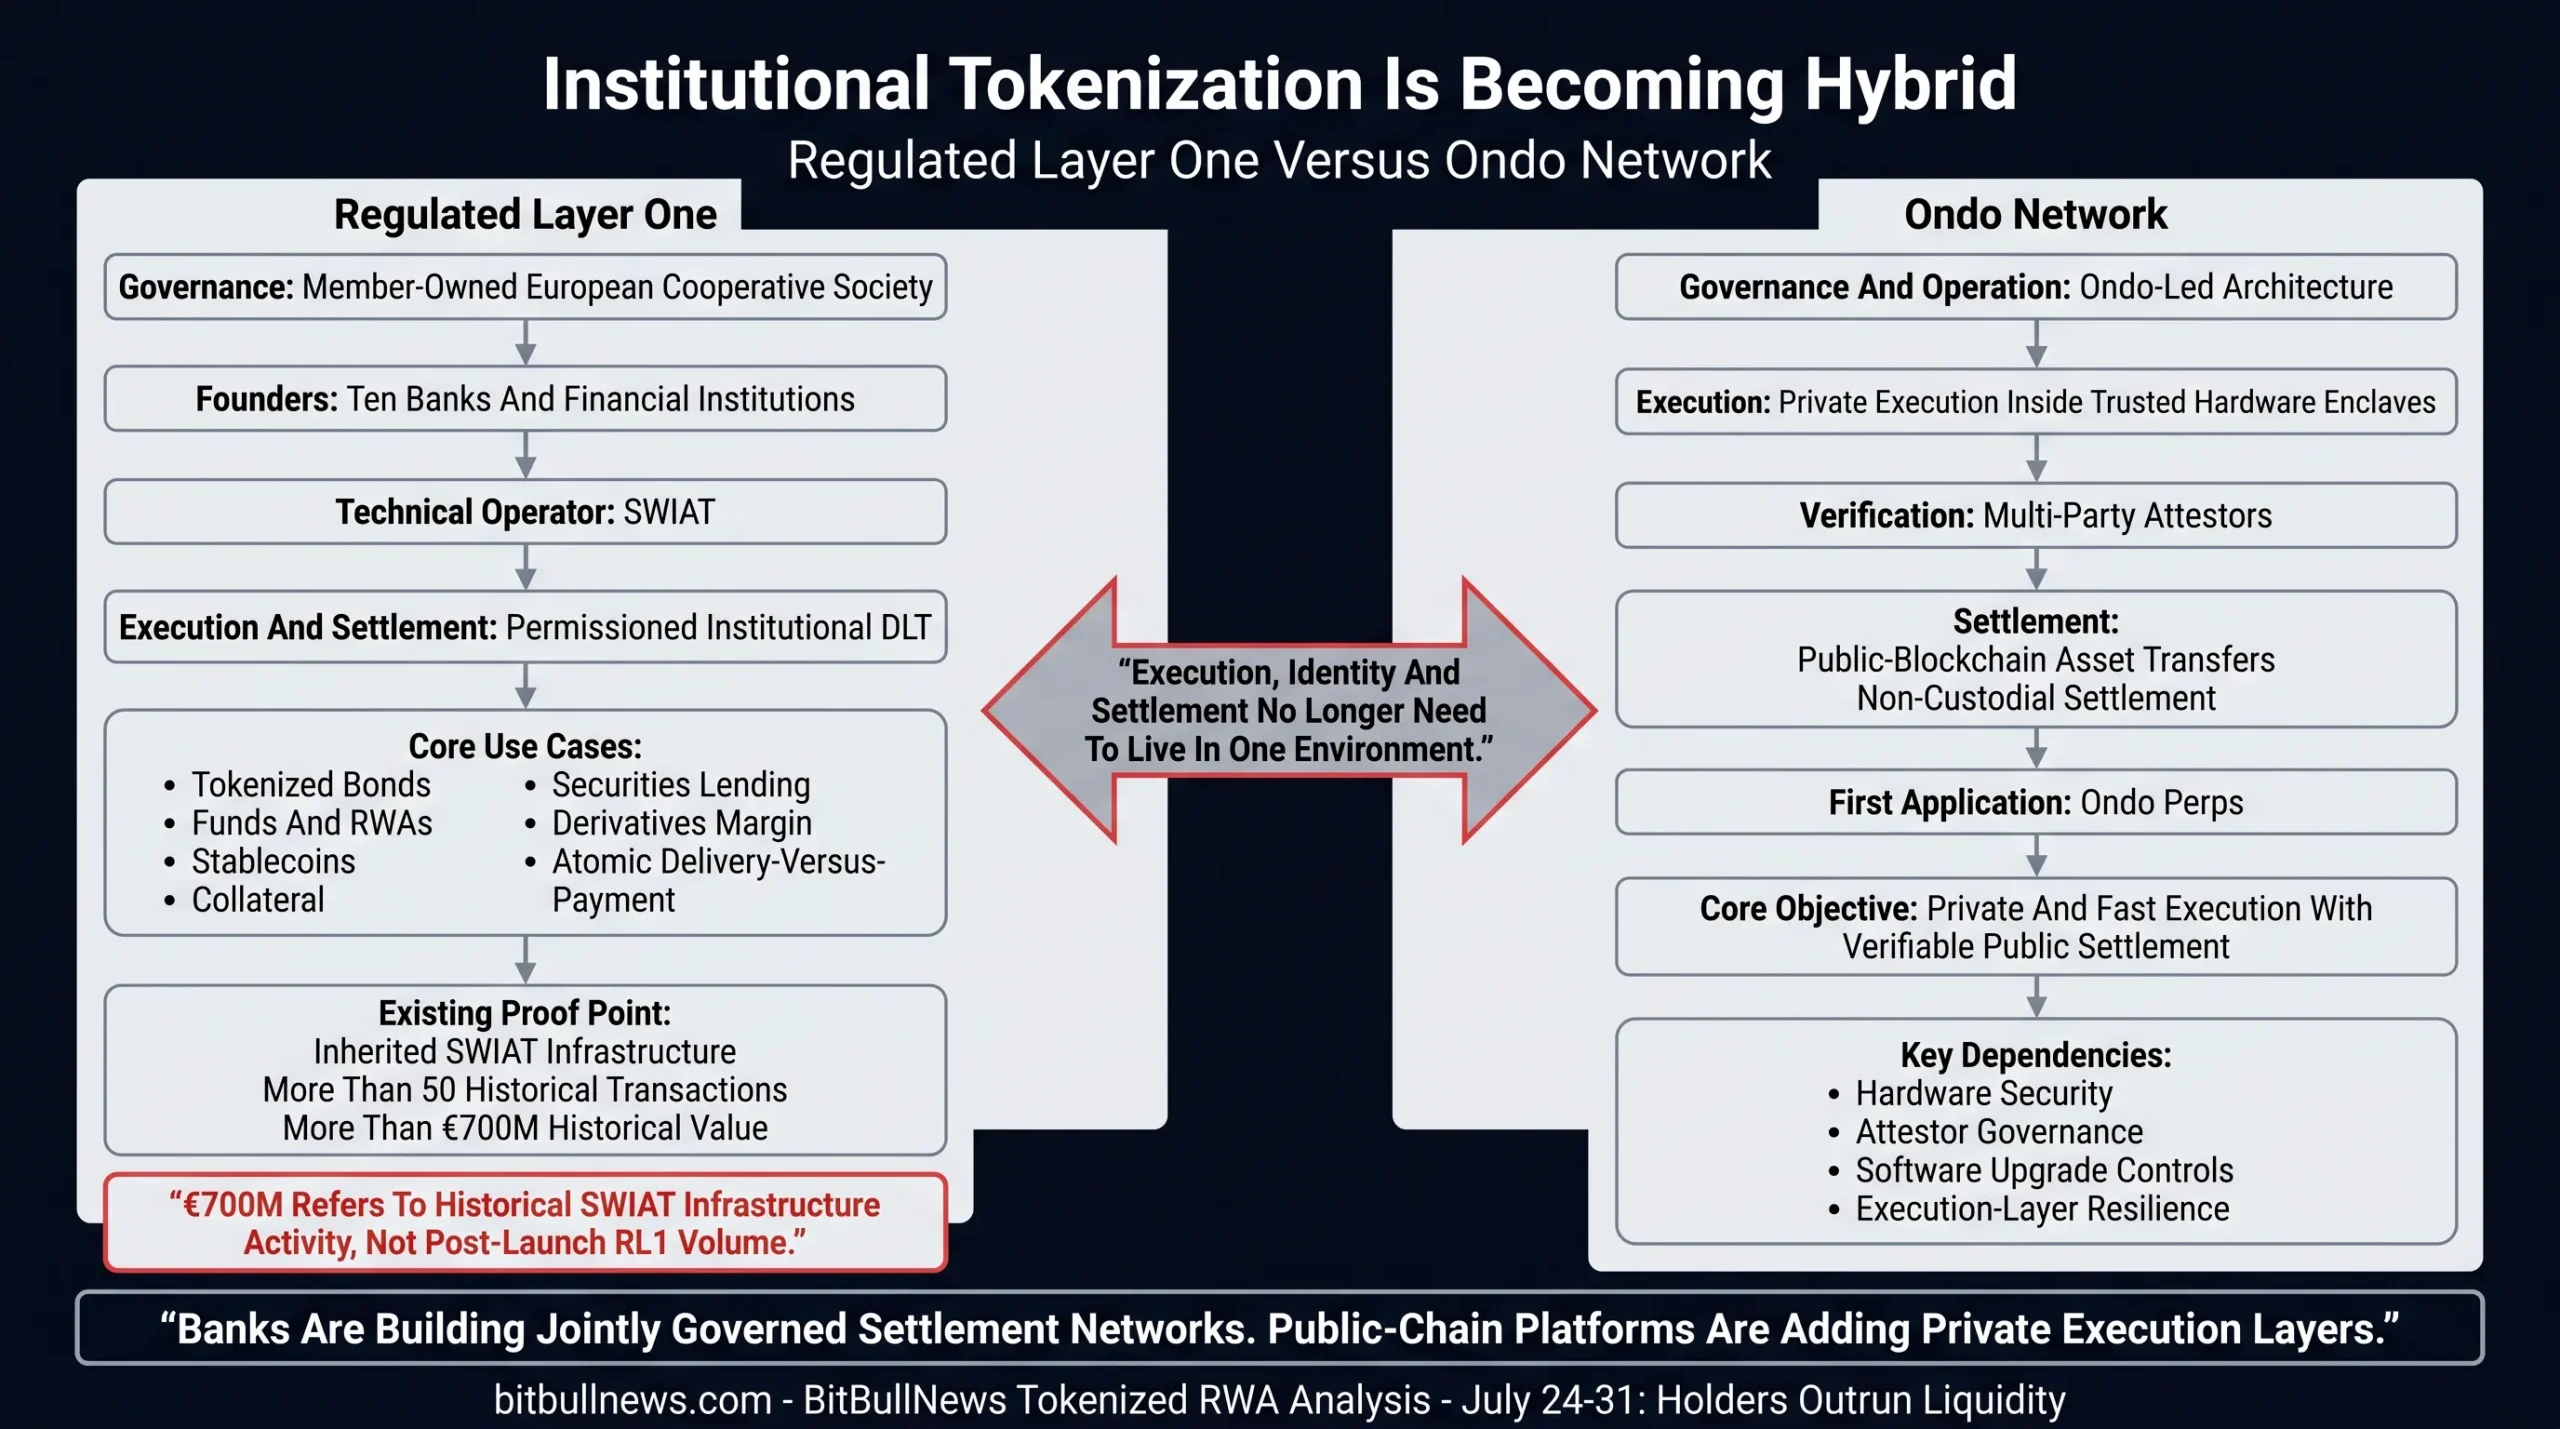
The two systems point toward the same conclusion.
Institutional tokenization is becoming hybrid.
Banks are not simply moving every process onto an unrestricted public chain. Public-chain issuers are not insisting that execution, settlement, identity and market data must all use one transparent environment.
The emerging model separates functions:
- Private or permissioned execution.
- Controlled identity and eligibility.
- Shared or public settlement.
- Verifiable asset ownership.
- Regulated custody and transfer.
- Programmable collateral and payments.
The market is moving from “which blockchain wins?” toward “which function belongs on which infrastructure?”
What Institutional Allocators Should Watch Next
Whether Holder Growth Produces Repeat Activity
Tokenized-stock holder addresses increased rapidly while transfer volume fell.
The next confirmation would be rising monthly active addresses, repeat transactions and higher turnover without depending on one distribution campaign or newly indexed contract set.
Whether Robinhood Balances Grow
Robinhood already has one of the largest RWA holder footprints.
The stronger signal would be growth in value per address and distributed asset value, not holder count alone. A network with hundreds of thousands of addresses and tens of millions of dollars remains a distribution experiment rather than a deep capital venue.
Whether Treasury Growth Broadens
BUIDL expanded rapidly while USYC declined.
Sustained category growth across Franklin Templeton, JPMorgan, Janus Henderson, Ondo and other issuers would make the Treasury segment less dependent on a small group of leading products.
Whether Credit Becomes Transferable
Represented credit is more than five times larger than distributed credit.
The next stage is not moving every loan onto open markets. It is creating controlled secondary transfer between eligible institutions while preserving borrower confidentiality and lender consent.
Whether RL1 Reports Post-Launch Transactions
The inherited SWIAT history proves that the technical foundation has been used.
RL1 now needs its own issuance, settlement, collateral and participant data. Historical infrastructure volume should not be presented as activity generated by the new cooperative.
Whether Ondo Publishes Execution Metrics
Ondo Network’s architecture is institutionally relevant, but public evidence remains limited.
Useful disclosures would include execution latency, failure rates, attestor participation, enclave-upgrade controls, settlement times and the treatment of hardware or attestor outages.
Whether Transfer Volume Recovers
Stocks, commodities, Ethereum and Solana all showed weaker activity metrics.
Market value can rise without liquid secondary markets. A stronger tokenization cycle requires both assets outstanding and reliable turnover.
RWA Risk Dashboard
| Signal | Current Reading | Interpretation | Confirmation Needed |
|---|---|---|---|
| Distributed RWA Value | $37.35B | Transferable market continued expanding | Growth persists inside consistent data coverage |
| RWA Holder Addresses | 1.53M, +22.29% Between BBN Snapshots | Distribution grew much faster than value | Repeat activity and higher average balances |
| Represented Value | $411.51B Network View / $358.71B Platform View | Dashboard modules differ materially | Better module reconciliation and methodology disclosure |
| Tokenized Treasuries | $16.17B, +4.01% Over 30 Days | Remained the institutional capital anchor | Broader multi-issuer growth |
| Tokenized Stocks | $2.26B | Category reached more wallets | Transfer volume and secondary liquidity recover |
| Stock Transfer Volume | $3.28B, -64.46% Over 30 Days | Activity contracted sharply | Sustained turnover across several platforms |
| Stock Holder Addresses | Approximately 930,620, +110.75% | Distribution accelerated | Holder growth converts into active usage |
| Top Four Stock Platforms | Approximately 95.9% Of Value | Market remains highly concentrated | Deeper liquidity across additional providers |
| Robinhood Holder Share | Approximately 23.3% Of All RWA Holders | Retail distribution scaled quickly | Value per address rises from approximately $76 |
| Distributed Credit | $6.99B | Transferable credit was flat | New issuance and controlled secondary transfers |
| Represented Credit | $36.43B | Ledger adoption remains much larger than liquid tokenization | More assets gain external transferability |
| Active Strategies | $3.52B | Category expanded modestly | Growth beyond sUSDe and Spiko |
| Top Two Active Strategies | Approximately 70.4% Of Category | Concentration remains high | Broader strategy and manager participation |
| Private Equity And VC | $2.18B Across 7,234 Holders | Large value with narrow institutional ownership | Better redemption and secondary-transfer evidence |
| Commodity Transfer Volume | -44.51% Over 30 Days | Turnover weakened | Activity recovers across more than gold-backed products |
| RL1 | Launched With Ten Founders | Bank-owned settlement infrastructure moved live | Post-launch transaction and asset data |
| Ondo Network | Private Execution With Public Settlement | Hybrid institutional architecture is emerging | Independent operating and performance evidence |
Distribution Without Depth: The New RWA Reality
Tokenized RWA value increased this week. Distribution increased much faster. Liquidity did not.
Distributed assets reached $37.35 billion, approximately 1.25% above the previous BitBullNews snapshot. Holder addresses increased 22.29% to more than 1.53 million.
Tokenized stocks drove the clearest distribution signal. Holder addresses rose above 930,000. Monthly transfer volume fell 64.46% to $3.28 billion.
That is growth in reach, not proof of deeper markets.
Robinhood made the divergence impossible to ignore. Its network held approximately 357,688 RWA holder addresses — almost one-quarter of the tracked market — against only $27.25 million of distributed value. Ethereum held $17.05 billion across fewer addresses.
Treasuries remained the capital anchor at $16.17 billion. BUIDL expanded, USYC retained the top position and several banks and asset managers continued building meaningful products. Credit remained far larger in represented form than as transferable tokens. Active strategies remained dominated by Staked USDe and Spiko.
The infrastructure layer delivered the week’s strongest institutional progress.
Ten financial institutions launched RL1 as a jointly governed European settlement network. Ondo introduced an architecture that keeps execution private while using public blockchains for verification and settlement.
Those systems reflect where the market is heading.
Tokenization will not converge on one chain, one legal wrapper or one execution model. Institutions are separating execution, identity, custody and settlement according to the requirements of each transaction.
The next phase will not be measured by how many assets receive tokens.
It will be measured by whether those assets can trade, settle, serve as collateral and move between eligible investors without breaking liquidity, legal ownership or operational control.
Data Sources & References
- RWA.xyz — Network Analytics
- RWA.xyz — Platform Analytics
- RWA.xyz — Tokenized U.S. Treasuries
- RWA.xyz — Tokenized Stocks
- RWA.xyz — Tokenized Credit
- RWA.xyz — Active Strategies
- RWA.xyz — Tokenized Commodities
- RWA.xyz — Private Equity And Venture Capital
- RWA.xyz — Tokenized Real Estate
- RWA.xyz — Robinhood Network
- RWA.xyz — Ethereum Network
- RWA.xyz — Solana Network
- RWA.xyz — Tokenization-Type Methodology
- Regulated Layer One — Official Website
- SWIAT — Regulated Layer One Launch
- Ondo Finance — Introducing Ondo Network
- Tokenized But Illiquid? Evidence From RWA Markets
- Beyond TVL: Risk Scoring For Tokenized RWAs