


Content
Tokenization moved beyond issuance this week.
Tokenized equities began serving as collateral inside live DeFi lending markets. Mubadala Capital brought a private-markets strategy onchain across three networks. The transferable RWA market expanded to $36.89 billion, while the number of holders climbed above 1.25 million.
The headline growth was real, but it was not all new capital.
RWA.xyz’s active-strategies category almost doubled from the previous BitBullNews snapshot after Staked USDe appeared as a $1.54 billion distributed asset. Tokenized-stock statistics also changed sharply as the category’s dedicated dashboard expanded coverage and holder tracking. RWA.xyz explicitly warns that assets can be reclassified as new information becomes available.
The cleanest signal therefore came from utility rather than total value. Approximately $53 million of tokenized equities was being used as collateral on Solana lending protocols by July 23, more than double the $23.1 million recorded five days earlier.
Data Cutoff: Market-wide figures use the latest RWA.xyz snapshot captured after the July 24 reporting period. Category figures refresh on different schedules, with several available as of July 21–25. Comparisons with the previous BitBullNews monitor should be treated as snapshot changes rather than audited fund-flow calculations.
RWA Market Scorecard
| Market Metric | Latest Reading | Previous BBN Snapshot | Snapshot Change |
|---|---|---|---|
| Distributed Asset Value | $36.89B | $34.14B | +$2.75B, +8.1% |
| Represented Asset Value | $366.97B | $376.93B | -$9.96B, -2.6% |
| Total RWA Holders | 1,254,488 | 1,023,183 | +231,305, +22.6% |
| Stablecoin Value | $298.75B | $299.30B | -$0.55B, -0.2% |
| Tracked Networks | 39 | 38 | +1 |
| Tokenized U.S. Treasuries | $15.86B | $15.16B | Approximately +$700M |
| Tokenized Stocks | $1.86B | $1.08B | Coverage And Market Expansion |
| Tokenized Credit | $6.98B | $7.03B | Approximately -$50M |
| Active Strategies | $3.50B | $1.77B | +$1.73B, Mostly Classification-Driven |
RWA.xyz defines distributed assets as tokens that can leave the issuing platform and transfer between eligible wallets. Represented assets remain platform-bound, with blockchain serving primarily as a recordkeeping or reconciliation layer. Classifications can change as products become transferable or as the data provider obtains new information.
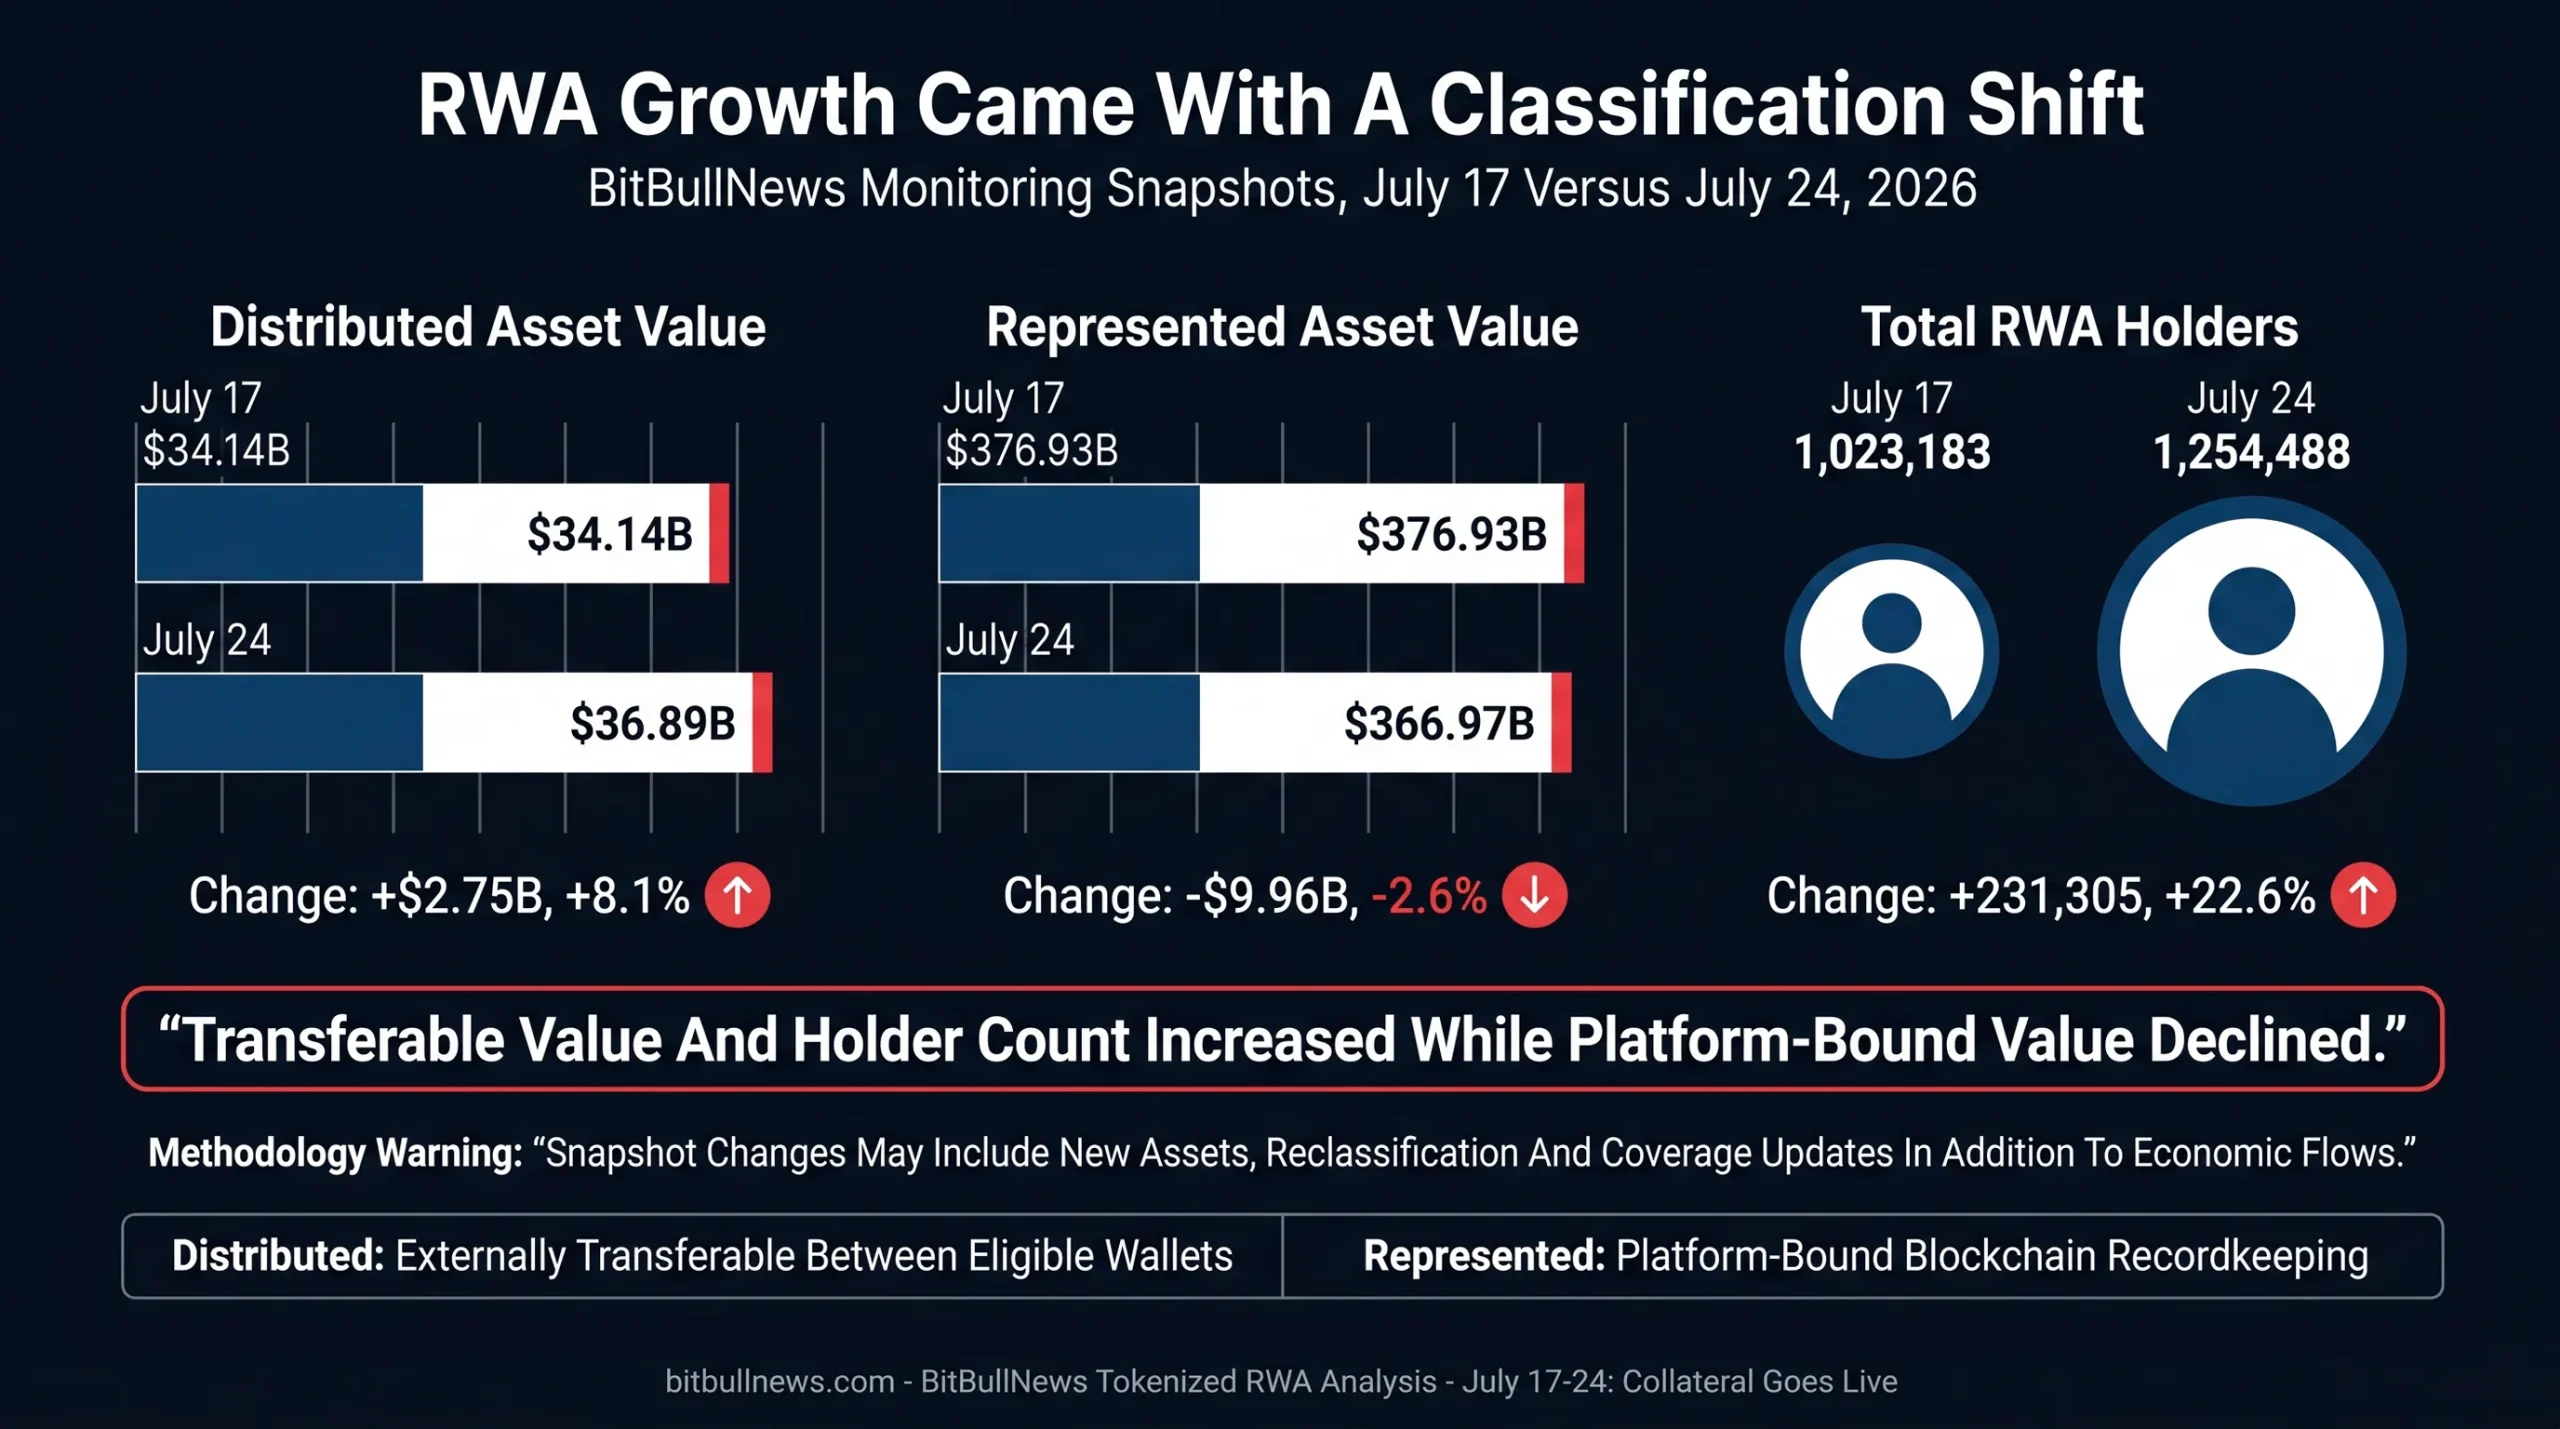
Grouped Comparison Showing Distributed Asset Value, Represented Asset Value And Total RWA Holders In The July 17 And July 24 Snapshots. Add A Warning That Classification Changes Can Affect Week-Over-Week Comparisons.
Transferable Value Grew While Represented Value Fell
Distributed RWA value increased by approximately 8.1% between BitBullNews monitoring snapshots, rising from $34.14 billion to $36.89 billion.
Represented value moved in the opposite direction, falling from $376.93 billion to $366.97 billion. The gap narrowed from roughly 11 times distributed value to just under 10 times.
That does not automatically mean nearly $10 billion left institutional tokenization systems.
RWA.xyz’s methodology allows represented assets to move into the distributed category when they become externally transferable. Classification can also change when new information becomes available. Changes in coverage, asset status and underlying valuations can therefore move headline totals without corresponding one-for-one subscriptions or redemptions.
The holder data was more clearly positive. Tracked RWA holders increased by more than 231,000, or 22.6%, to approximately 1.25 million. Tokenized equities accounted for much of that expansion, although dashboard changes and broader contract coverage also contributed.
For investors, the distinction is straightforward:
- Distributed value measures assets capable of leaving the issuing platform.
- Represented value captures controlled or platform-bound blockchain records.
- Holder count measures addresses, not necessarily unique individuals or institutions.
- Changes between snapshots can include both economic flows and methodology updates.
Active Strategies Nearly Doubled — But New Capital Was Not The Whole Story
The active-strategies category reached $3.50 billion, compared with $1.77 billion in the previous BitBullNews monitor.
That represents a snapshot increase of $1.73 billion, or 97.7%.
Staked USDe now accounts for approximately $1.54 billion of the category. Its presence alone explains roughly 89% of the apparent increase. The next-largest platform, Spiko, holds approximately $1.1 billion across its products.
| Active Strategy Asset | Platform | Current Value |
|---|---|---|
| Staked USDe | Ethena | $1.545B |
| Spiko Amundi Overnight Swap Fund EUR | Spiko | $865.8M |
| Spiko Amundi Overnight Swap Fund USD | Spiko | $149.5M |
| Mantle Index Four Fund | Securitize | $120.2M |
| Peakwater Volatility Alpha Fund | DigiFT | $98.1M |
| Hyperithm Delta Neutral Vault | Accountable | $92.6M |
| Bitwise Crypto Carry Fund | Superstate | $67.9M |
The numbers should not be presented as $1.73 billion of fresh institutional subscriptions.
The previous monitor did not include Staked USDe inside the active-strategy total. Its appearance in the current category accounts for most of the week-over-week difference. Some genuine expansion occurred — including growth in Spiko and several newer strategy vaults — but the category jump was primarily a classification and coverage event.
This is exactly why tokenized RWA analysis cannot rely on total value alone.
A data provider may legitimately update its classification when a token’s transferability, legal structure or economic function becomes clearer. That improves the dataset, but it can create an artificial growth spike in a weekly time series.
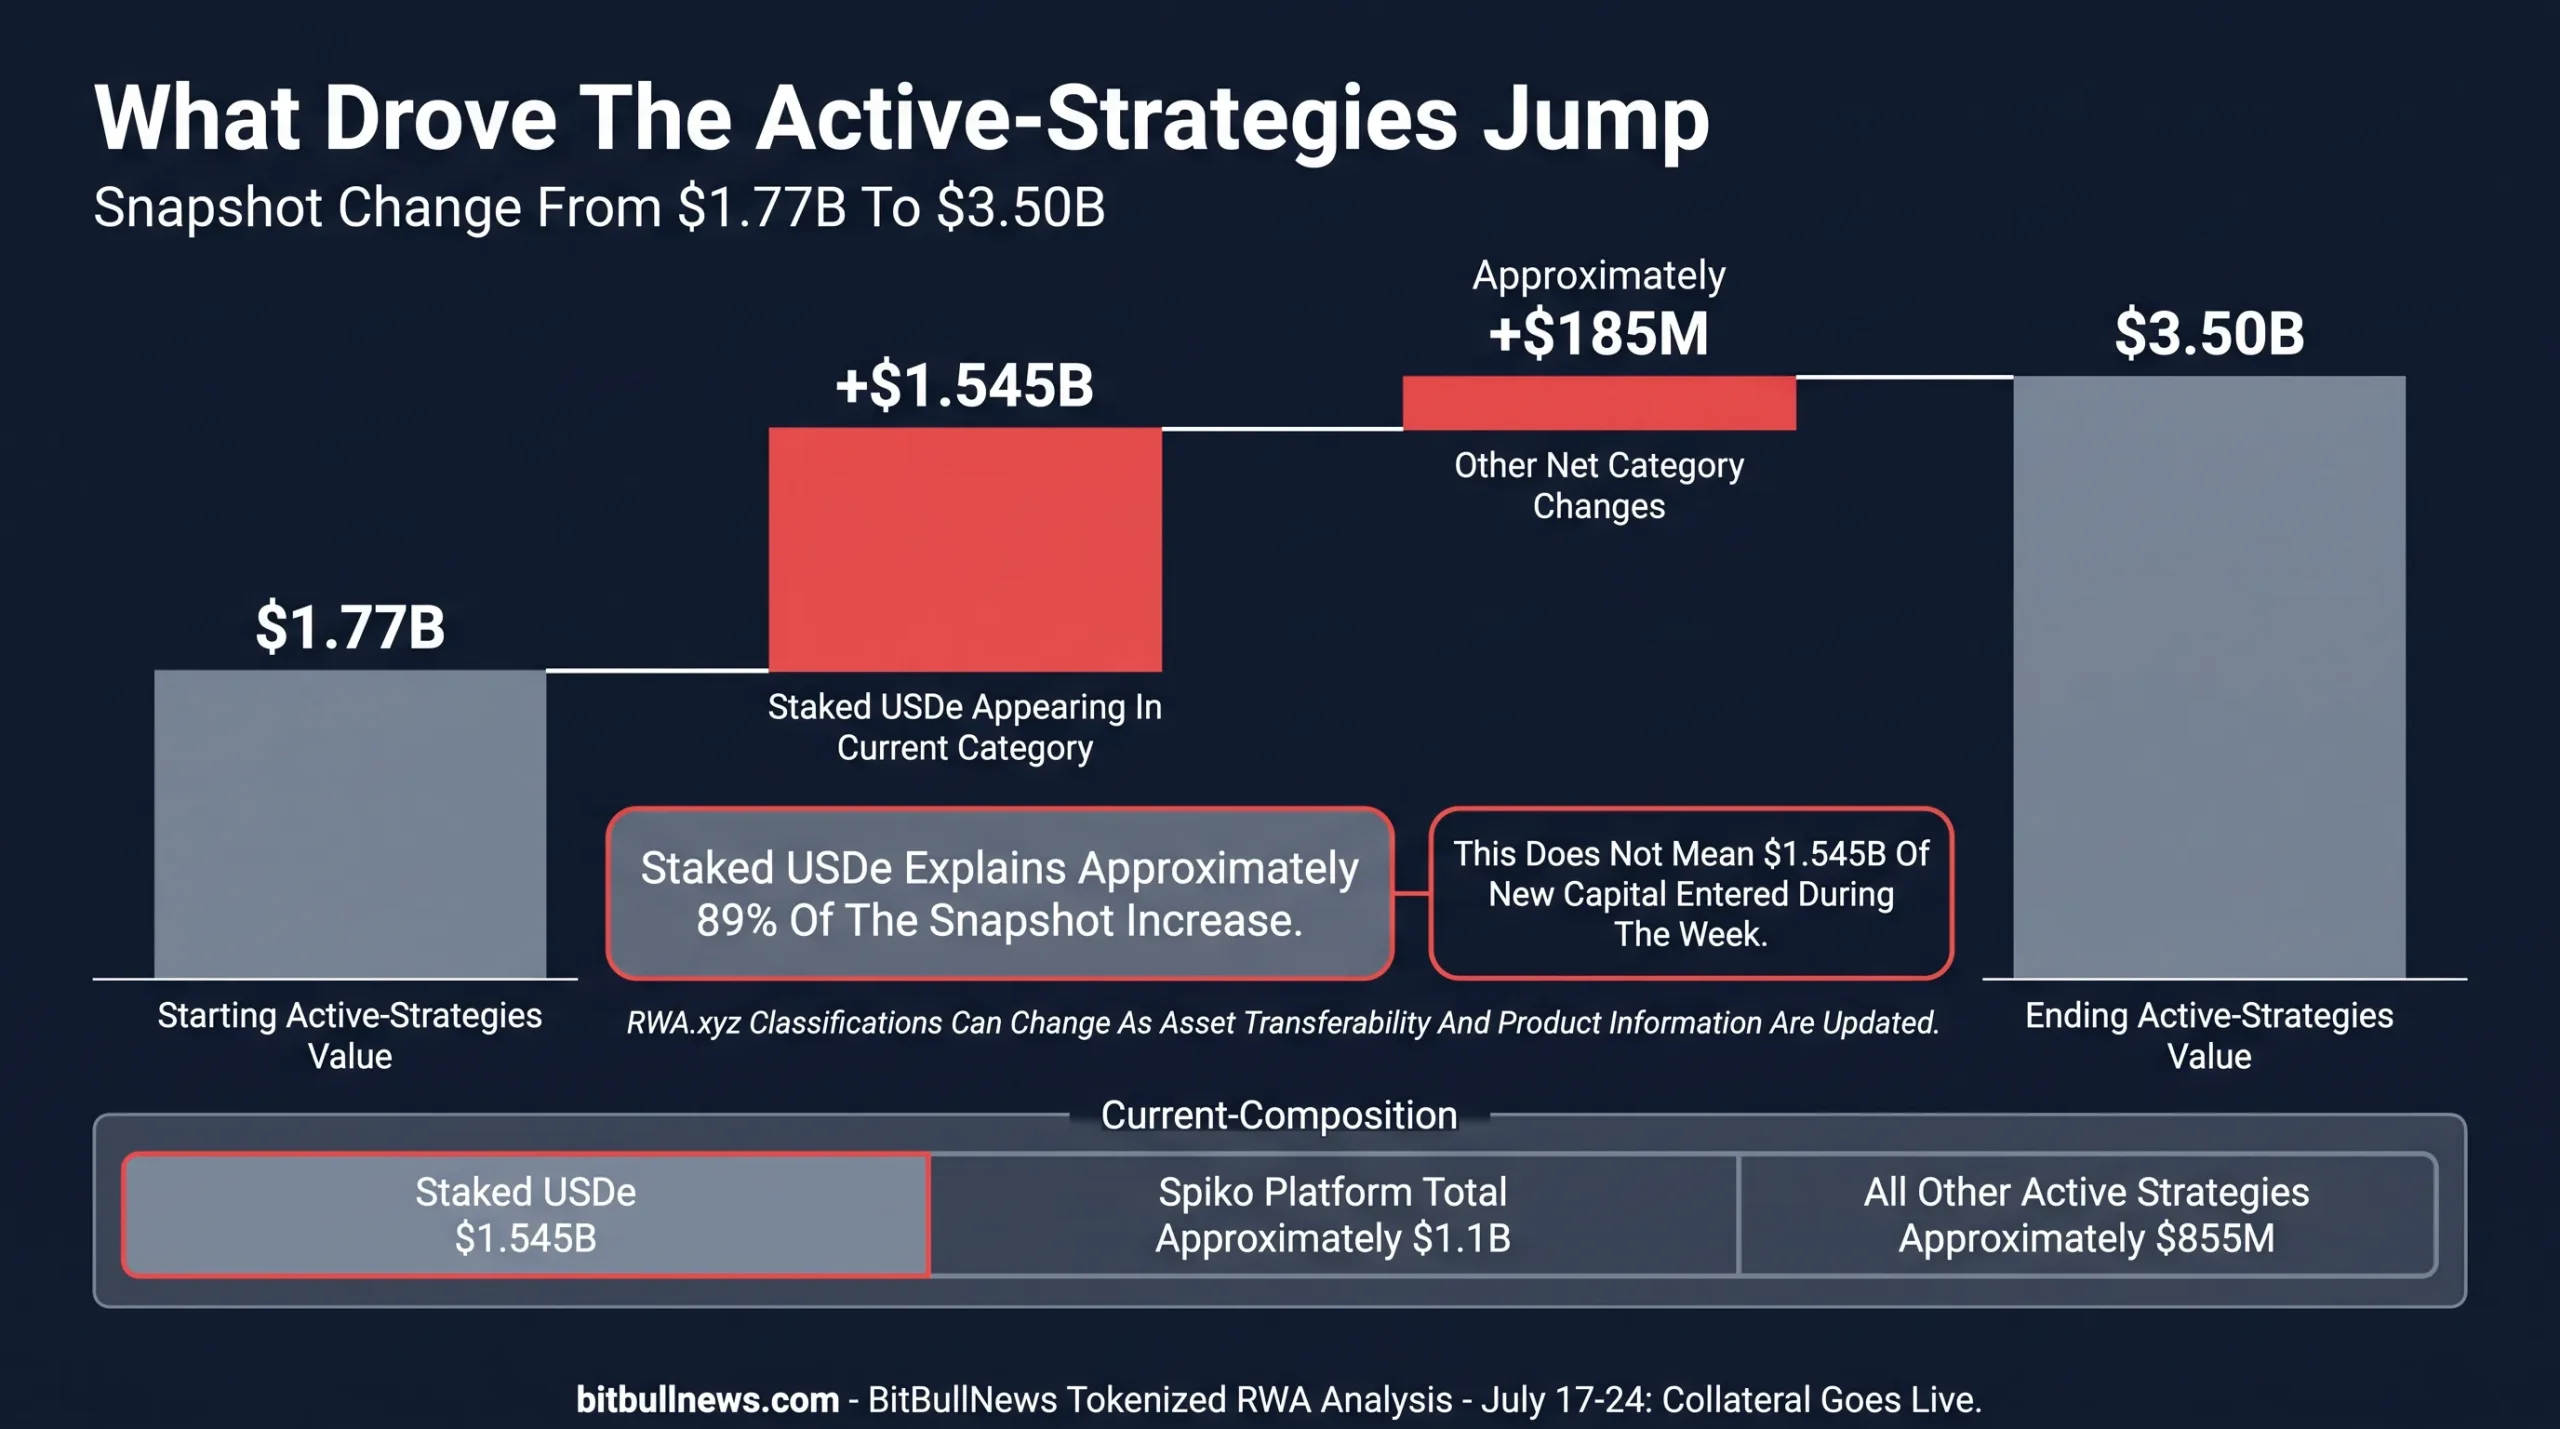
Waterfall Chart Starting With $1.77B In The Previous Active-Strategies Snapshot, Adding $1.545B For Staked USDe And Approximately $185M Of Other Net Changes To Reach $3.50B. Label The Staked USDe Component As A Classification And Coverage Effect, Not Confirmed New Fund Flow.
Tokenized Stocks Remained The Fastest-Moving RWA Segment
Tokenized equities and ETFs held approximately $1.86 billion in distributed value in the July 22 snapshot, up 15.1% over 30 days.
Monthly transfer volume reached $8.00 billion, an increase of 31.75%. The number of holders rose 75.71% to approximately 671,490. Monthly active addresses moved in the opposite direction, declining 22.04% to 168,368.
| Tokenized Stock Metric | Current Reading | 30-Day Change |
|---|---|---|
| Distributed Value | $1.86B | +15.10% |
| Represented Value | $20.25M | +6.41% |
| Monthly Transfer Volume | $8.00B | +31.75% |
| Holders | 671,490 | +75.71% |
| Monthly Active Addresses | 168,368 | -22.04% |
The combination is constructive but uneven.
Value, transfer volume and holders increased. The number of addresses actively transacting during the month declined. That implies ownership broadened faster than recurring participation.
New holders may be buying and retaining exposure rather than trading it frequently. Some of the holder growth may also reflect expanded dashboard coverage, newly tracked contracts or distribution campaigns.
The market is becoming larger. It is not yet becoming uniformly more active.
Solana Dominated Tokenized Equity Activity
RWA.xyz launched a dedicated tokenized-stock dashboard during the reporting period. Data reported at launch placed approximately 95% of global onchain tokenized-equity volume on Solana.
The network held around $1.85 billion in tokenized-stock value and generated approximately $8.28 billion in monthly transfer volume. Ondo represented 46.6% of the value tracked in that snapshot, while xStocks controlled another 26.4%.
Concentration at the network and platform levels is therefore substantial.
A market can have hundreds of thousands of holders while still depending heavily on:
- One blockchain for settlement.
- Two platforms for most outstanding value.
- A limited set of oracle providers.
- A small number of lending and trading venues.
- Issuer-controlled transfer and compliance mechanisms.
That concentration is not necessarily a weakness during the market’s early stage. It does mean operational problems at a leading network, issuer or protocol would affect a large share of tokenized-equity activity.
Tokenized Equities Entered The Credit Stack
The strongest development this week came from lending markets.
Tokenized equities deposited as collateral on Solana reached approximately $53 million on July 23, up from $23.1 million on July 18. That represents growth of roughly 129% in five days.
| Solana Tokenized Equity Collateral | Current Value | Share Of Tracked Collateral |
|---|---|---|
| Kamino Finance | More Than $31M | Approximately 58.5% |
| Jupiter Lend | Approximately $20M | Approximately 37.7% |
| Other Positions | Approximately $2M | Approximately 3.8% |
| Total | $53M | 100% |
The collateral represented only about 2.9% of the $1.85 billion tokenized-stock market reported on Solana. It is a small share, but it is the right type of growth.
Holding a tokenized share provides investment exposure. Borrowing stablecoins against it makes the asset part of an onchain credit system.
That opens several potential uses:
- Accessing liquidity without selling the equity position.
- Using stock exposure as working collateral.
- Building leveraged or hedged portfolios onchain.
- Moving capital between equity, stablecoin and yield markets.
- Automating margin and liquidation procedures.
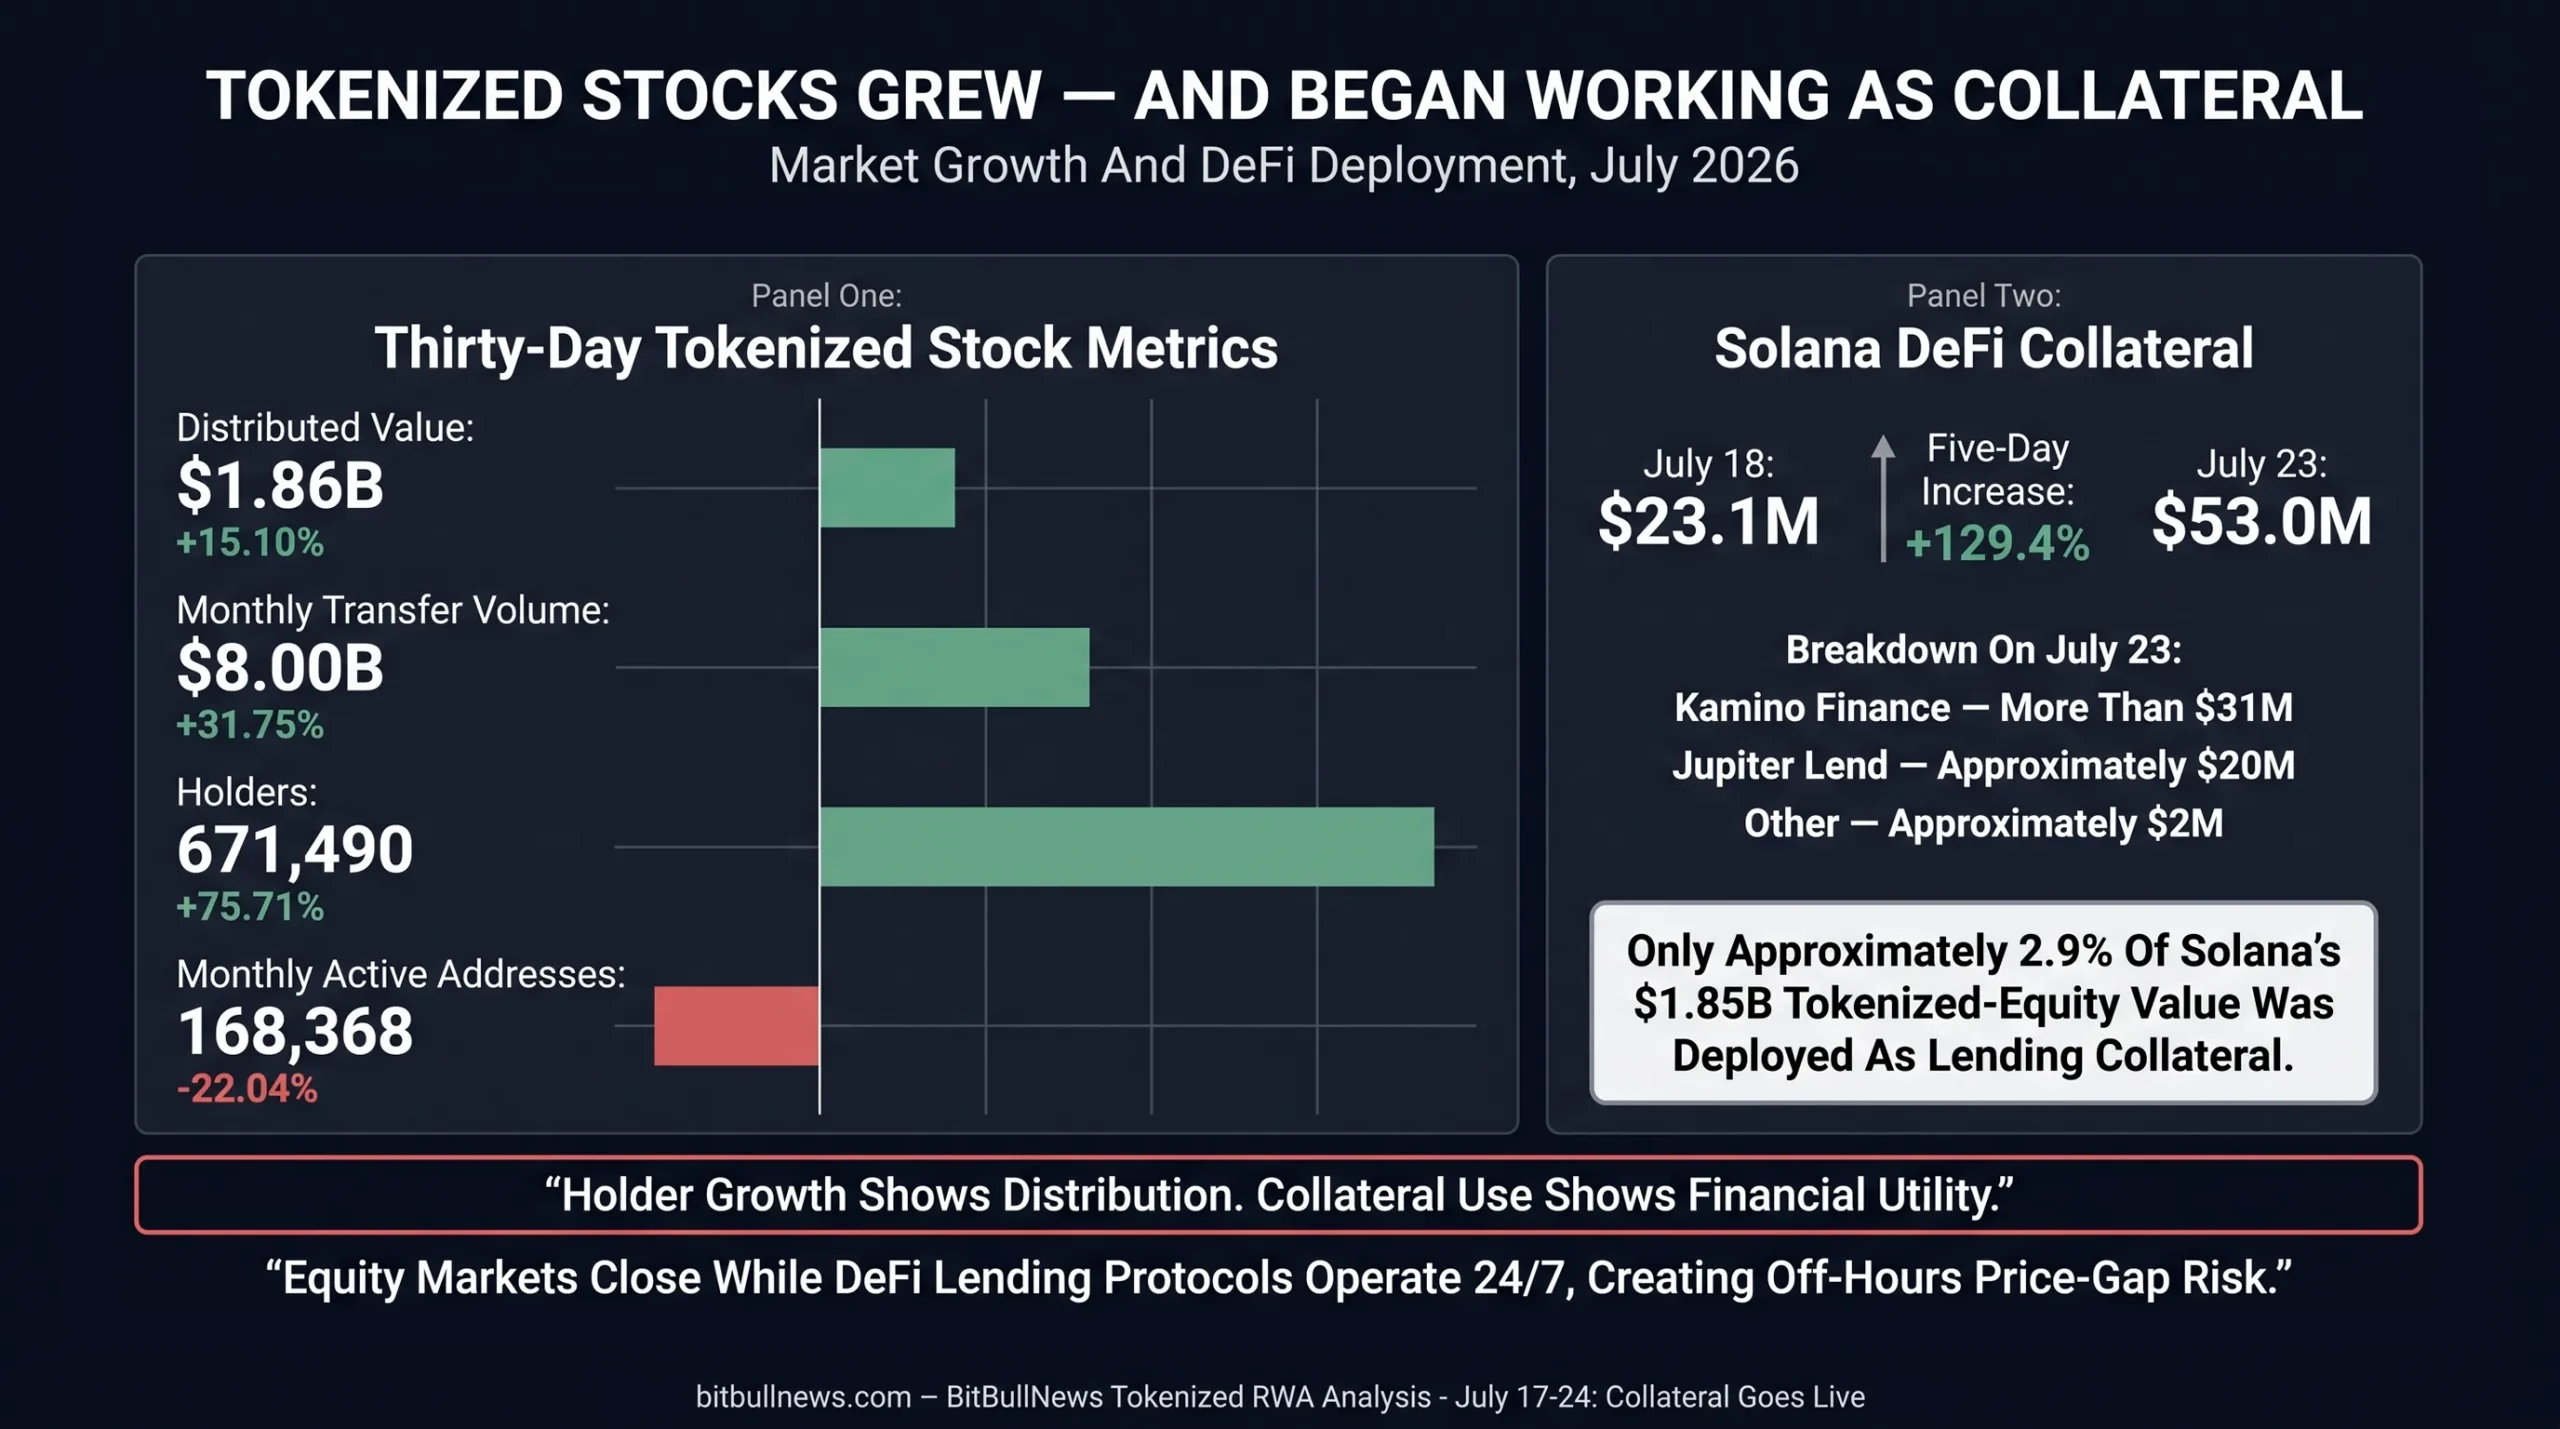
Two-Stage Chart Showing Solana Tokenized Equity Value At $1.85B And The Portion Used As DeFi Lending Collateral At $53M. Add A Secondary Bar Showing Collateral Growth From $23.1M On July 18 To $53M On July 23.
Closed Markets Create Open-Protocol Risk
Using equities as collateral inside 24/7 lending protocols introduces a timing mismatch.
Tokenized shares can move throughout the weekend. Their underlying U.S. securities still rely on exchange trading hours for primary price discovery. A geopolitical shock, earnings announcement or corporate event can change the economic value of a stock while its reference exchange is closed.
Chainlink Data Streams provide frequent prices and use price-band mechanisms designed to limit irregular movements during off-hours. Those controls can reduce false liquidations caused by stale or manipulated data. They cannot remove the risk of a genuine gap when the underlying market reopens.
Compliance creates a second constraint.
Some natively tokenized securities can transfer only between approved wallets. A lending protocol cannot simply liquidate collateral to any available buyer. The receiving wallet may need to pass eligibility, identity and sanctions checks before a liquidation occurs.
That creates an operational question the market has not fully tested:
Can a permissioned security be liquidated quickly enough during a disorderly move without violating securities-transfer restrictions?
Tokenized equity collateral will become institutionally meaningful only if price feeds, liquidators, transfer agents and approved counterparties work through the same stress event.
Mubadala Brought Private Markets Across Three Networks
Mubadala Capital launched tokenized access to a private-markets strategy through KAIO on July 23.
The product became available to qualified investors across Base, Solana and Sui. Reports around the launch placed initial onchain assets or commitments at approximately $75 million. Coinbase also took an undisclosed balance-sheet exposure to the fund.
KAIO’s own product display later showed approximately $64.7 million for MCAS. The difference should not automatically be treated as an error: launch commitments, current net asset value and dashboard-recorded token value can reflect different timestamps and definitions.
The structure matters more than the precise daily figure.
This was not another tokenized Treasury fund. It brought private-market exposure — a category traditionally defined by long settlement cycles, restricted access and manual investor administration — into a multichain distribution framework.
The launch also shows how institutional tokenization is developing:
| Component | Mubadala–KAIO Structure |
|---|---|
| Underlying Exposure | Private-Markets Strategy |
| Tokenization And Administration | KAIO |
| Networks | Base, Solana And Sui |
| Eligible Investors | Institutional And Accredited Investors |
| Reported Launch Scale | Approximately $75M |
| Later KAIO Product Snapshot | Approximately $64.7M |
| Corporate Participation | Coinbase Took Undisclosed Balance-Sheet Exposure |
| Liquidity Status | Tokenized Access Does Not Guarantee A Continuous Secondary Market |
KAIO states that its tokenized funds remain limited to institutional and accredited investors. The platform had already brought more than $200 million of institutional assets onchain through projects involving managers such as BlackRock, Brevan Howard, Hamilton Lane and Laser Digital.
The launch expanded distribution. It did not turn a private-market fund into a liquid public security.
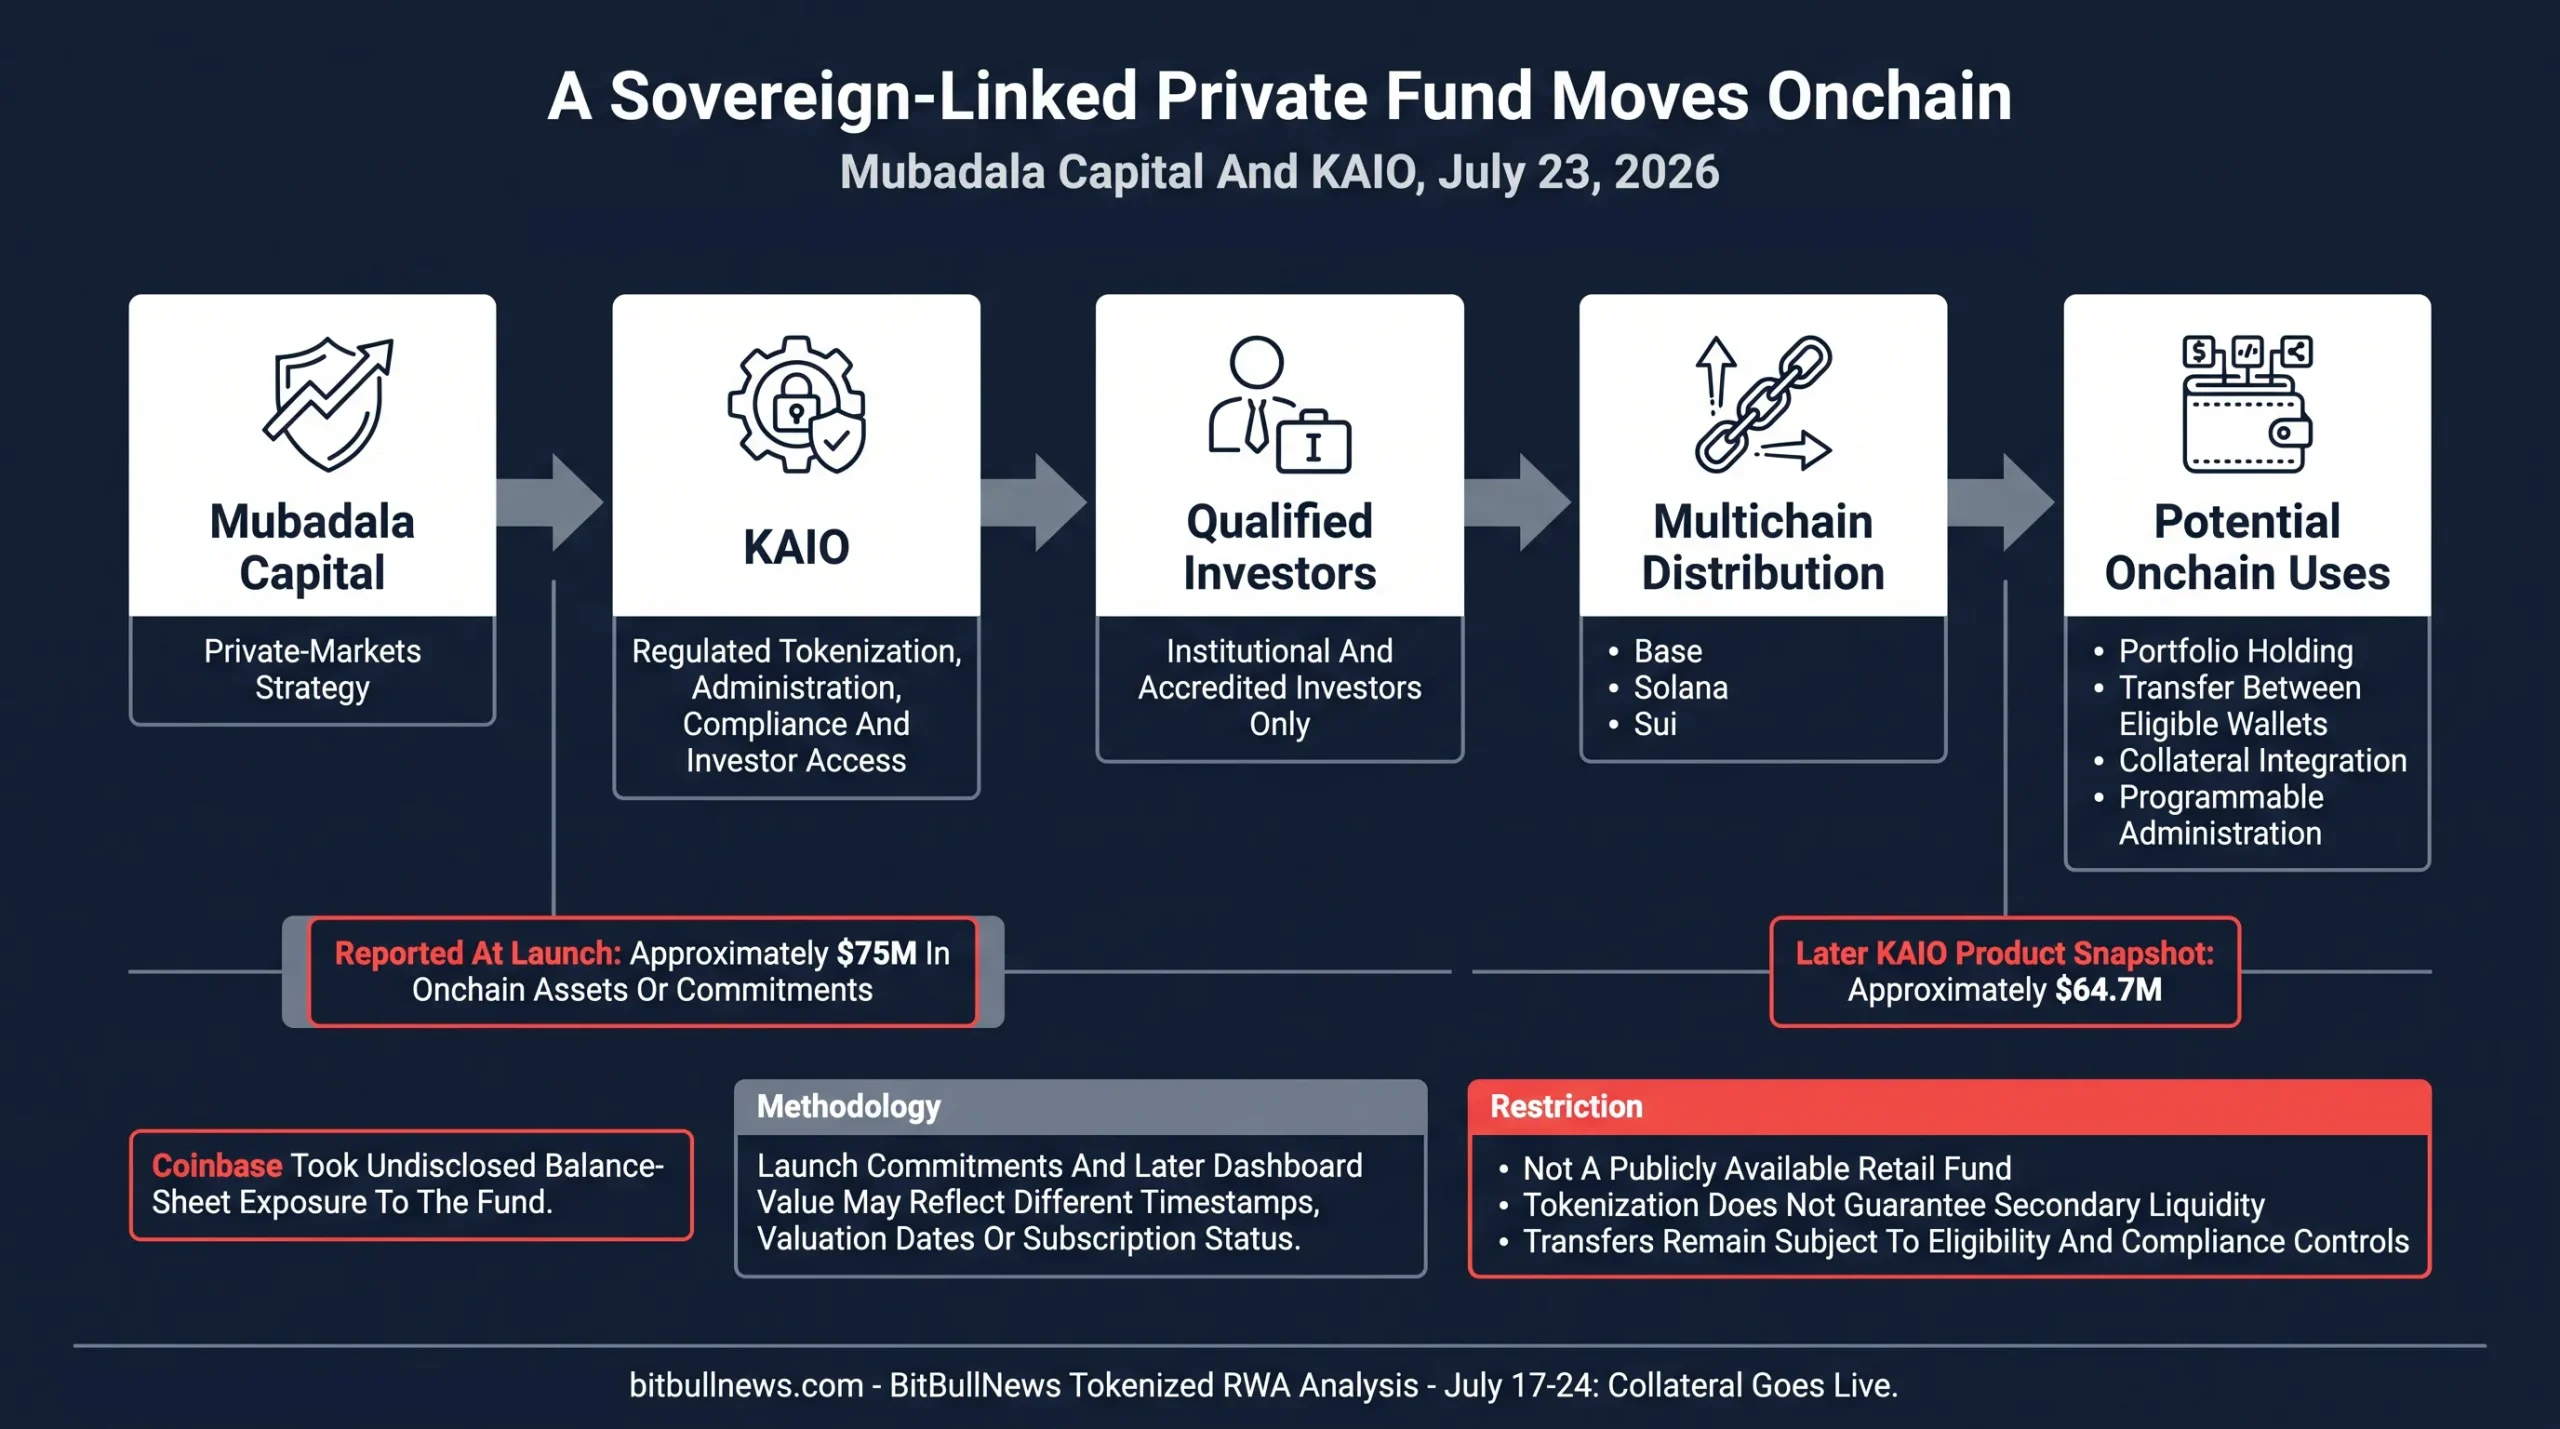
Institutional Flow Diagram Showing Mubadala Capital’s Private-Markets Strategy Moving Through KAIO Into Qualified-Investor Access Across Base, Solana And Sui. Add Separate Labels For Approximately $75M At Launch And $64.7M On KAIO’s Later Product Snapshot.
Private Equity And Venture Capital Continued Expanding
Tokenized private-equity and venture-capital products reached approximately $2.13 billion in distributed value, up 8.26% over 30 days.
The category included 29 assets and around 7,200 holders in the July 22 snapshot. Securitize’s BCAP remained the largest product at approximately $967.6 million, followed by Ctrl Alt’s TTN-III and HERA-I-E tokens.
An initial $75 million Mubadala position would represent roughly 3.5% of the entire category.
That is significant for a single launch, but the holder count shows how narrow the market remains. Tokenized private markets have more than $2 billion in value but only several thousand tracked holders.
The category is institutional by design. Large values can sit behind a small number of approved wallets, feeder funds and custodial arrangements.
For allocators, holder count is less important than:
- Legal ownership of the underlying fund interest.
- Redemption and transfer restrictions.
- NAV publication frequency.
- Cross-chain supply reconciliation.
- Governance over minting and burning.
- The existence of qualified secondary buyers.
Treasury Value Increased As Leadership Rotated
Tokenized U.S. Treasuries reached approximately $15.86 billion in distributed value by July 21, up 2.23% over 30 days.
The category included 85 assets, 62,846 holders and an average seven-day yield of 3.30%.
| Treasury Product Or Platform | Current Value | Recent Change |
|---|---|---|
| Circle USYC | $2.96B | -1.45% Over Seven Days |
| BlackRock BUIDL | $2.52B | -12.22% Over Seven Days |
| Ondo USDY | $2.16B | Not Reported In Source |
| Franklin Templeton iBENJI | $1.64B | Not Reported In Source |
| JPMorgan JLTXX | $809.7M | +87.23% Over 30 Days |
| WisdomTree WTGXX | $764.9M | 3.50% Yield |
| Superstate USTB | $683.8M | -18.39% Over 30 Days |
The category increased from the previous BitBullNews snapshot of $15.16 billion, but capital rotated between products.
BUIDL continued contracting after its earlier cross-chain pullback. JPMorgan’s JLTXX expanded rapidly from a smaller base. Circle remained the category leader despite a modest weekly decline.
The result is healthier than growth driven by one issuer alone. It also shows that tokenized Treasury leadership can shift quickly as institutional platforms add new distribution channels.
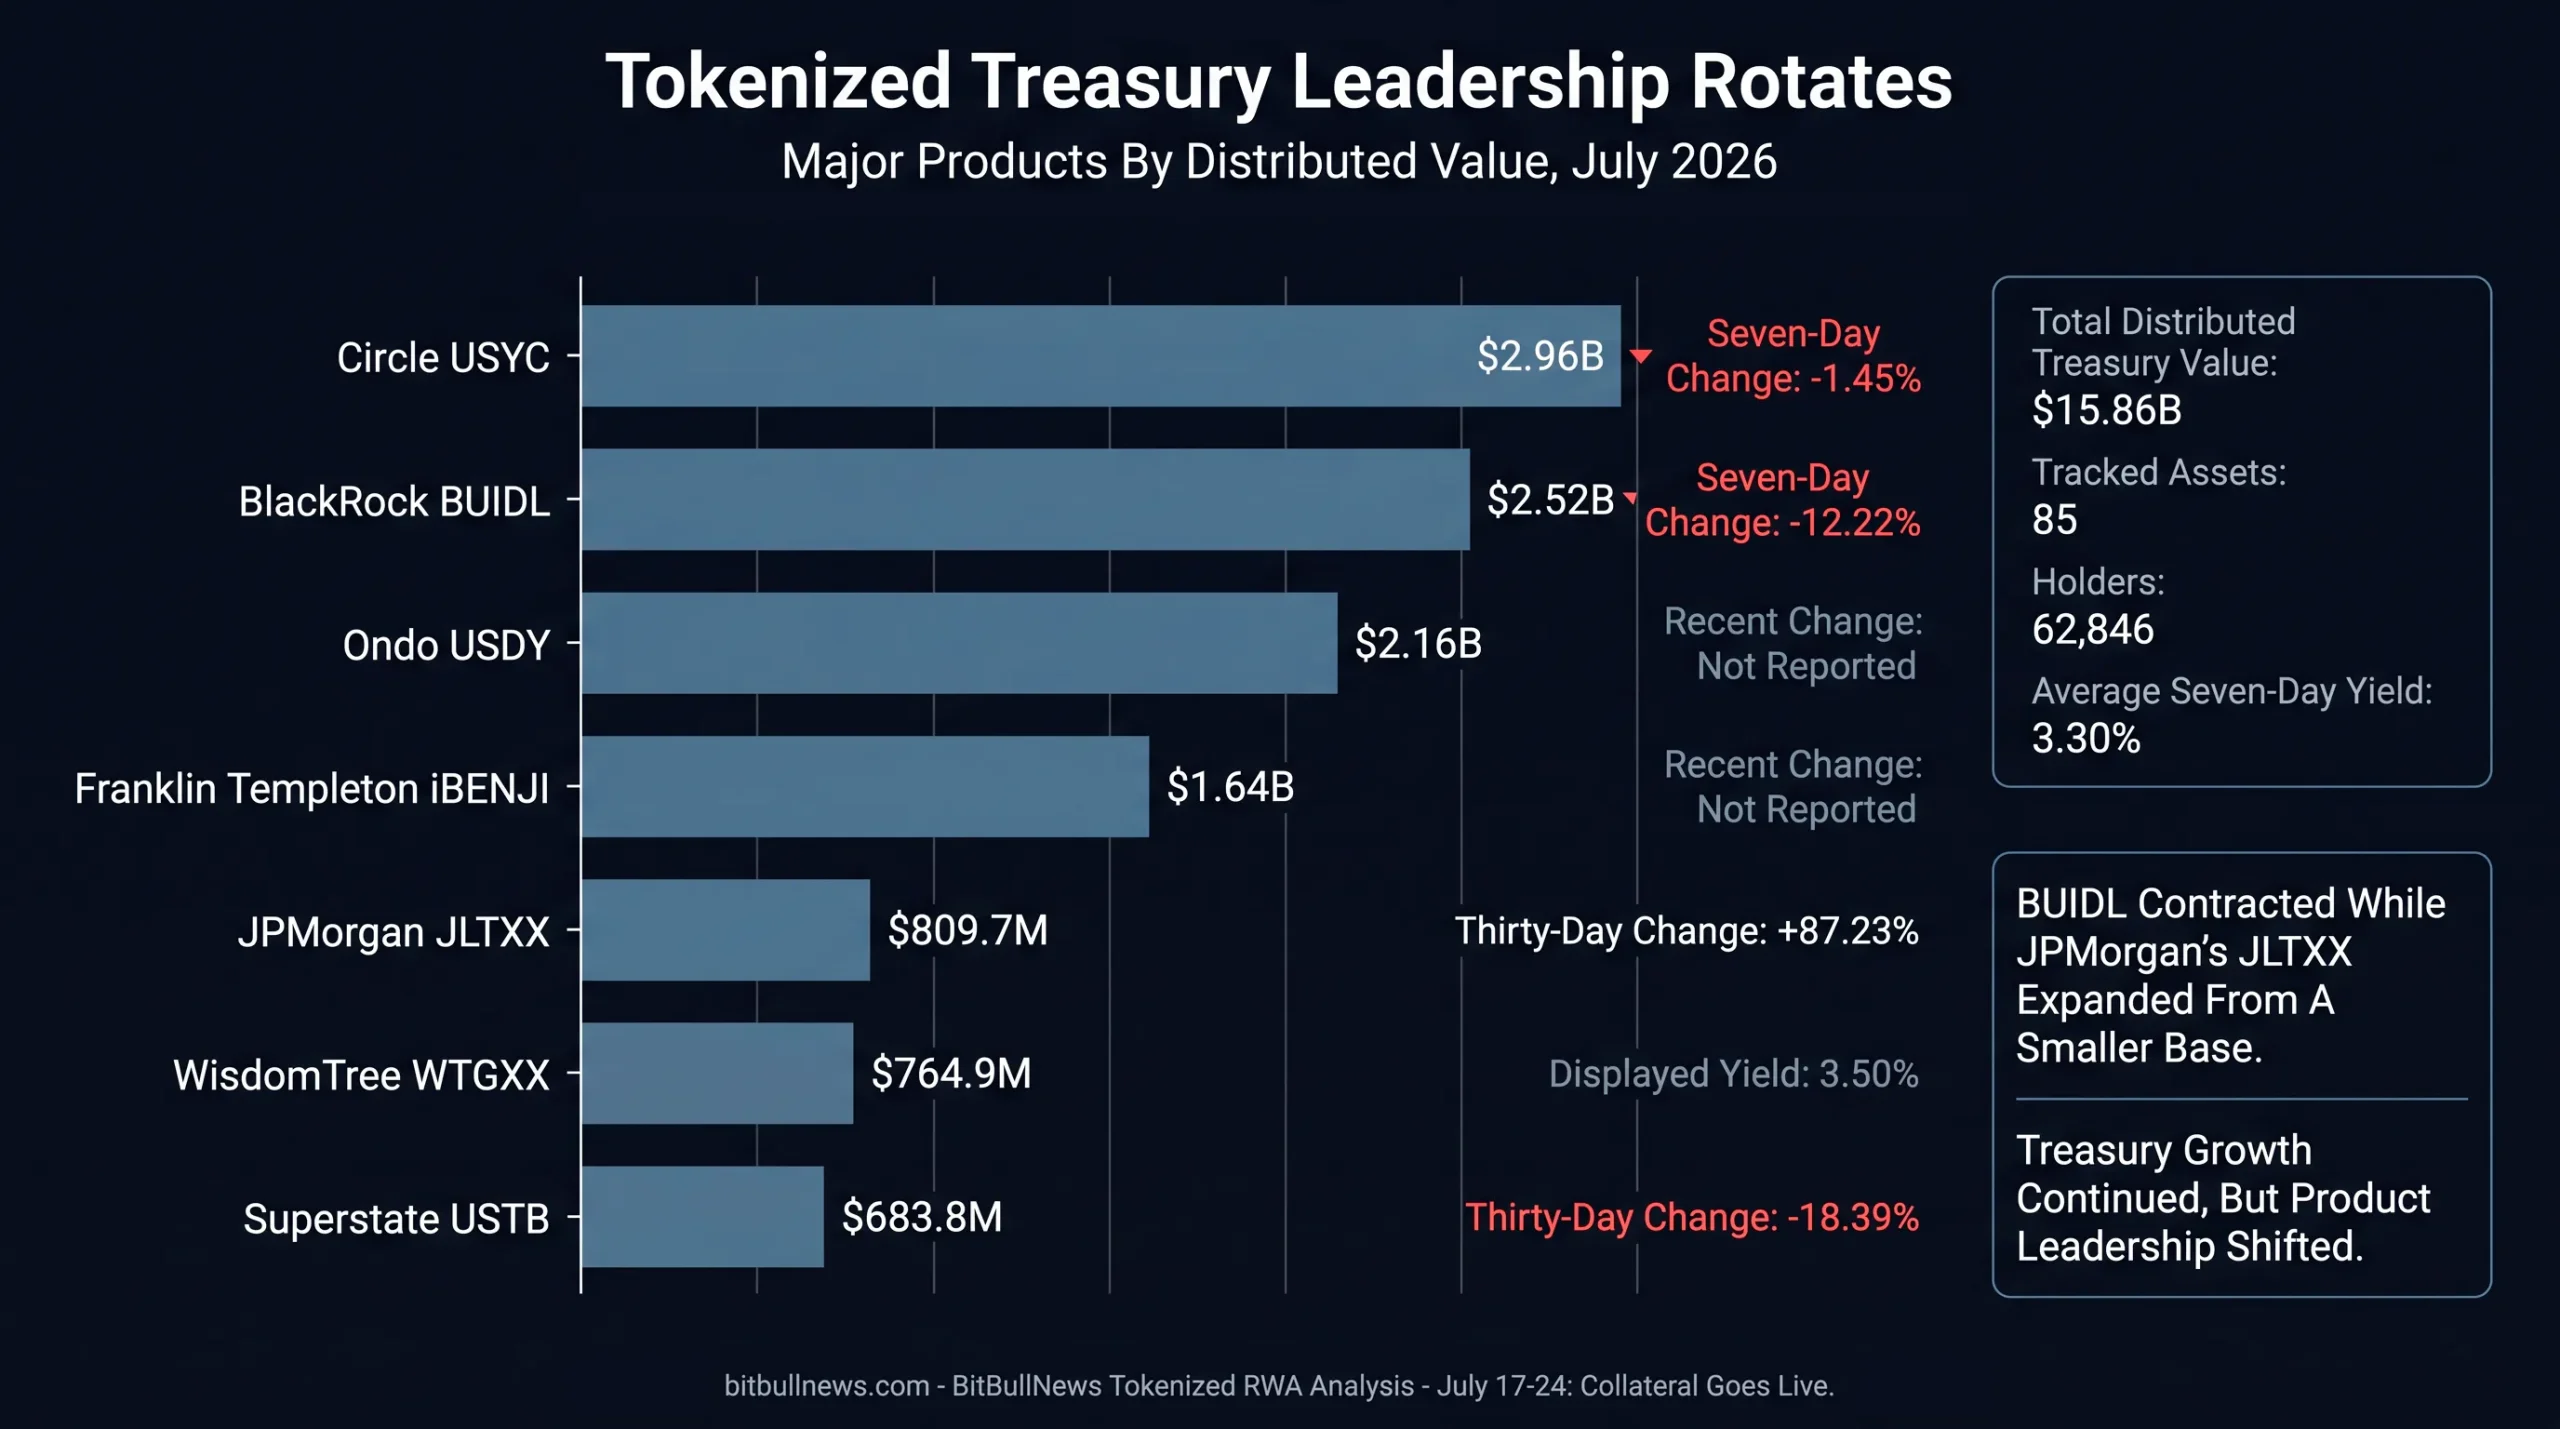
Ranked horizontal bar chart showing the largest tokenized Treasury products by distributed value. Highlight Circle USYC at $2.96B, BlackRock BUIDL at $2.52B, Ondo USDY at $2.16B and JPMorgan JLTXX at $809.7M. Add annotations showing BUIDL’s 12.22% weekly decline and JLTXX’s 87.23% 30-day growth.
Credit Became More Platform-Bound
Distributed tokenized credit stood at $6.98 billion, down 0.37% over 30 days.
Represented credit increased 3.37% to $36.10 billion. The represented category was therefore more than five times larger than transferable credit.
| Credit Metric | Current Reading | 30-Day Change |
|---|---|---|
| Distributed Value | $6.98B | -0.37% |
| Represented Value | $36.10B | +3.37% |
| Tracked Assets | 2,512 | — |
| Holders | 186,352 | +0.88% |
The divergence matters.
Blockchain adoption inside credit markets is growing, but most of the value remains inside controlled systems rather than circulating between external wallets.
That is not necessarily a failure. Private credit often requires borrower confidentiality, transfer restrictions and lender approval. A platform-bound ledger can still improve administration, reporting and reconciliation.
It does limit the claim that tokenized credit has already become a liquid onchain asset class.
Commodities Lost Activity Alongside Value
Tokenized commodities held approximately $4.48 billion in distributed value in the July 22 snapshot, down 3.88% over 30 days.
Monthly transfer volume fell 49.23% to $3.27 billion. Holders declined slightly to 240,860, while monthly active addresses fell to 36,136.
The segment remains dominated by gold-backed products, particularly Tether Gold and Paxos Gold.
Unlike the previous reporting period, both value and activity moved lower. That weakens the argument that the change was only a valuation effect.
Commodity tokens still provide one of the clearest RWA use cases: direct blockchain transfer of exposure to a vaulted physical asset. Their market quality depends on redemption access, reserve verification, custody and active secondary liquidity — not market capitalization alone.
What Institutional Allocators Should Measure
Classification Changes
A large weekly change can come from a newly tracked asset or an updated tokenization classification.
Analysts should preserve historical snapshots and identify whether the same assets and methodology are present at both endpoints.
Collateral Deployment
A token becomes more useful when lenders, clearing venues or trading systems accept it as collateral.
Collateral value should be reported separately from total outstanding value. The current Solana equity-collateral ratio remains below 3%.
Off-Hours Risk
A 24/7 token backed by an asset with limited trading hours carries gap risk.
Lending protocols need conservative price bands, liquidation buffers and clear procedures for corporate actions that occur while the reference market is closed.
Legal Ownership
Investors must distinguish between:
- Issuer-sponsored native securities.
- Custodial tokens backed by securities.
- Fund interests.
- Debt claims.
- Synthetic price exposure.
Those structures can track the same asset while giving holders different voting, dividend, redemption and insolvency rights. The SEC has formally distinguished issuer-sponsored, custodial and synthetic tokenization models.
Cross-Chain Reconciliation
A multichain fund requires a reliable view of total supply across every network.
Institutions should understand which party controls minting, burning, bridging and emergency freezes, and whether the official shareholder record updates immediately after a cross-chain transfer.
Holder Quality
Wallet counts can overstate economic breadth.
One investor may control several addresses, while custodians and omnibus accounts may represent many investors through a single address. Holder growth should be paired with active addresses, transfer volume and ownership concentration.
RWA Risk Dashboard
| Signal | Current Reading | Interpretation | Confirmation Needed |
|---|---|---|---|
| Distributed RWA Value | $36.89B | Transferable value expanded strongly | Growth persists without major reclassification |
| Represented RWA Value | $366.97B | Platform-bound value declined | Evidence identifying flows versus reclassification |
| RWA Holders | 1.25M, +22.6% Between Snapshots | Ownership footprint broadened | Continued active-address growth |
| Active Strategies | $3.50B | Category nearly doubled | Separate real subscriptions from sUSDe inclusion |
| Tokenized Stocks | $1.86B | Fastest-moving major category | Sustained value and transfer-volume growth |
| Stock Active Addresses | -22.04% Over 30 Days | Usage did not match holder growth | Recovery in recurring activity |
| Equity Collateral | $53M | Stocks are entering onchain credit markets | Broader protocol and asset participation |
| Collateral Share | Approximately 2.9% | Utility remains early | Higher deployment without unstable leverage |
| Mubadala Tokenized Fund | Approximately $75M At Launch | Sovereign-linked private markets moved multichain | Redemption, transfer and secondary-liquidity data |
| Tokenized Treasuries | $15.86B | Core RWA category continued growing | Broader growth beyond a few issuers |
| BUIDL | $2.52B, -12.22% Weekly | Earlier contraction continued | Stabilization across supported networks |
| Distributed Credit | $6.98B | Transferable credit softened | Renewed issuance and secondary activity |
| Represented Credit | $36.10B | Institutional ledger adoption increased | More assets become externally transferable |
| Commodities | Value And Volume Lower | Gold-backed activity weakened | Transfer and holder recovery |
| Network Concentration | Solana Holds 95% Of Equity Volume | Efficient liquidity hub but concentrated infrastructure | Meaningful activity on additional networks |
Proving the Model, Not Yet the Scale
The RWA market grew this week, but the most important progress did not come from headline value.
Distributed assets reached $36.89 billion and tracked holders climbed above 1.25 million. Those figures were helped by broader coverage and classification changes, particularly the inclusion of $1.54 billion of Staked USDe in active strategies.
Tokenized equities delivered the stronger signal.
The category held approximately $1.86 billion, generated $8 billion of monthly transfer volume and reached more than 670,000 holders. More importantly, $53 million of tokenized shares and ETFs was deployed as collateral on Solana lending protocols.
That is still less than 3% of the tokenized-equity market. It proves the model without proving scale.
Mubadala Capital added another institutional use case by launching tokenized access to a private-markets strategy across Base, Solana and Sui. The product reportedly attracted approximately $75 million at launch, while Coinbase took an undisclosed balance-sheet position.
Treasuries remained the largest transferable RWA category at $15.86 billion. Credit remained much larger in represented form than in externally transferable tokens. Commodities weakened in both value and activity.
The market is entering a harder stage.
Issuing a token is no longer enough. The asset must work inside lending, collateral, settlement and portfolio systems without breaking legal ownership, price discovery or transfer controls.
This week showed the first signs of that transition. Tokenized assets are beginning to do financial work.
Data Sources & References
- RWA.xyz Network Analytics
- RWA.xyz Tokenized U.S. Treasuries
- RWA.xyz Tokenized Credit
- RWA.xyz Tokenized Stocks
- RWA.xyz Tokenized Commodities
- RWA.xyz Tokenized Active Strategies
- RWA.xyz Tokenized Real Estate
- RWA.xyz Tokenization-Type Methodology
- KAIO And Mubadala Capital
- KAIO Architecture
- Ondo And DTCC Tokenized Securities
- DTCC Tokenization Service
- DTCC Live Production Transactions
- SEC Statement On Tokenized Securities
- Tokenized But Illiquid? Evidence From RWA Markets
- Beyond TVL: Risk Scoring For Tokenized RWAs