



Content
The institutional crypto ETF bid has weakened into July.
The latest completed U.S. trading session, July 1, 2026, showed $296.0 million of net outflows from U.S. spot Bitcoin ETFs, according to Farside Investors. That followed four straight negative sessions from June 25 to June 30, leaving Bitcoin ETFs with roughly $1.89 billion of net outflows over the last five completed trading sessions.
Ethereum ETFs looked steadier, but not strong. Farside recorded $14.8 million of net inflows into ETH ETFs on July 1, after four consecutive negative sessions. Across the last five completed trading sessions, ETH ETFs still lost roughly $137.4 million.
Bitcoin price action confirms the pressure. CoinGecko showed BTC closing at $59,968 on July 1, down from $66,292 on June 15. ETH closed at $1,608.34 on July 1, down from $1,795.04 on June 15. ETF flows are not the only driver of price, but when spot ETFs bleed while price is already lower, the market loses one of its cleaner institutional support signals.
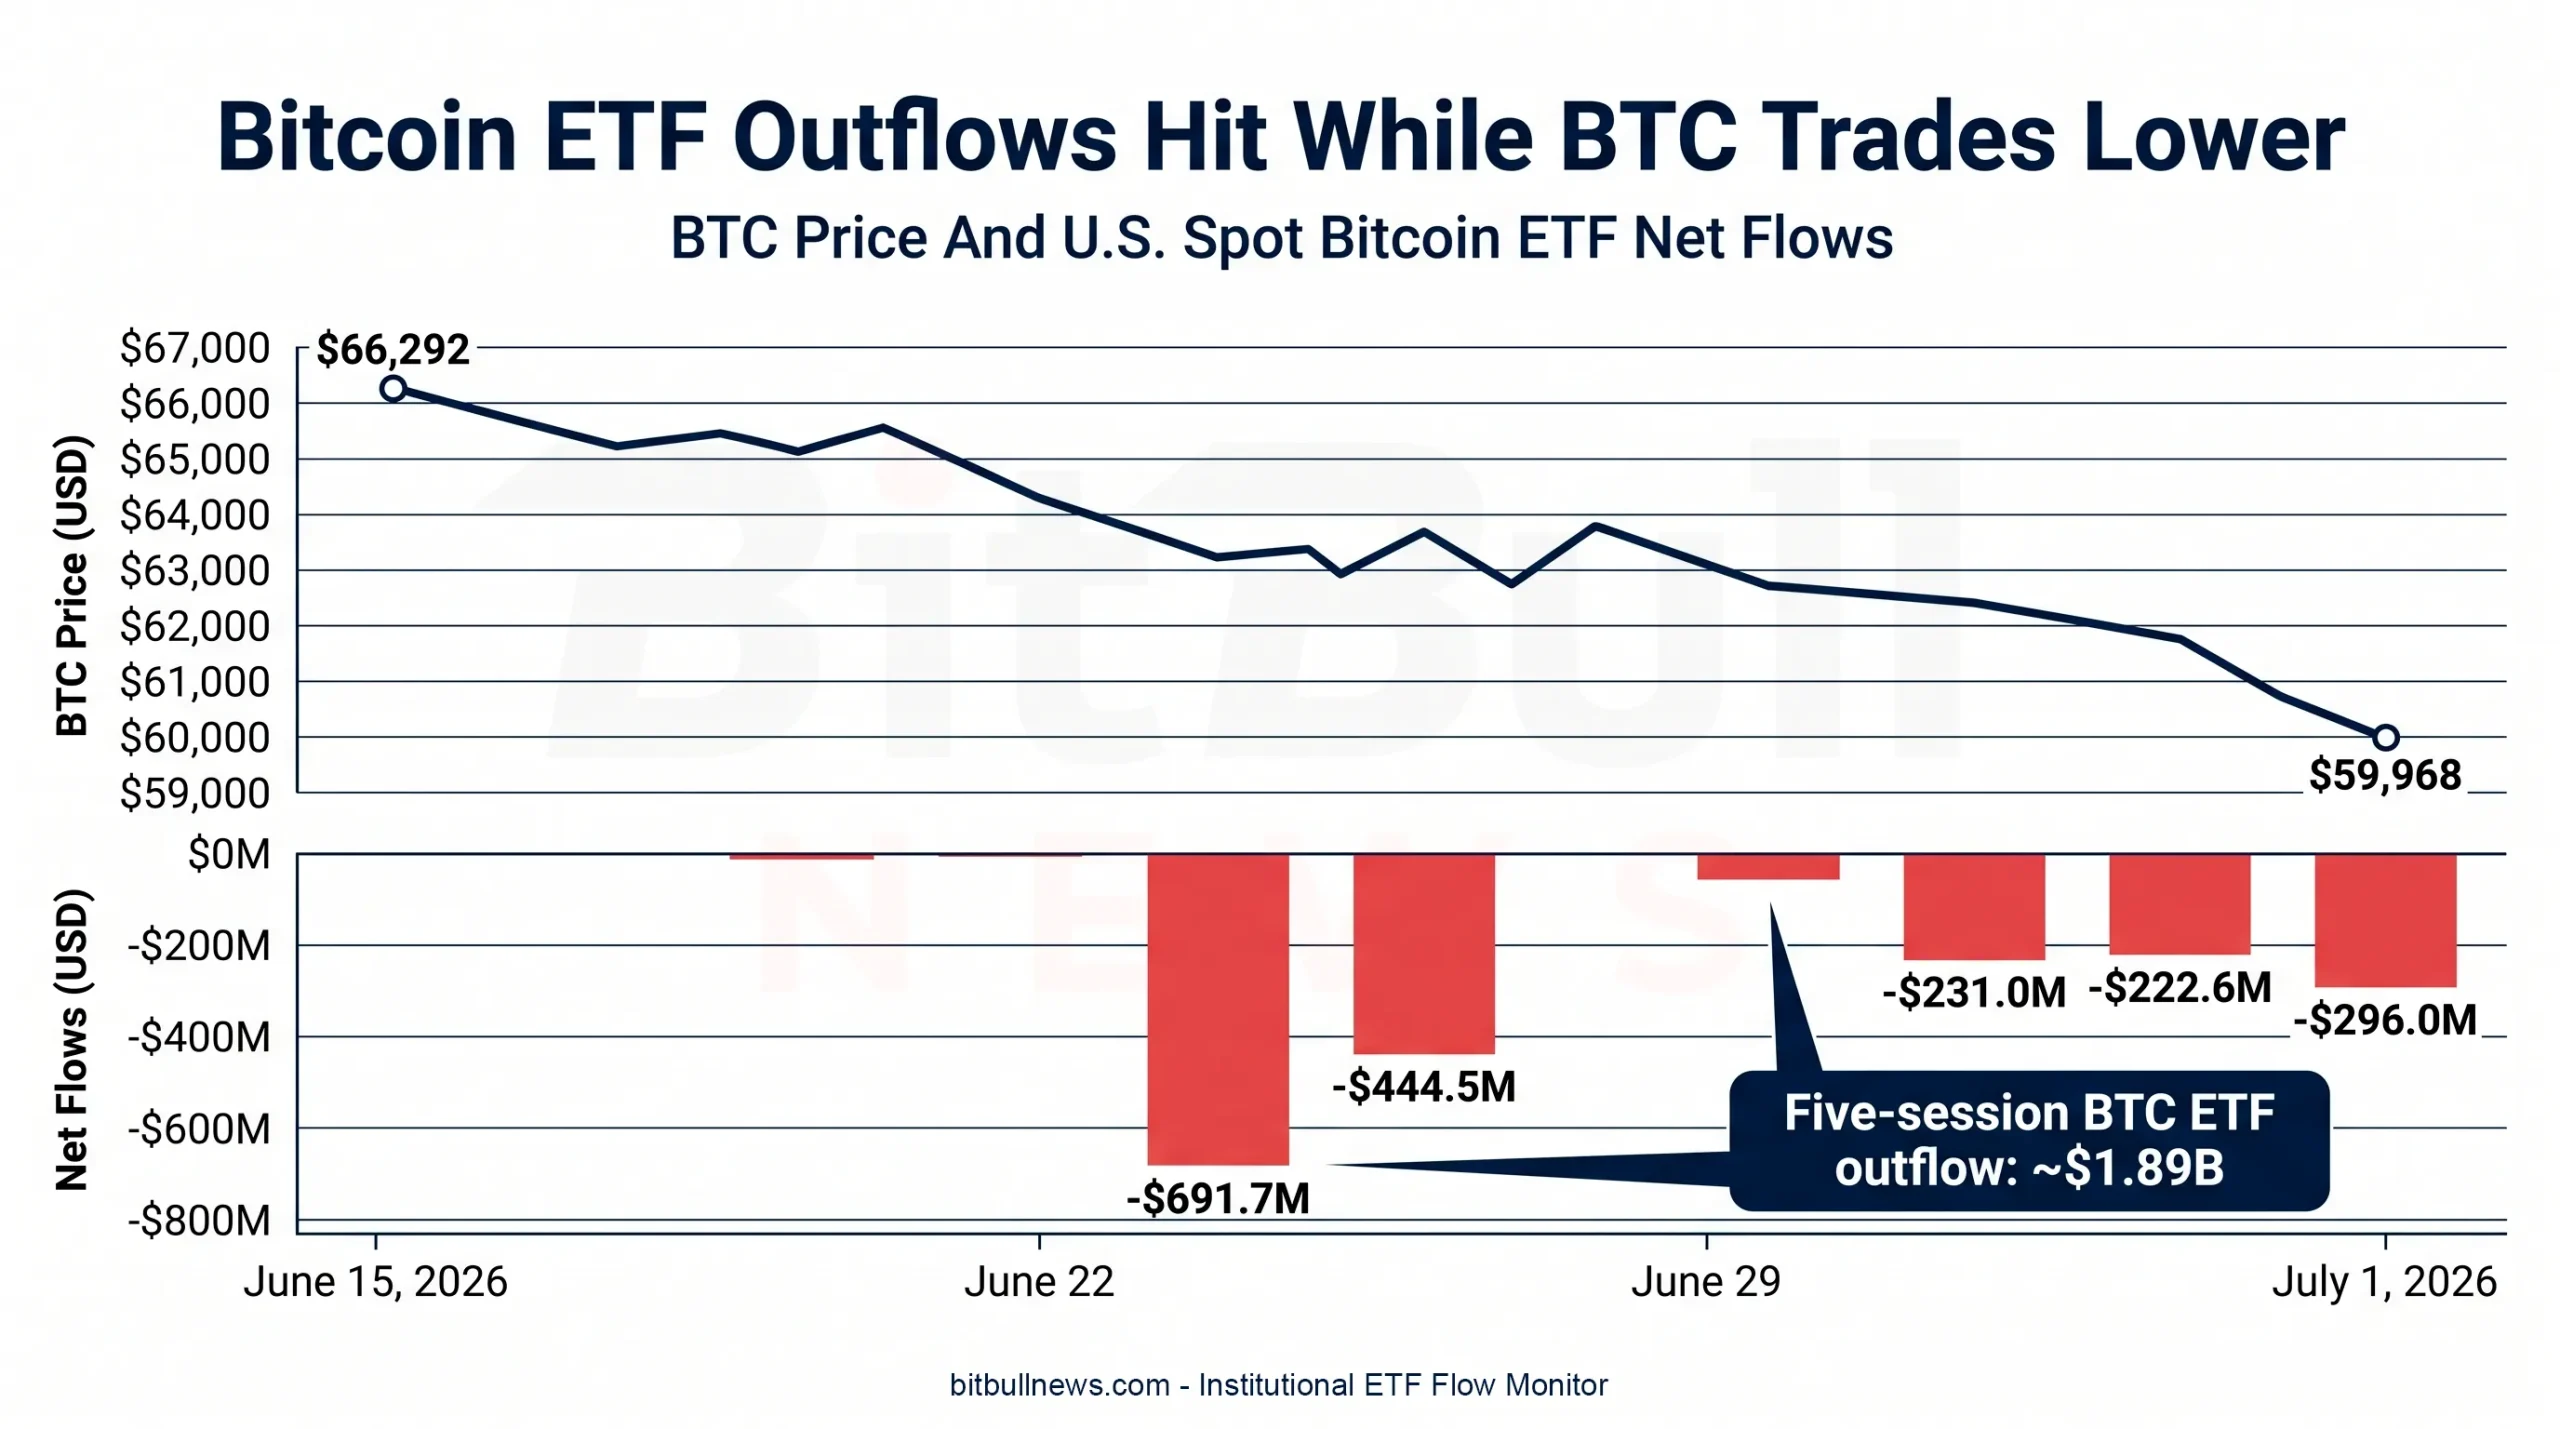
Chart: Line And Bar Combo Showing BTC Price From June 15 To July 1, With Daily U.S. Spot Bitcoin ETF Net Flows As Bars Under The Price Line. Highlight The Five-Session Outflow Streak From June 25 To July 1.
Market Structure Snapshot
Farside’s flow table shows the institutional demand split clearly: Bitcoin remains the deepest ETF market, but it is also where the largest redemptions are happening. Ethereum is smaller and less liquid, but its July 1 flow was positive. Solana and Hyperliquid ETF products are still minor by comparison, though Hyperliquid’s five-session flow was helped by a single large inflow on June 25.
| Asset ETF Complex | Latest Daily Net Flow | Five-Session Net Flow | Cumulative Net Flow | Market Read |
|---|---|---|---|---|
| Bitcoin | -$296.0M | -$1.89B | +$50.91B | Deepest Market, But Under Redemption Pressure |
| Ethereum | +$14.8M | -$137.4M | +$10.89B | Stabilized After A Weak Run |
| Solana | +$0.5M | +$1.6M | +$1.13B | Positive But Small |
| Hyperliquid | +$2.9M | +$112.0M | +$302M | Narrow Product Base, One Large Inflow Dominates |
| XRP | -$1.8M | N/A | $1.4B Tracked Total Inflows | Minor Outflow In Latest Cross-Asset Snapshot |
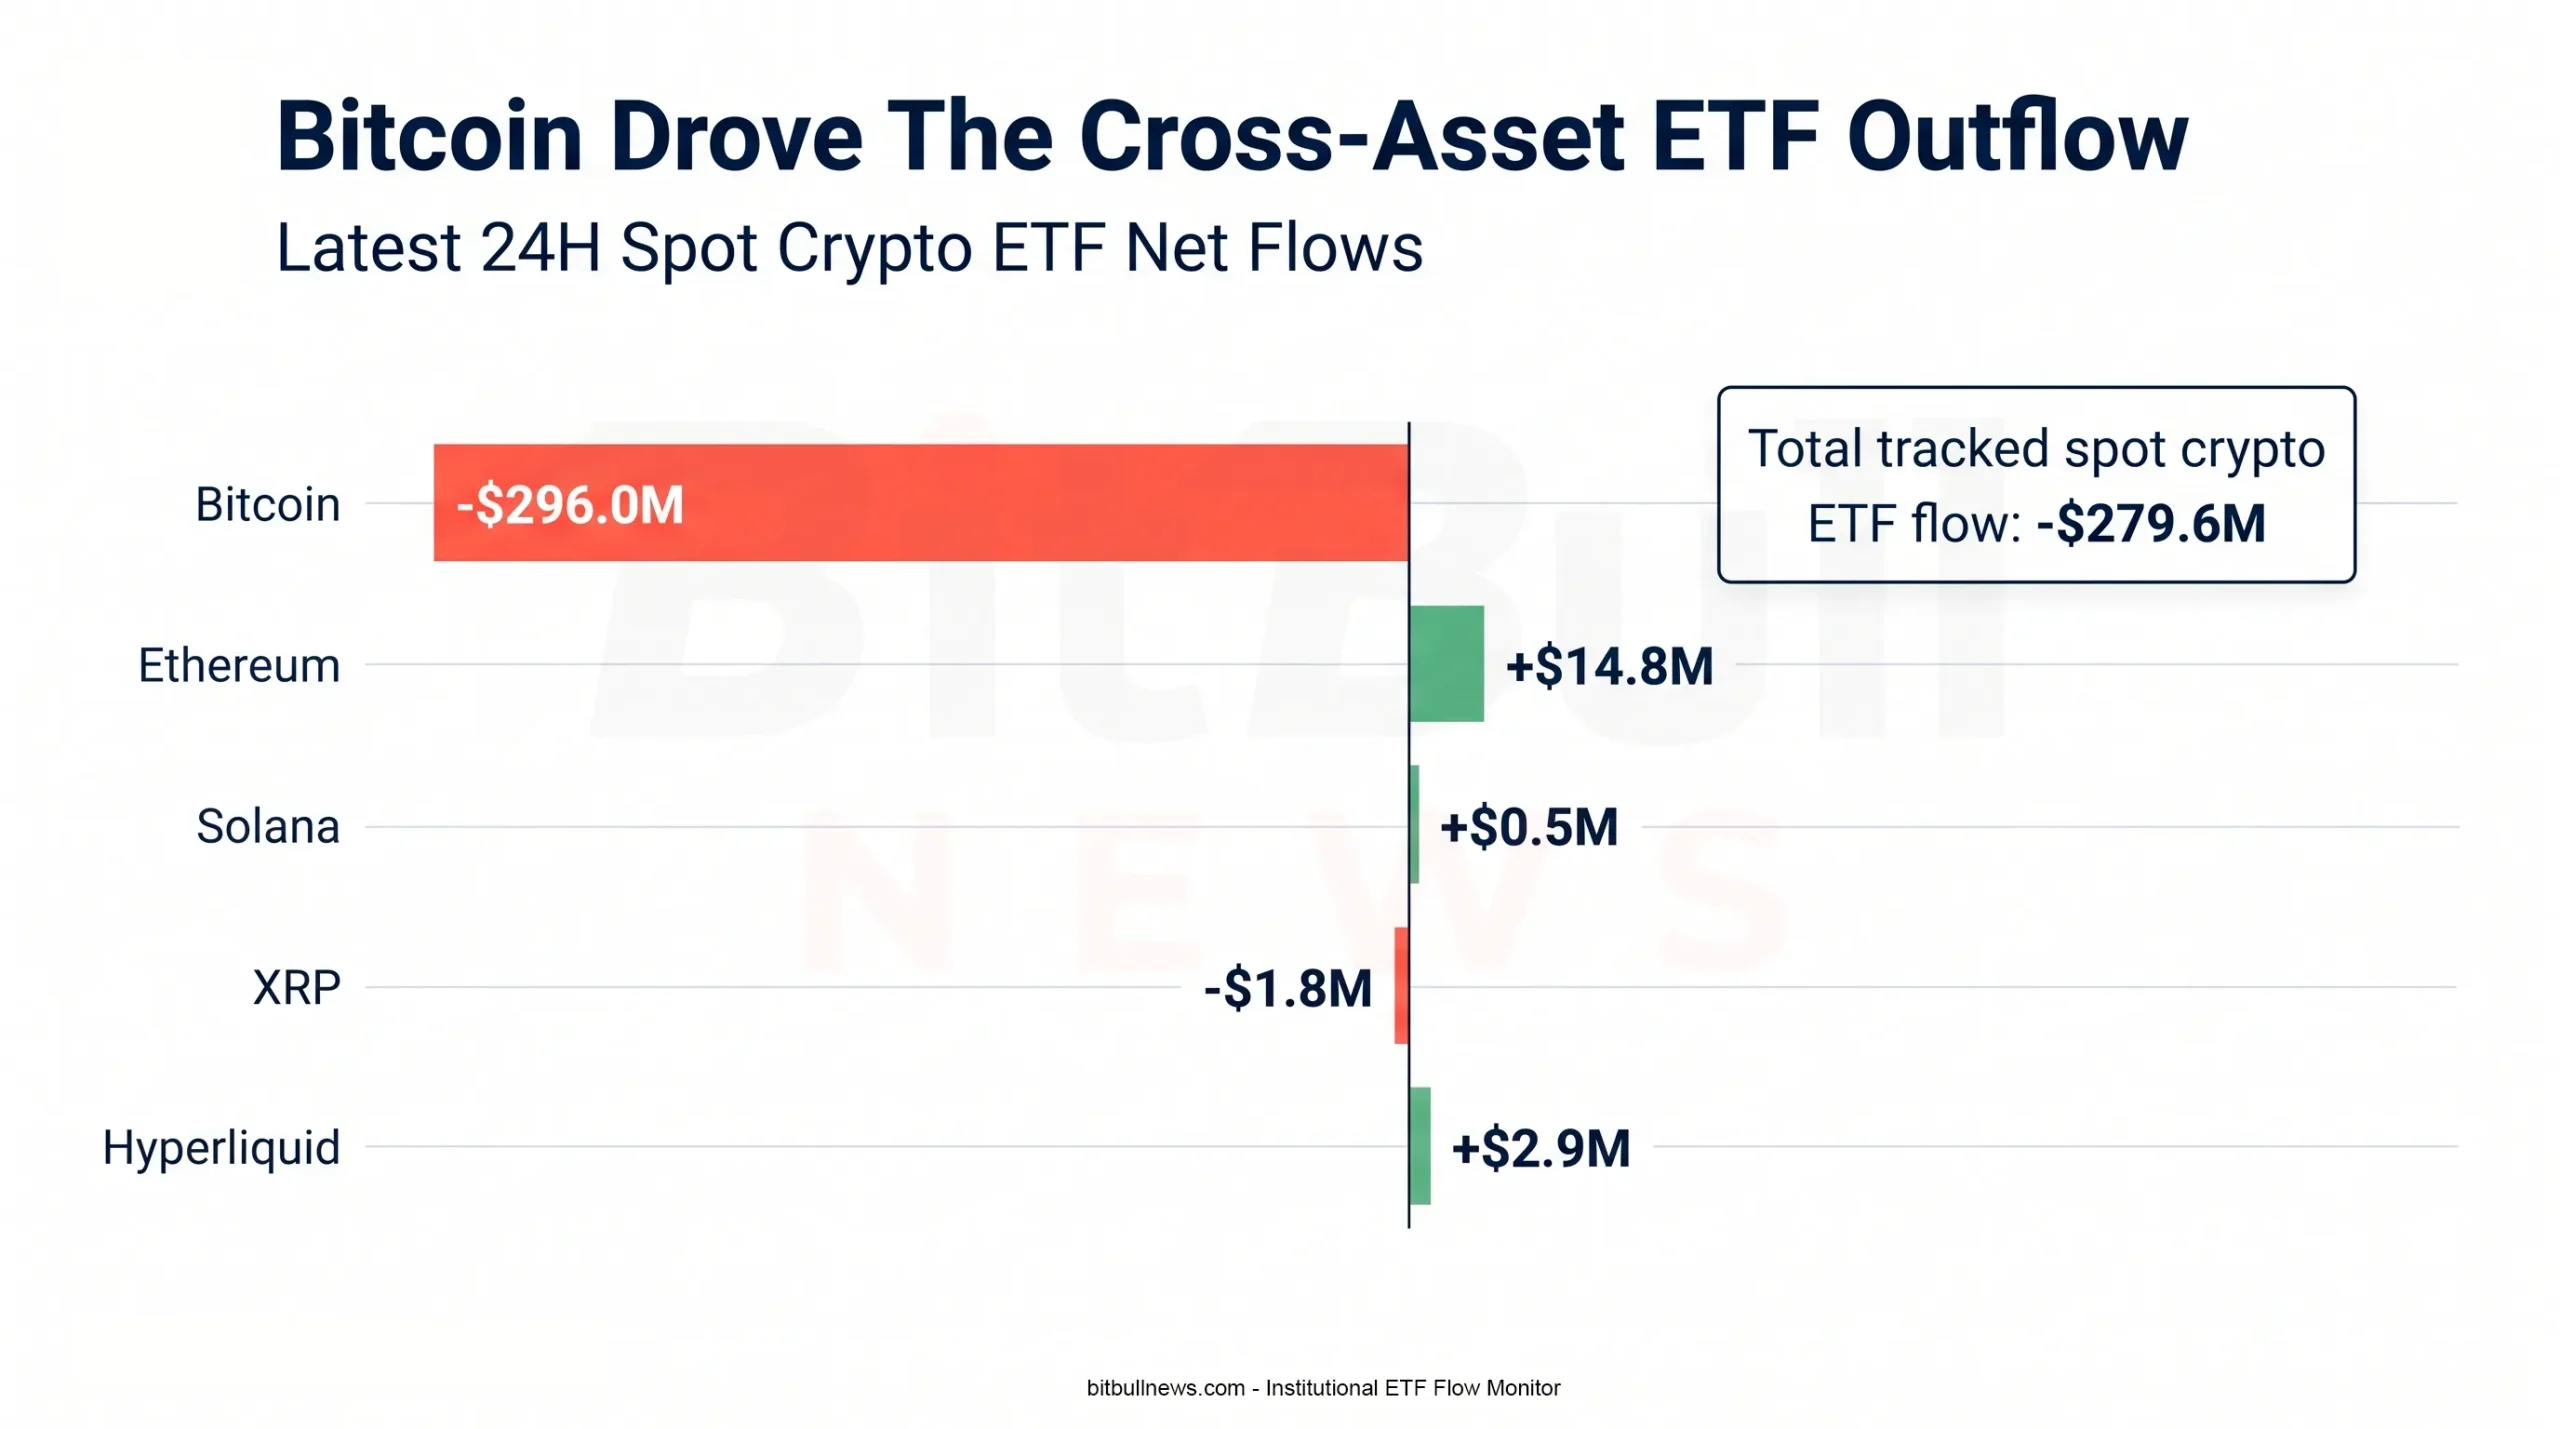
CryptoETF.today’s cross-asset dashboard showed total tracked spot crypto ETF AUM of $64.5 billion, with a 24-hour net flow of -$279.6 million across BTC, ETH, SOL, XRP, and HYPE products. Its asset split matched the core pattern: BTC at -$296.0 million, ETH at +$14.8 million, SOL at +$0.5 million, XRP at -$1.8 million, and HYPE at +$2.9 million.
Bitcoin ETF Flows: The Bid Is No Longer Absorbing Supply
The Bitcoin ETF tape is the main story.
On July 1, Farside recorded $219.4 million of outflows from IBIT, $51.0 million from FBTC, $39.9 million from ARKB, and $62.8 million from GBTC. Positive flows in BTCO, EZBC, HODL, MSBT, and Grayscale’s BTC mini trust were not enough to offset the redemptions. The session ended at -$296.0 million.
| Bitcoin ETF | July 1 Net Flow | Cumulative Net Flow | Read |
|---|---|---|---|
| IBIT | -$219.4M | +$60.03B | Still The Dominant Winner, But Latest-Day Redemption Was Heavy |
| FBTC | -$51.0M | +$10.09B | Second-Largest Cumulative Inflow Base, Also Under Pressure |
| ARKB | -$39.9M | +$1.17B | Fresh Outflow After Earlier Inflow Days |
| GBTC | -$62.8M | -$27.17B | Legacy Conversion Drain Continues |
| BTC Mini Trust | +$36.3M | +$2.38B | Still Attracting Some Rotation |
| MSBT | +$29.8M | +$395M | Positive But Too Small To Offset IBIT/GBTC |
| Total BTC ETF Complex | -$296.0M | +$50.91B | Net Institutional Flow Turned Defensive |
The anomaly is IBIT. It remains the franchise product in the Bitcoin ETF market, with $60.03 billion of cumulative net inflows in Farside’s table. Yet on July 1, it was also the largest source of outflows. That does not break the long-term IBIT story, but it does change the short-term read: institutional money is no longer adding to the largest Bitcoin ETF by default.
CoinGlass showed the same directional pressure in native BTC terms. Its Bitcoin ETF tracker recorded -$296.00 million, or -5.05K BTC, of daily net flow on July 1, while cumulative net inflow stood at $51.30 billion, or 633.17K BTC.
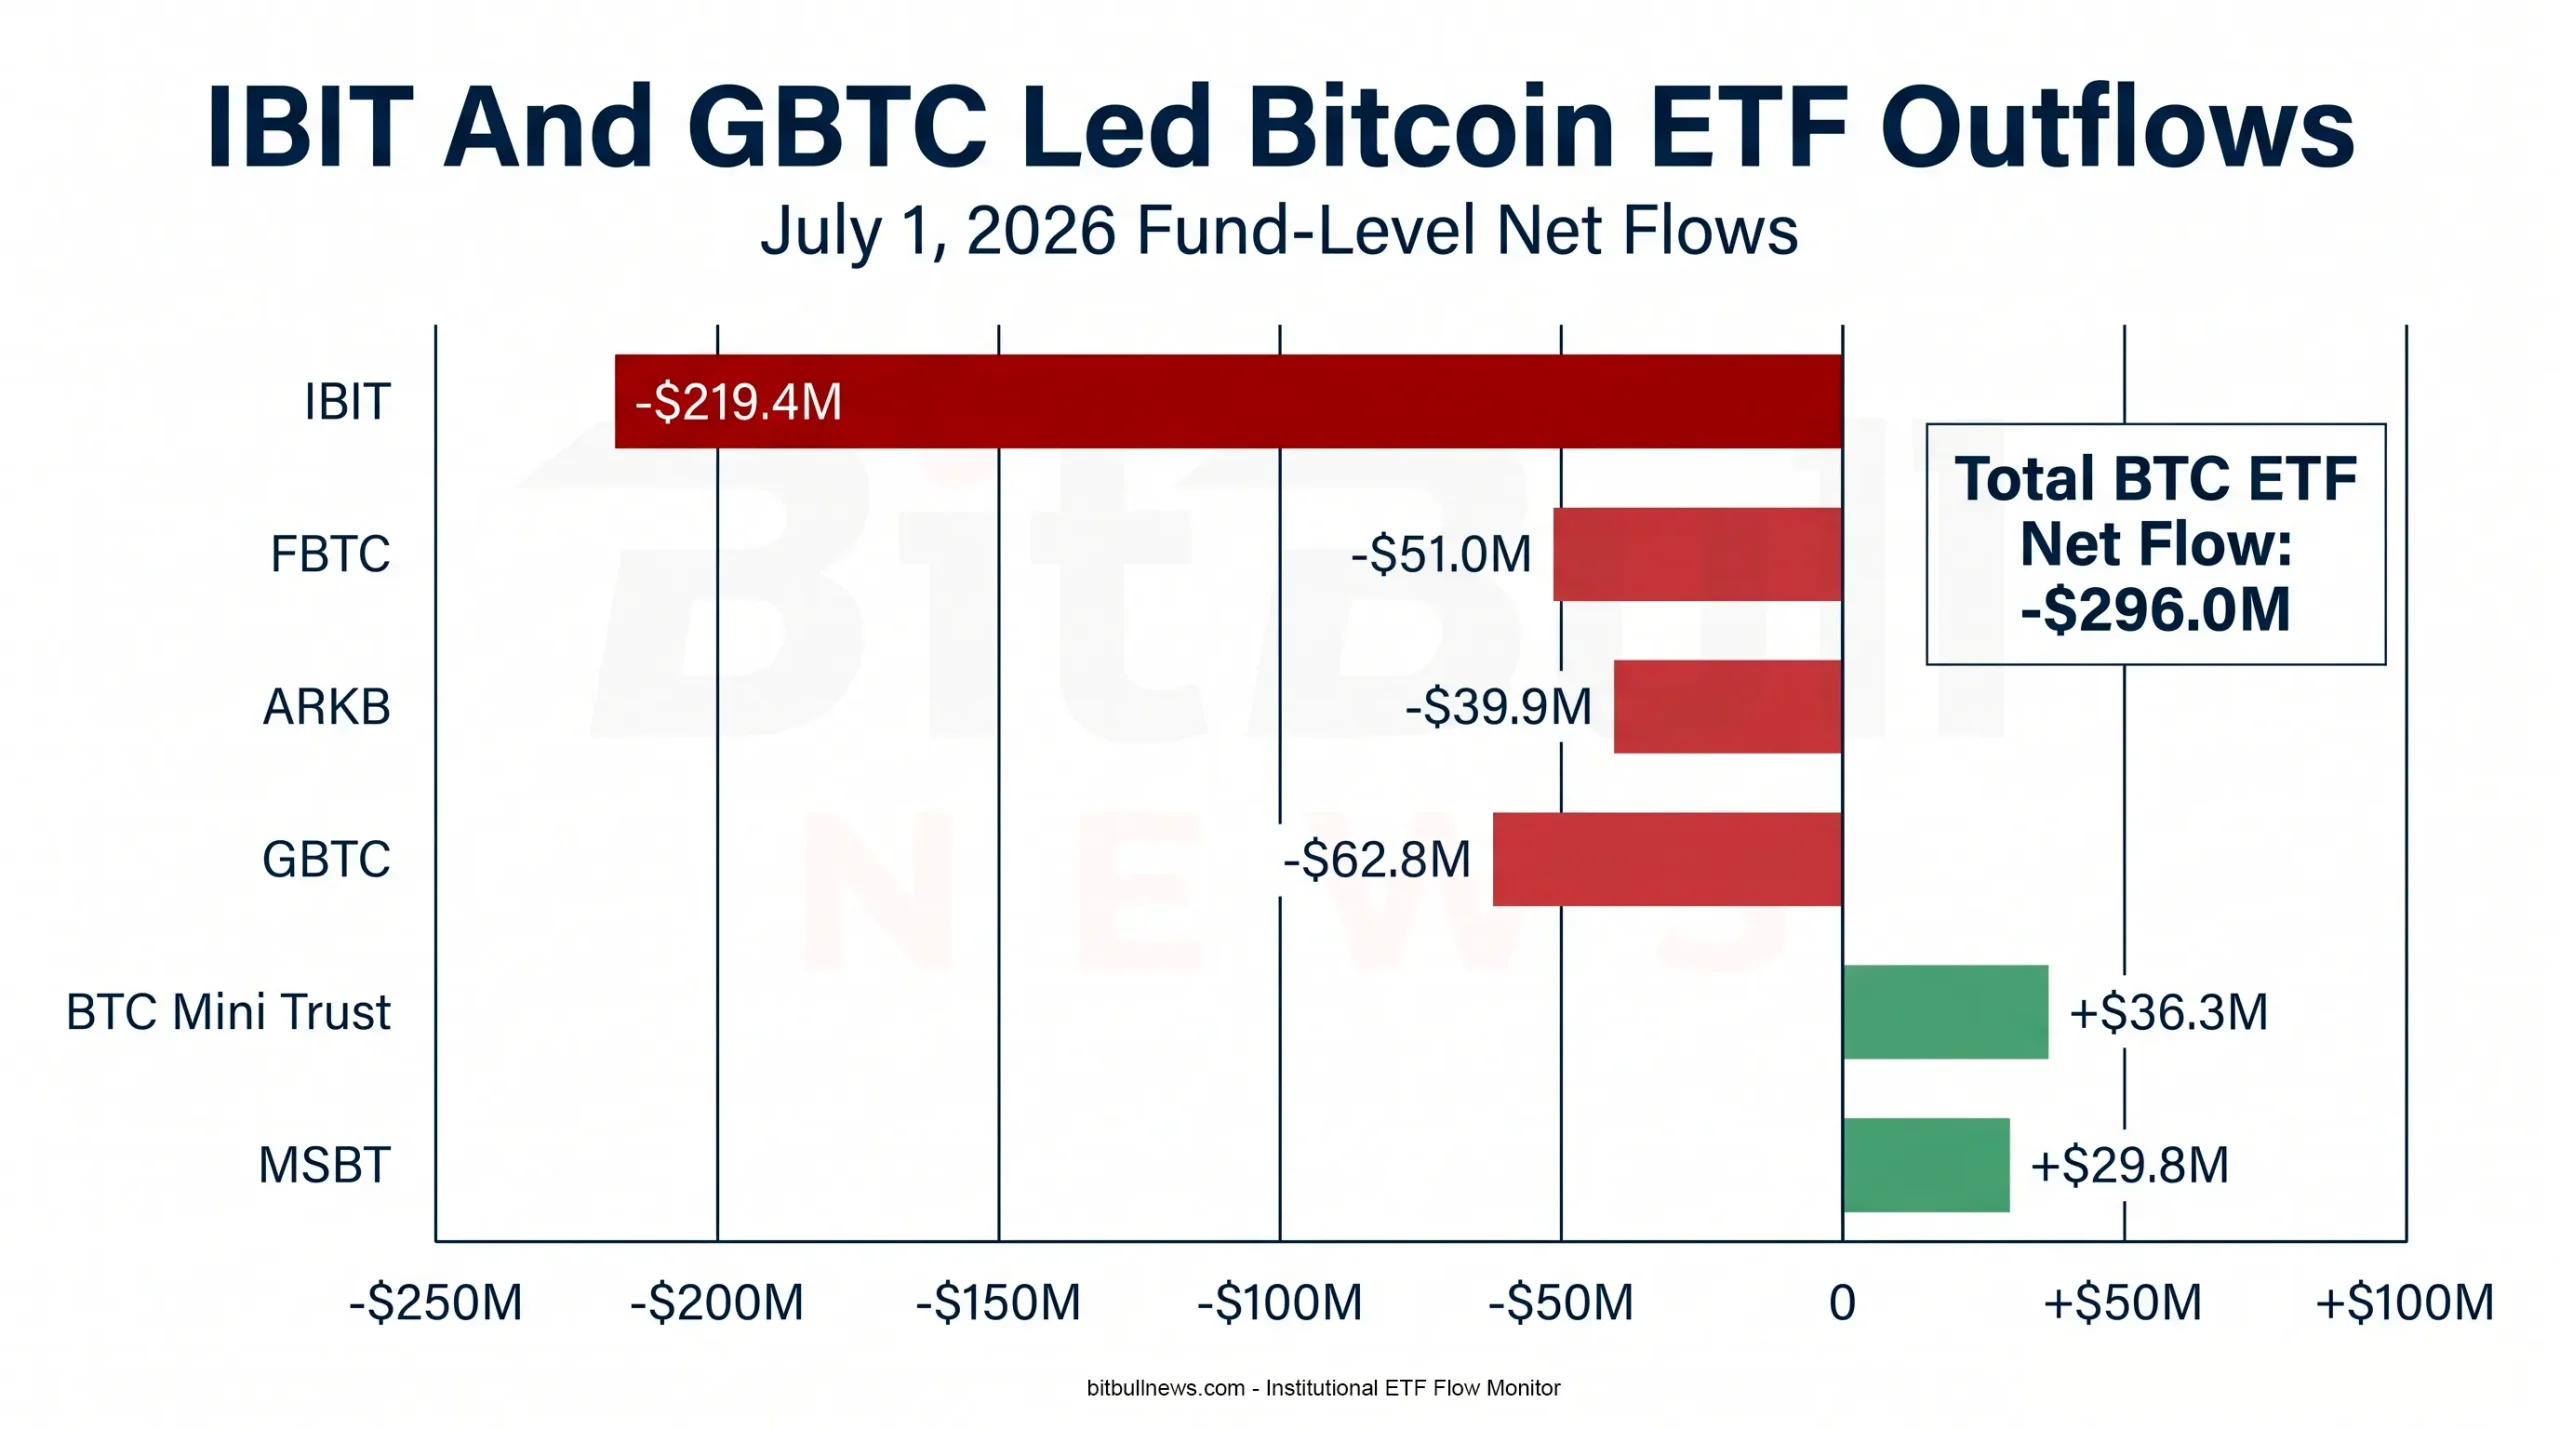
Chart: Horizontal Bar Chart Showing July 1 Bitcoin ETF Net Flows By Fund. Use Red Bars For IBIT, FBTC, ARKB, And GBTC Outflows; Green Bars For BTC Mini Trust, MSBT, BTCO, EZBC, And HODL Inflows.
Five Sessions Of BTC Outflows Changed The Tone
The last five completed sessions were not a one-day wobble.
Bitcoin ETFs posted negative net flows on June 25, June 26, June 29, June 30, and July 1. The daily totals were -$691.7 million, -$444.5 million, -$231.0 million, -$222.6 million, and -$296.0 million. That adds up to roughly -$1.89 billion.
| Date | BTC ETF Net Flow | Main Signal |
|---|---|---|
| June 25, 2026 | -$691.7M | Largest Outflow In The Five-Session Window |
| June 26, 2026 | -$444.5M | Redemption Pressure Continued |
| June 29, 2026 | -$231.0M | Outflows Slowed But Stayed Negative |
| June 30, 2026 | -$222.6M | IBIT Was The Main Drag |
| July 1, 2026 | -$296.0M | Outflows Re-Accelerated |
Farside’s long-run average daily total for Bitcoin ETFs is +$82.2 million. The July 1 outflow was about 3.6 times that average in the opposite direction. That is why this week matters: it is not just negative flow, it is a reversal against the long-run average regime.
Ethereum ETFs: A Small Rebound, Not A Full Turn
ETH ETFs managed a positive print on July 1, but the recovery is still thin.
Farside recorded +$14.8 million for the ETH ETF complex on July 1. ETHA attracted +$36.6 million, while ETHB and FETH saw small outflows of -$1.7 million and -$1.6 million. Grayscale’s ETH mini trust posted -$18.5 million, which cut into ETHA’s inflow.
| Ethereum ETF | July 1 Net Flow | Cumulative Net Flow | Read |
|---|---|---|---|
| ETHA | +$36.6M | +$11.10B | Still The Main ETH ETF Accumulator |
| ETHB | -$1.7M | +$519M | Small Outflow |
| FETH | -$1.6M | +$2.13B | Light Redemption |
| ETHE | $0.0M | -$5.33B | Legacy Drag Has Slowed Recently |
| ETH Mini Trust | -$18.5M | +$1.81B | Latest-Day Outflow Offset ETHA |
| Total ETH ETF Complex | +$14.8M | +$10.89B | Positive Day, Still Weak Week |
The ETH structure is different from BTC. ETHA carries the market, but the complex is smaller and more fragmented. Cumulative ETH ETF flows total $10.89 billion, far below Bitcoin’s $50.91 billion. That gap explains why ETH ETF flows can stabilize without changing the broader institutional crypto flow picture.
The price read is not cleanly bullish either. ETH rebounded from a June 30 close of $1,570.07 to $1,608.34 on July 1, but it remained more than 10% below its June 15 close of $1,795.04. A $14.8 million ETF inflow helps, but it does not yet signal a strong institutional re-accumulation cycle.
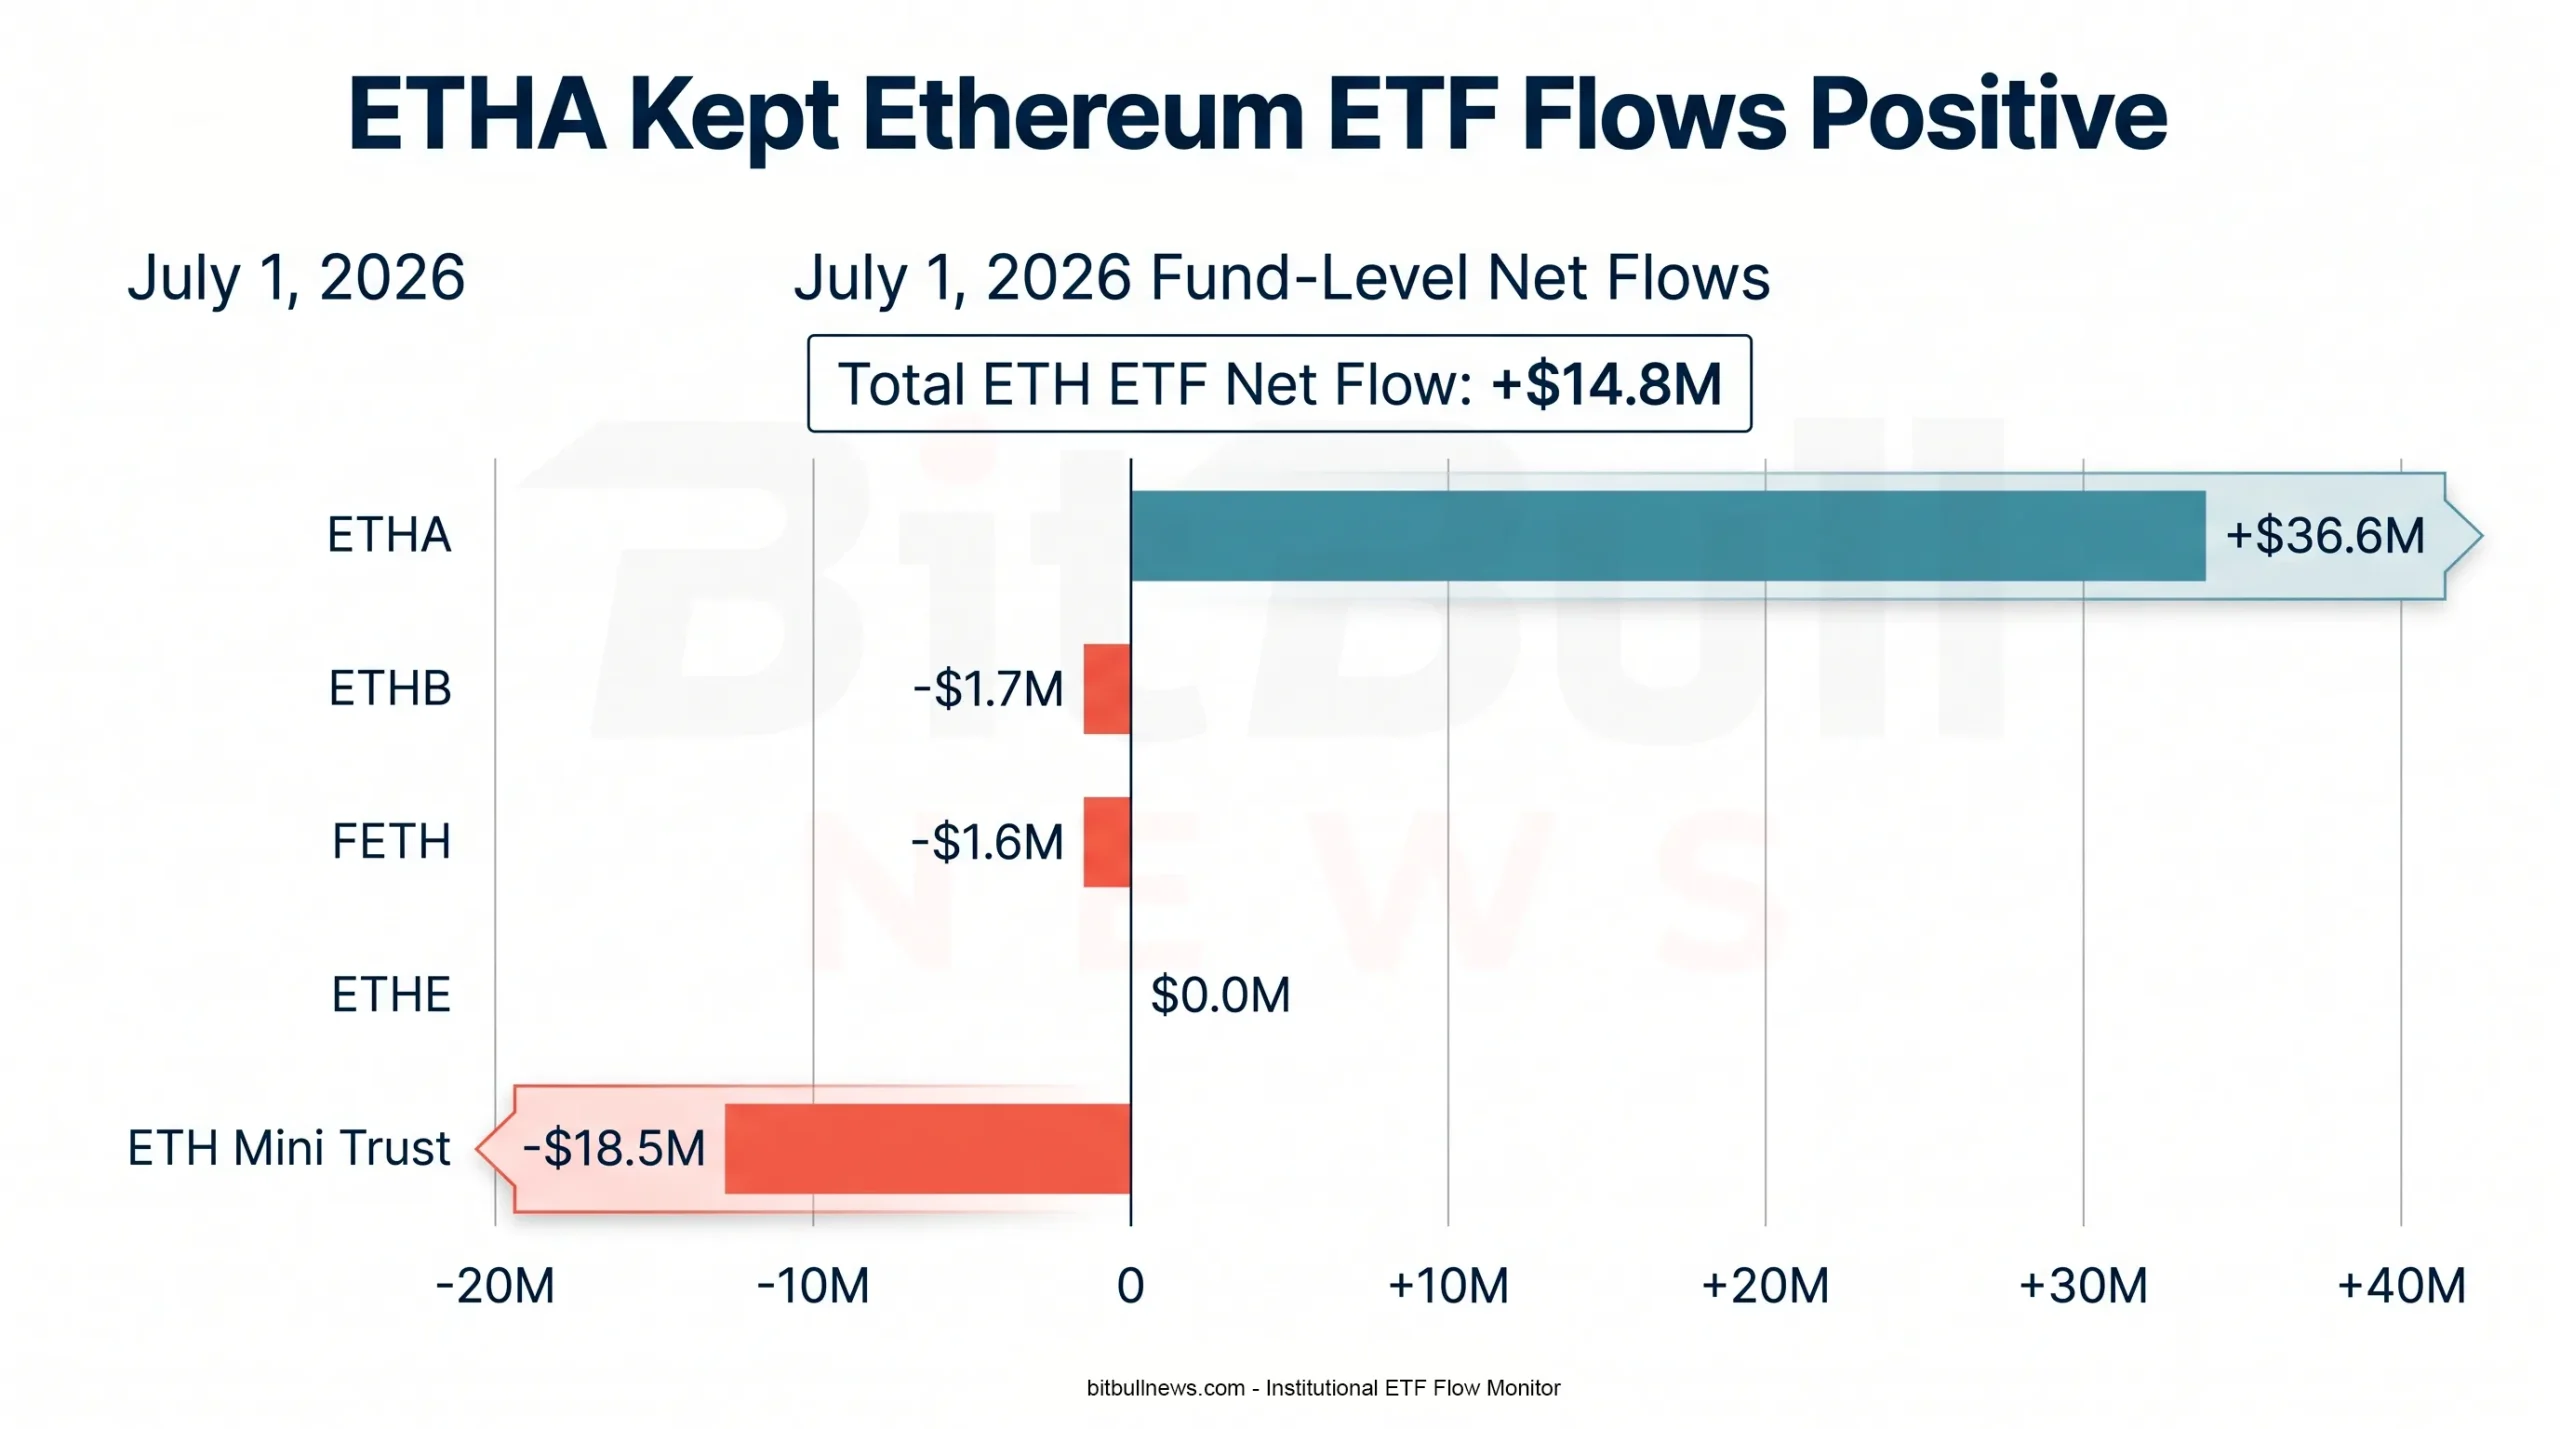
Chart: Stacked Bar Chart Showing ETH ETF July 1 Flows By Fund, With ETHA Inflow Compared Against ETHB, FETH, And ETH Mini Trust Outflows.
Smaller Crypto ETFs: Solana Stable, Hyperliquid Skewed, XRP Negative
The smaller crypto ETF market is alive, but it is not yet driving the institutional allocation cycle.
Farside showed Solana ETFs with +$0.5 million of net inflows on July 1 and +$1.13 billion of cumulative net inflows. That is a respectable cumulative base for a newer product category, but the latest daily flow is too small to matter for cross-asset liquidity.
Hyperliquid ETFs showed +$2.9 million on July 1 and +$302 million cumulative net inflows. The five-session number looks stronger at +$112.0 million, but almost all of that came from +$108.1 million on June 25. A single-day skew should not be mistaken for broad institutional rotation.
CryptoETF.today recorded -$1.8 million of XRP ETF net flow over the latest 24-hour snapshot, with $1.4 billion of tracked total inflows and +$326.7 million year-to-date. That puts XRP in the “monitored but secondary” bucket for now.
BlackRock Still Dominates, But Concentration Cuts Both Ways
BlackRock remains the most important issuer in the crypto ETF market.
IBIT’s cumulative net inflow of $60.03 billion is larger than the entire Bitcoin ETF complex’s net cumulative total of $50.91 billion, because GBTC’s cumulative outflows remain deeply negative. In practical terms, IBIT did not just win market share; it became the main institutional access point for Bitcoin exposure.
BlackRock’s own iShares page showed IBIT net assets of $43.23 billion as of June 30, with a sponsor fee of 0.25%, daily volume of 59.0 million shares, and a 30-day median bid/ask spread of 0.03%. That is institutional-grade liquidity by crypto standards.
The risk is concentration. When IBIT takes in capital, the whole Bitcoin ETF complex looks strong. When IBIT sees a $219.4 million outflow in a single session, the whole complex turns defensive. ETF market structure has made Bitcoin easier to buy through traditional brokerage accounts, but it has also created a visible institutional flow channel that markets now trade around.
ETF Flows Versus Price: The Clean Signal Broke
The clean bullish setup is simple: rising spot price, positive ETF flows, and low leverage stress. That is not the current setup.
BTC fell from $66,292 on June 15 to $59,968 on July 1, while the Bitcoin ETF complex printed a five-session outflow streak into the end of the month. ETH followed a similar price path, closing at $1,608.34 on July 1 after trading at $1,795.04 on June 15.
| Asset | June 15 Close | July 1 Close | Price Change | Latest ETF Flow Read |
|---|---|---|---|---|
| BTC | $66,292 | $59,968 | -9.5% | Five-Session BTC ETF Outflow Streak |
| ETH | $1,795.04 | $1,608.34 | -10.4% | Small July 1 ETF Inflow After Weak Week |
| SOL | N/A In This Dataset | N/A In This Dataset | N/A | ETF Flow Positive But Small |
| HYPE | N/A In This Dataset | N/A In This Dataset | N/A | Positive Flow Driven By One Large Session |
This is where ETF flows matter most. A spot price decline with ETF inflows can suggest accumulation into weakness. A spot price decline with ETF outflows says something different: regulated capital is reducing exposure into weakness, not absorbing it aggressively.
What The Flows Actually Mean
ETF flows are not perfect demand data. They measure the net dollar value of ETF share creations and redemptions, not every institutional trade. Still, they are one of the cleanest public signals for regulated capital movement because creations and redemptions run through ETF market plumbing rather than opaque exchange balances. CryptoETF.today describes ETF flow as the net dollar value of shares created minus shares redeemed on a given day, while CoinGlass says inflows and outflows reflect buying and selling activity at the ETF product level.
The current signal is defensive:
- Bitcoin ETFs are seeing persistent redemptions.
- ETH ETFs are stabilizing, but the dollar scale is much smaller.
- Smaller crypto ETF products remain marginal relative to BTC and ETH.
- IBIT remains structurally dominant, but latest-day outflows show that even the strongest product is not immune to de-risking.
- The ETF bid is no longer offsetting spot weakness in a clean way.
For traders, that weakens the “institutional floor” argument. For investors, it turns attention back to whether ETF outflows are temporary rebalancing or the start of a larger allocation cut. For issuers, it raises the importance of liquidity, fee pressure, and product differentiation.
Structural Risks To Watch
| Risk Area | Current Signal | Why It Matters |
|---|---|---|
| Flow Concentration | IBIT Drives The Bitcoin ETF Complex | One Product Can Swing The Daily Read |
| Legacy Trust Drag | GBTC Still Has -$27.17B Cumulative Net Flow | Fee And Conversion Effects Continue To Distort Aggregate Flows |
| ETH Scale Gap | ETH Cumulative Flow Is Roughly One-Fifth Of BTC’s | ETH ETF Flows Matter, But They Do Not Yet Anchor The Whole Market |
| Smaller ETF Liquidity | SOL, XRP, And HYPE Flows Are Small | Alt-ETF Signals Can Be Noisy And Single-Print Driven |
| Price-Flow Divergence | BTC And ETH Fell While ETF Demand Weakened | Spot Weakness Is Not Being Cleanly Absorbed By Regulated Buyers |
The main structural risk is not that ETFs stop working. The main risk is that markets overread them.
ETF flows are powerful because they are public, daily, and institutionally relevant. They are also incomplete. They do not capture hedge-fund basis trades, OTC accumulation, direct coin custody, options overlays, or corporate treasury activity. The cleanest analysis uses ETF flow as one signal inside the broader liquidity stack.
BitBullNews View
This is the weakest ETF tape in several weeks.
Bitcoin remains the flagship institutional product, but the July 1 print was ugly. The outflow was not isolated to GBTC. IBIT, FBTC, and ARKB all saw redemptions, which means the pressure reached the core products investors usually treat as the healthy side of the market.
Ethereum’s positive July 1 flow prevents the read from becoming fully risk-off across all crypto ETFs. But ETH’s scale is still too small to offset BTC outflows. Smaller ETF categories are not yet large enough to change the market’s institutional direction.
The market does not need massive inflows every day to stay healthy. It does need the bleeding to slow. A few more sessions of BTC ETF outflows above the long-run average would make the institutional allocation story harder to defend in the short term.
What To Watch Next
The first watch item is IBIT. If IBIT returns to inflows while GBTC continues to bleed, the market can argue that the outflows are product rotation. If IBIT keeps losing capital, the read is broader institutional de-risking.
The second watch item is BTC ETF net flow versus BTC price. A positive flow day while BTC stays below the June 15 level would suggest accumulation into weakness. Another large negative flow day would keep pressure on the spot market.
The third watch item is ETHA. ETHA is the cleanest ETH ETF demand proxy in the current table. Continued inflows into ETHA would help ETH recover some institutional credibility after a weak June.
The fourth watch item is alt-ETF persistence. Solana, XRP, and Hyperliquid products need multi-session inflow streaks before their flows deserve the same market weight as BTC or ETH.