



Content
U.S. crypto ETF demand strengthened for a second consecutive reporting period, but this week’s structure was materially healthier.

Spot Bitcoin funds attracted $710.5 million across the five completed sessions from July 16 through July 22. Spot Ether funds added $156.9 million, bringing combined net creations to $867.4 million. Bitcoin recorded inflows on every session. Ether was positive on four of five days.
The improvement was not limited to one reversal day. Bitcoin funds posted five consecutive positive sessions inside the monitoring period and six in a row when July 15 is included. Ether finished with its largest daily inflow of the week on July 22.
BlackRock remained the dominant allocator channel. IBIT captured $489.1 million, or 68.8% of Bitcoin’s weekly inflow. ETHA attracted $172.3 million — more than the entire Ether complex because Grayscale redemptions offset part of the gain.
The relative market signal was more balanced than the absolute dollar totals suggest. Bitcoin received more than four times as much capital, but ETH rose faster. Using Coin Metrics’ July 16 close and latest completed New York close available for the period, BTC gained approximately 2.70% while ETH advanced 4.47%.
July 23 U.S. flow data was not available at the reporting cutoff. All weekly calculations use the five completed sessions through July 22.
Weekly ETF Flow Scorecard
| Metric | Bitcoin ETFs | Ether ETFs | Combined Market |
|---|---|---|---|
| Net Flow, July 16–22 | +$710.5M | +$156.9M | +$867.4M |
| Positive Sessions | 5 Of 5 | 4 Of 5 | — |
| Largest Daily Inflow | +$226.8M | +$72.7M | +$264.8M |
| Largest Daily Outflow | None | -$28.0M | — |
| Average Daily Flow | +$142.1M | +$31.4M | +$173.5M |
| Cumulative Net Inflow Since Launch | $51.90B | $11.26B | $63.16B |
| Weekly Flow As Share Of Cumulative Net Inflow | 1.37% | 1.39% | 1.37% |
| Underlying Price Return | +2.70% | +4.47% | — |
The weekly flow-to-cumulative-flow ratios were almost identical. Bitcoin absorbed far more dollars, but Ether’s $156.9 million inflow was nearly equal to Bitcoin’s result relative to each market’s accumulated net creation base. BitBullNews calculations use Farside’s cumulative totals of $51.90 billion for Bitcoin funds and $11.26 billion for Ether funds.
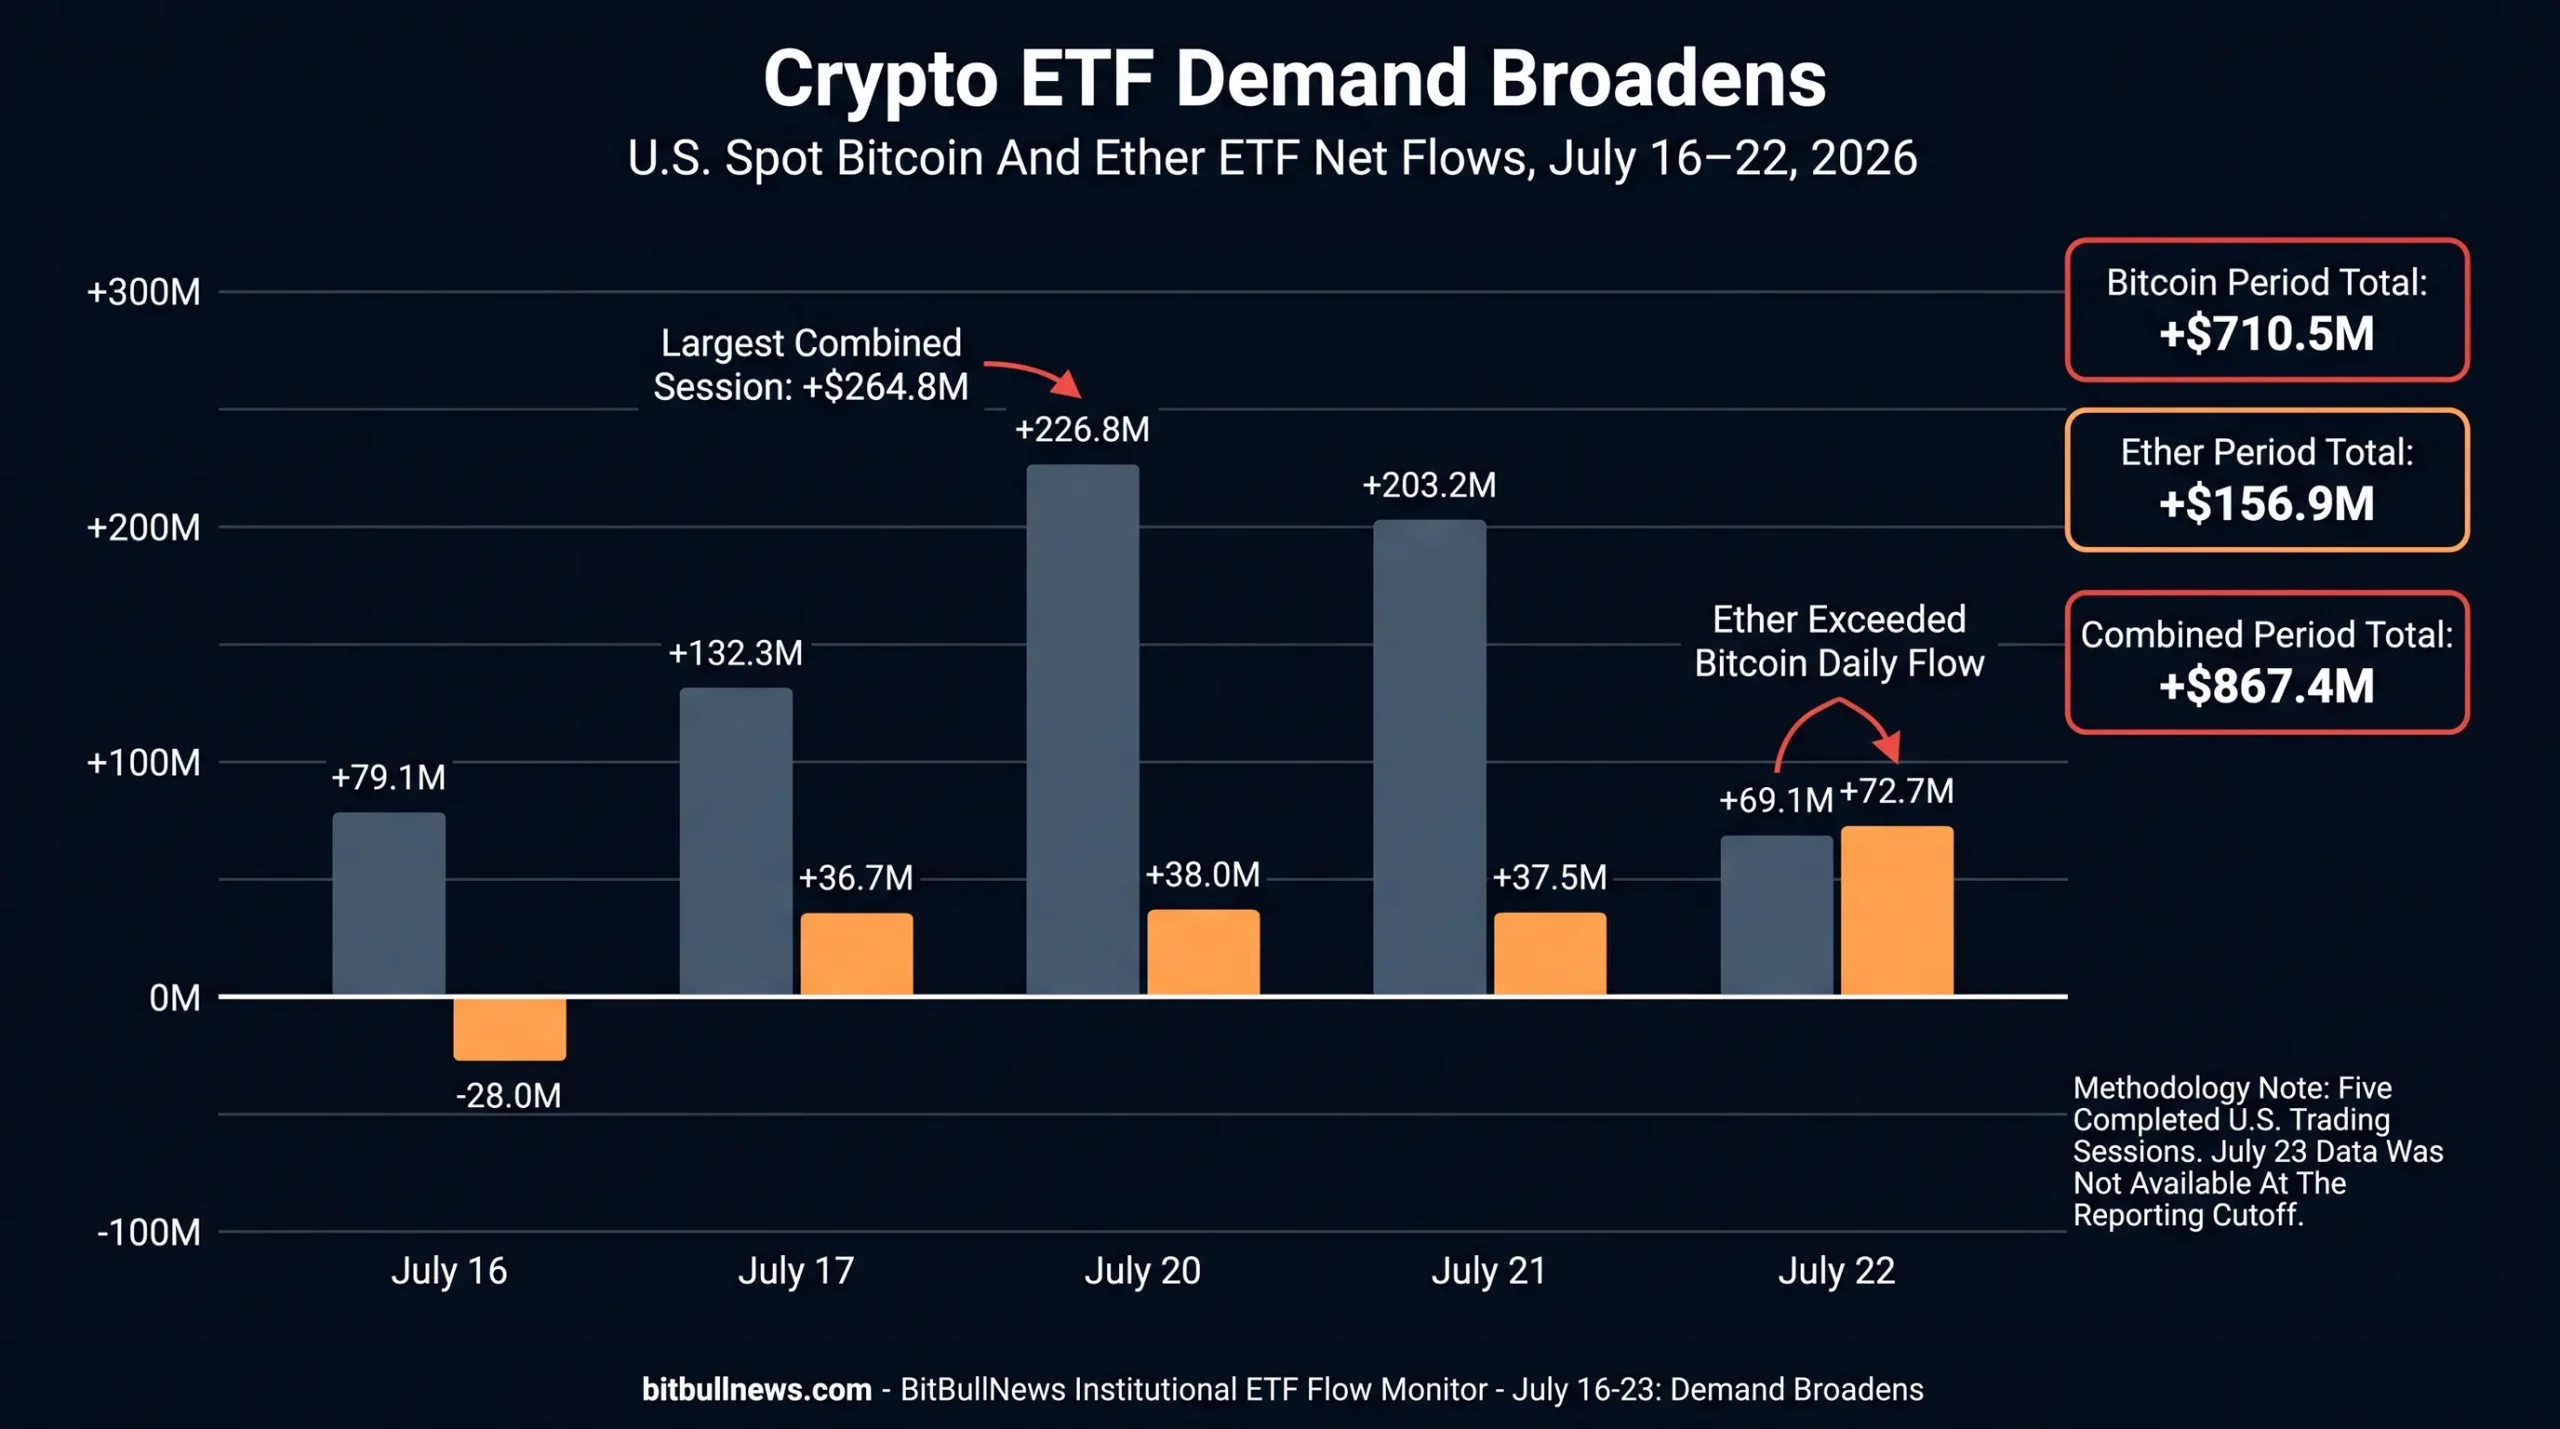
Grouped Daily Bar Chart Showing U.S. Spot Bitcoin And Ether ETF Net Flows From July 16 Through July 22, 2026. Show Five Trading Sessions, A Horizontal Zero Line And Cumulative Callouts Of +$710.5M For Bitcoin, +$156.9M For Ether And +$867.4M Combined.
The Flow Reversal Was Almost $1 Billion
The strongest comparison is not with the price chart. It is with the previous monitoring period.
From July 9 through July 15, Bitcoin funds lost $140.8 million while Ether funds gained $63.0 million. The combined market recorded a $77.8 million outflow.
This week, combined demand improved by $945.2 million.
| Monitoring Period | Bitcoin ETFs | Ether ETFs | Combined Market |
|---|---|---|---|
| July 9–15 | -$140.8M | +$63.0M | -$77.8M |
| July 16–22 | +$710.5M | +$156.9M | +$867.4M |
| Week-Over-Week Swing | +$851.3M | +$93.9M | +$945.2M |
Bitcoin produced nearly all of that reversal. The prior week had been distorted by a $270.9 million withdrawal from Fidelity’s FBTC and a broader July 13 redemption wave. FBTC returned to positive territory this week, while several competing funds attracted capital at the same time.
Ether’s change was less dramatic because its funds were already positive during the previous period. The important improvement was acceleration: weekly ETH inflows increased by almost $94 million while the underlying asset outperformed Bitcoin.
Daily Flows Became Consistently Positive
| Trading Date | Bitcoin ETF Flow | Ether ETF Flow | Combined Flow |
|---|---|---|---|
| July 16 | +$79.1M | -$28.0M | +$51.1M |
| July 17 | +$132.3M | +$36.7M | +$169.0M |
| July 20 | +$226.8M | +$38.0M | +$264.8M |
| July 21 | +$203.2M | +$37.5M | +$240.7M |
| July 22 | +$69.1M | +$72.7M | +$141.8M |
| Period Total | +$710.5M | +$156.9M | +$867.4M |
Bitcoin demand peaked on July 20 and remained above $200 million on July 21. The final session slowed to $69.1 million, but it did not reverse.
Ether showed the opposite pattern. Its strongest result came on July 22, when $72.7 million entered the complex. That was the only session in which ETH funds attracted more capital than Bitcoin funds.
The sequence matters. Bitcoin led the initial allocation wave. Ether strengthened later, after its price had already begun outperforming BTC.
That creates a more credible rotation signal than a single large creation day. It still requires follow-through. One strong ETH session does not establish a durable shift in institutional preference.
Bitcoin Demand Broadened Beyond One Fund
BlackRock remained dominant, but Bitcoin’s weekly result was not dependent on IBIT alone.
| Bitcoin Fund | Issuer | Net Flow, July 16–22 | Share Of Net Weekly Flow |
|---|---|---|---|
| IBIT | BlackRock | +$489.1M | 68.8% |
| FBTC | Fidelity | +$95.2M | 13.4% |
| BTC | Grayscale Bitcoin Mini Trust | +$85.8M | 12.1% |
| ARKB | 21Shares | +$82.4M | 11.6% |
| BITB | Bitwise | +$29.2M | 4.1% |
| MSBT | Morgan Stanley | +$10.7M | 1.5% |
| HODL | VanEck | +$1.8M | 0.3% |
| BTCO | Invesco | $0.0M | 0.0% |
| EZBC | Franklin Templeton | $0.0M | 0.0% |
| BRRR | Valkyrie | $0.0M | 0.0% |
| BTCW | WisdomTree | $0.0M | 0.0% |
| GBTC | Grayscale | -$83.7M | -11.8% |
| Total | — | +$710.5M | 100.0% |
Fund percentages use net market flow as the denominator and therefore sum above 100% before GBTC’s offsetting outflow.
Fidelity’s return to inflows was especially important. FBTC added $95.2 million after producing the largest issuer-level drag during the previous period.
ARKB also attracted $82.4 million, while Bitwise, Morgan Stanley and VanEck finished positive. Seven Bitcoin funds recorded net inflows, one recorded an outflow and four were flat. That is broader participation than a market in which IBIT is the only consistent source of creations.
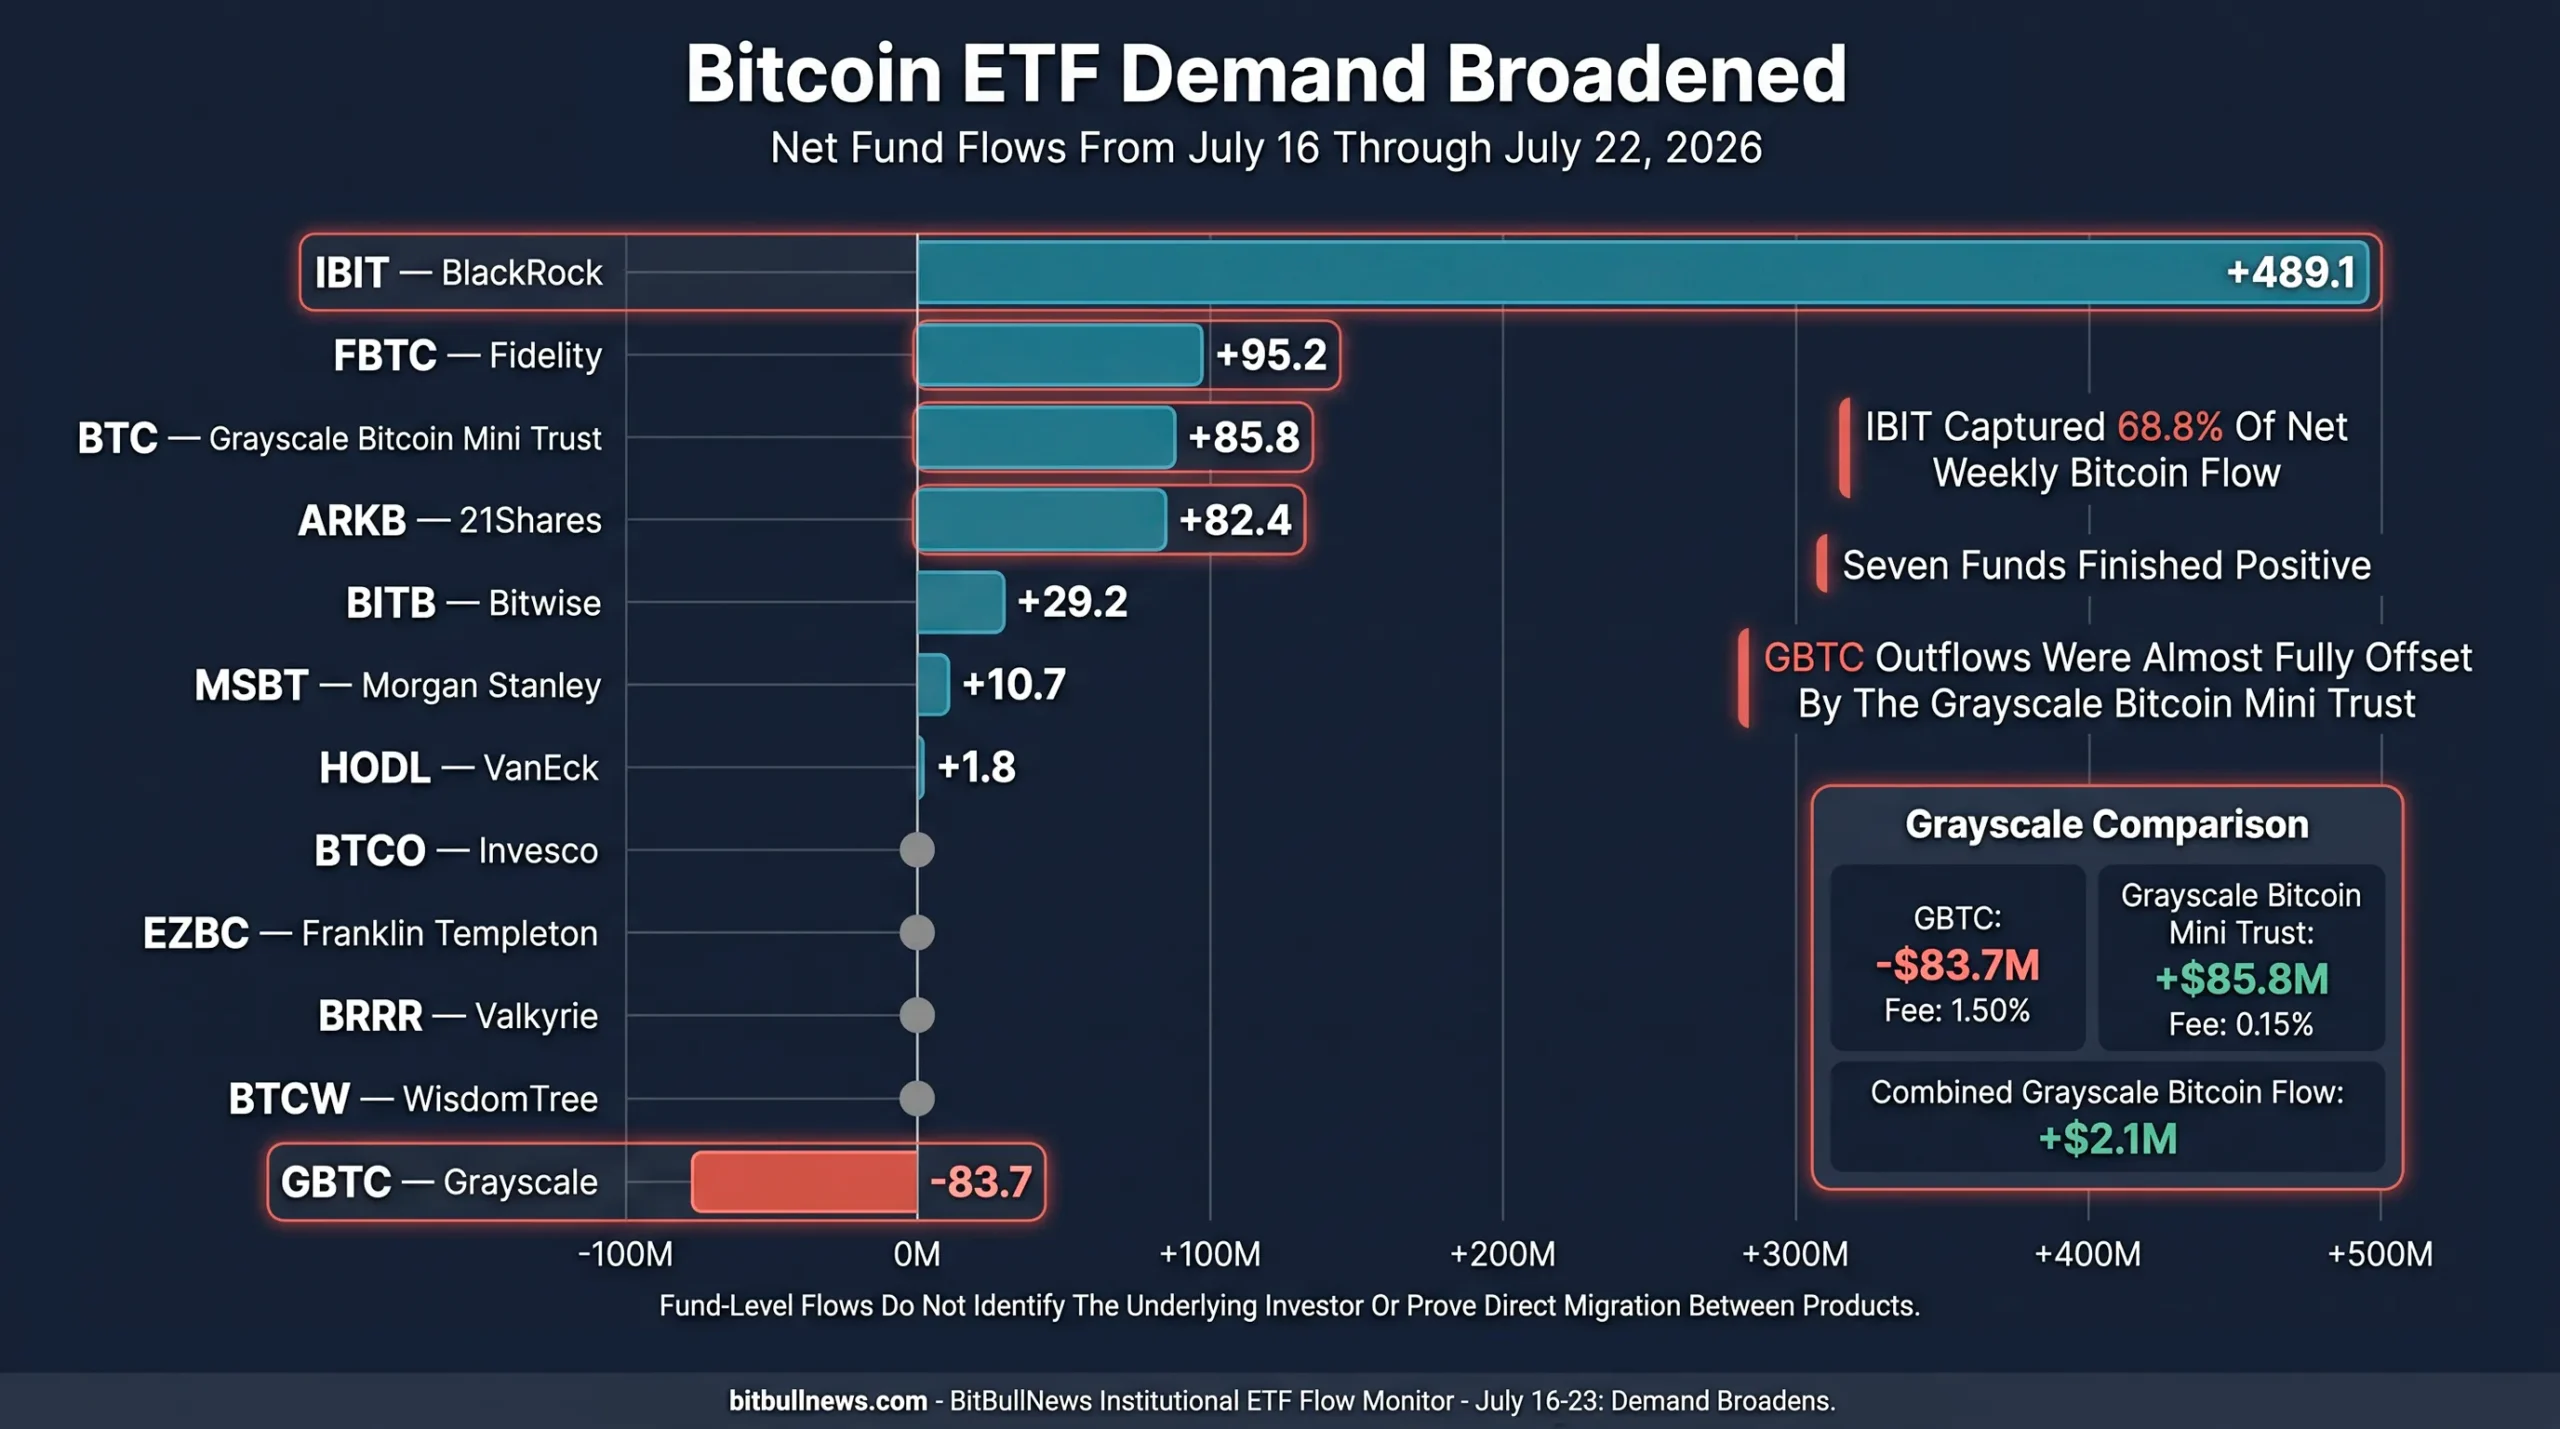
Horizontal Diverging Bar Chart Showing Bitcoin ETF Net Flows By Fund From July 16 Through July 22. Highlight IBIT At +$489.1M, FBTC At +$95.2M, Grayscale BTC At +$85.8M, ARKB At +$82.4M And GBTC At -$83.7M.
Grayscale’s Two Bitcoin Products Nearly Cancelled Each Other Out
GBTC lost $83.7 million during the period. The lower-fee Grayscale Bitcoin Mini Trust attracted $85.8 million.
The two flows differed by only $2.1 million.
Public flow data cannot establish that the same investors sold GBTC and bought the Mini Trust. The pattern is nevertheless consistent with continued wrapper migration. Farside lists GBTC’s fee at 1.50% and the Mini Trust’s fee at 0.15%.
This changes the interpretation of Grayscale’s headline outflow.
At the issuer level, Grayscale’s two Bitcoin products produced a combined net inflow of approximately $2.1 million. The legacy fund continued losing capital, but Grayscale retained almost the same amount through its cheaper product.
For market-wide demand analysis, GBTC’s outflow was real. For issuer-competition analysis, it was largely neutralized.
Ether’s Positive Week Was Still A BlackRock Story
Ether’s net result remained far more concentrated.
| Ether Fund | Issuer | Net Flow, July 16–22 |
|---|---|---|
| ETHA | BlackRock | +$172.3M |
| ETHW | Bitwise | +$2.3M |
| TETH | 21Shares | +$0.9M |
| FETH | Fidelity | +$0.5M |
| ETHB | BlackRock Staked Ethereum Trust | $0.0M |
| ETHV | VanEck | $0.0M |
| QETH | Invesco | $0.0M |
| EZET | Franklin Templeton | $0.0M |
| ETHE | Grayscale | -$4.8M |
| ETH | Grayscale Ethereum Mini Trust | -$14.3M |
| Total | — | +$156.9M |
ETHA generated 109.8% of the market’s net weekly inflow. Redemptions from Grayscale’s two products reduced the final total, while every non-BlackRock positive contribution combined added only $3.7 million.
This is stronger demand than the previous week, but not broader demand.
The distinction matters because a sustained institutional ETH allocation cycle should eventually appear across multiple distribution platforms. BlackRock can bring substantial capital into the market, but adviser access, custody preferences and client mandates differ across issuers.
Fidelity’s FETH finished almost flat at positive $0.5 million. That was an improvement from the prior period’s $47.2 million outflow, though it did not become a meaningful source of net demand.
The Staking Wrapper Still Failed To Capture New Money
BlackRock’s ETHB recorded no net creation or redemption during any of the five sessions.
That happened even though the fund offered a differentiated return profile. As of July 22, BlackRock reported a 30-day staking rewards rate of 1.62%, net assets of $554.1 million and a temporary sponsor-fee waiver that reduces the fee on qualifying assets during the waiver period.
ETHA, the conventional unstaked product, attracted $172.3 million and ended July 22 with $5.55 billion in net assets. ETHB remained around one-tenth of ETHA’s size.
The week suggests that institutional allocators continued prioritizing the larger, simpler and more established wrapper over the additional yield available through staking.
That conclusion has limits. Zero net creations do not mean ETHB had no secondary-market trading or investor demand. Buyers and sellers can exchange existing shares without changing the number of shares outstanding.
The primary-market signal is narrower: new net capital did not enter ETHB this week.
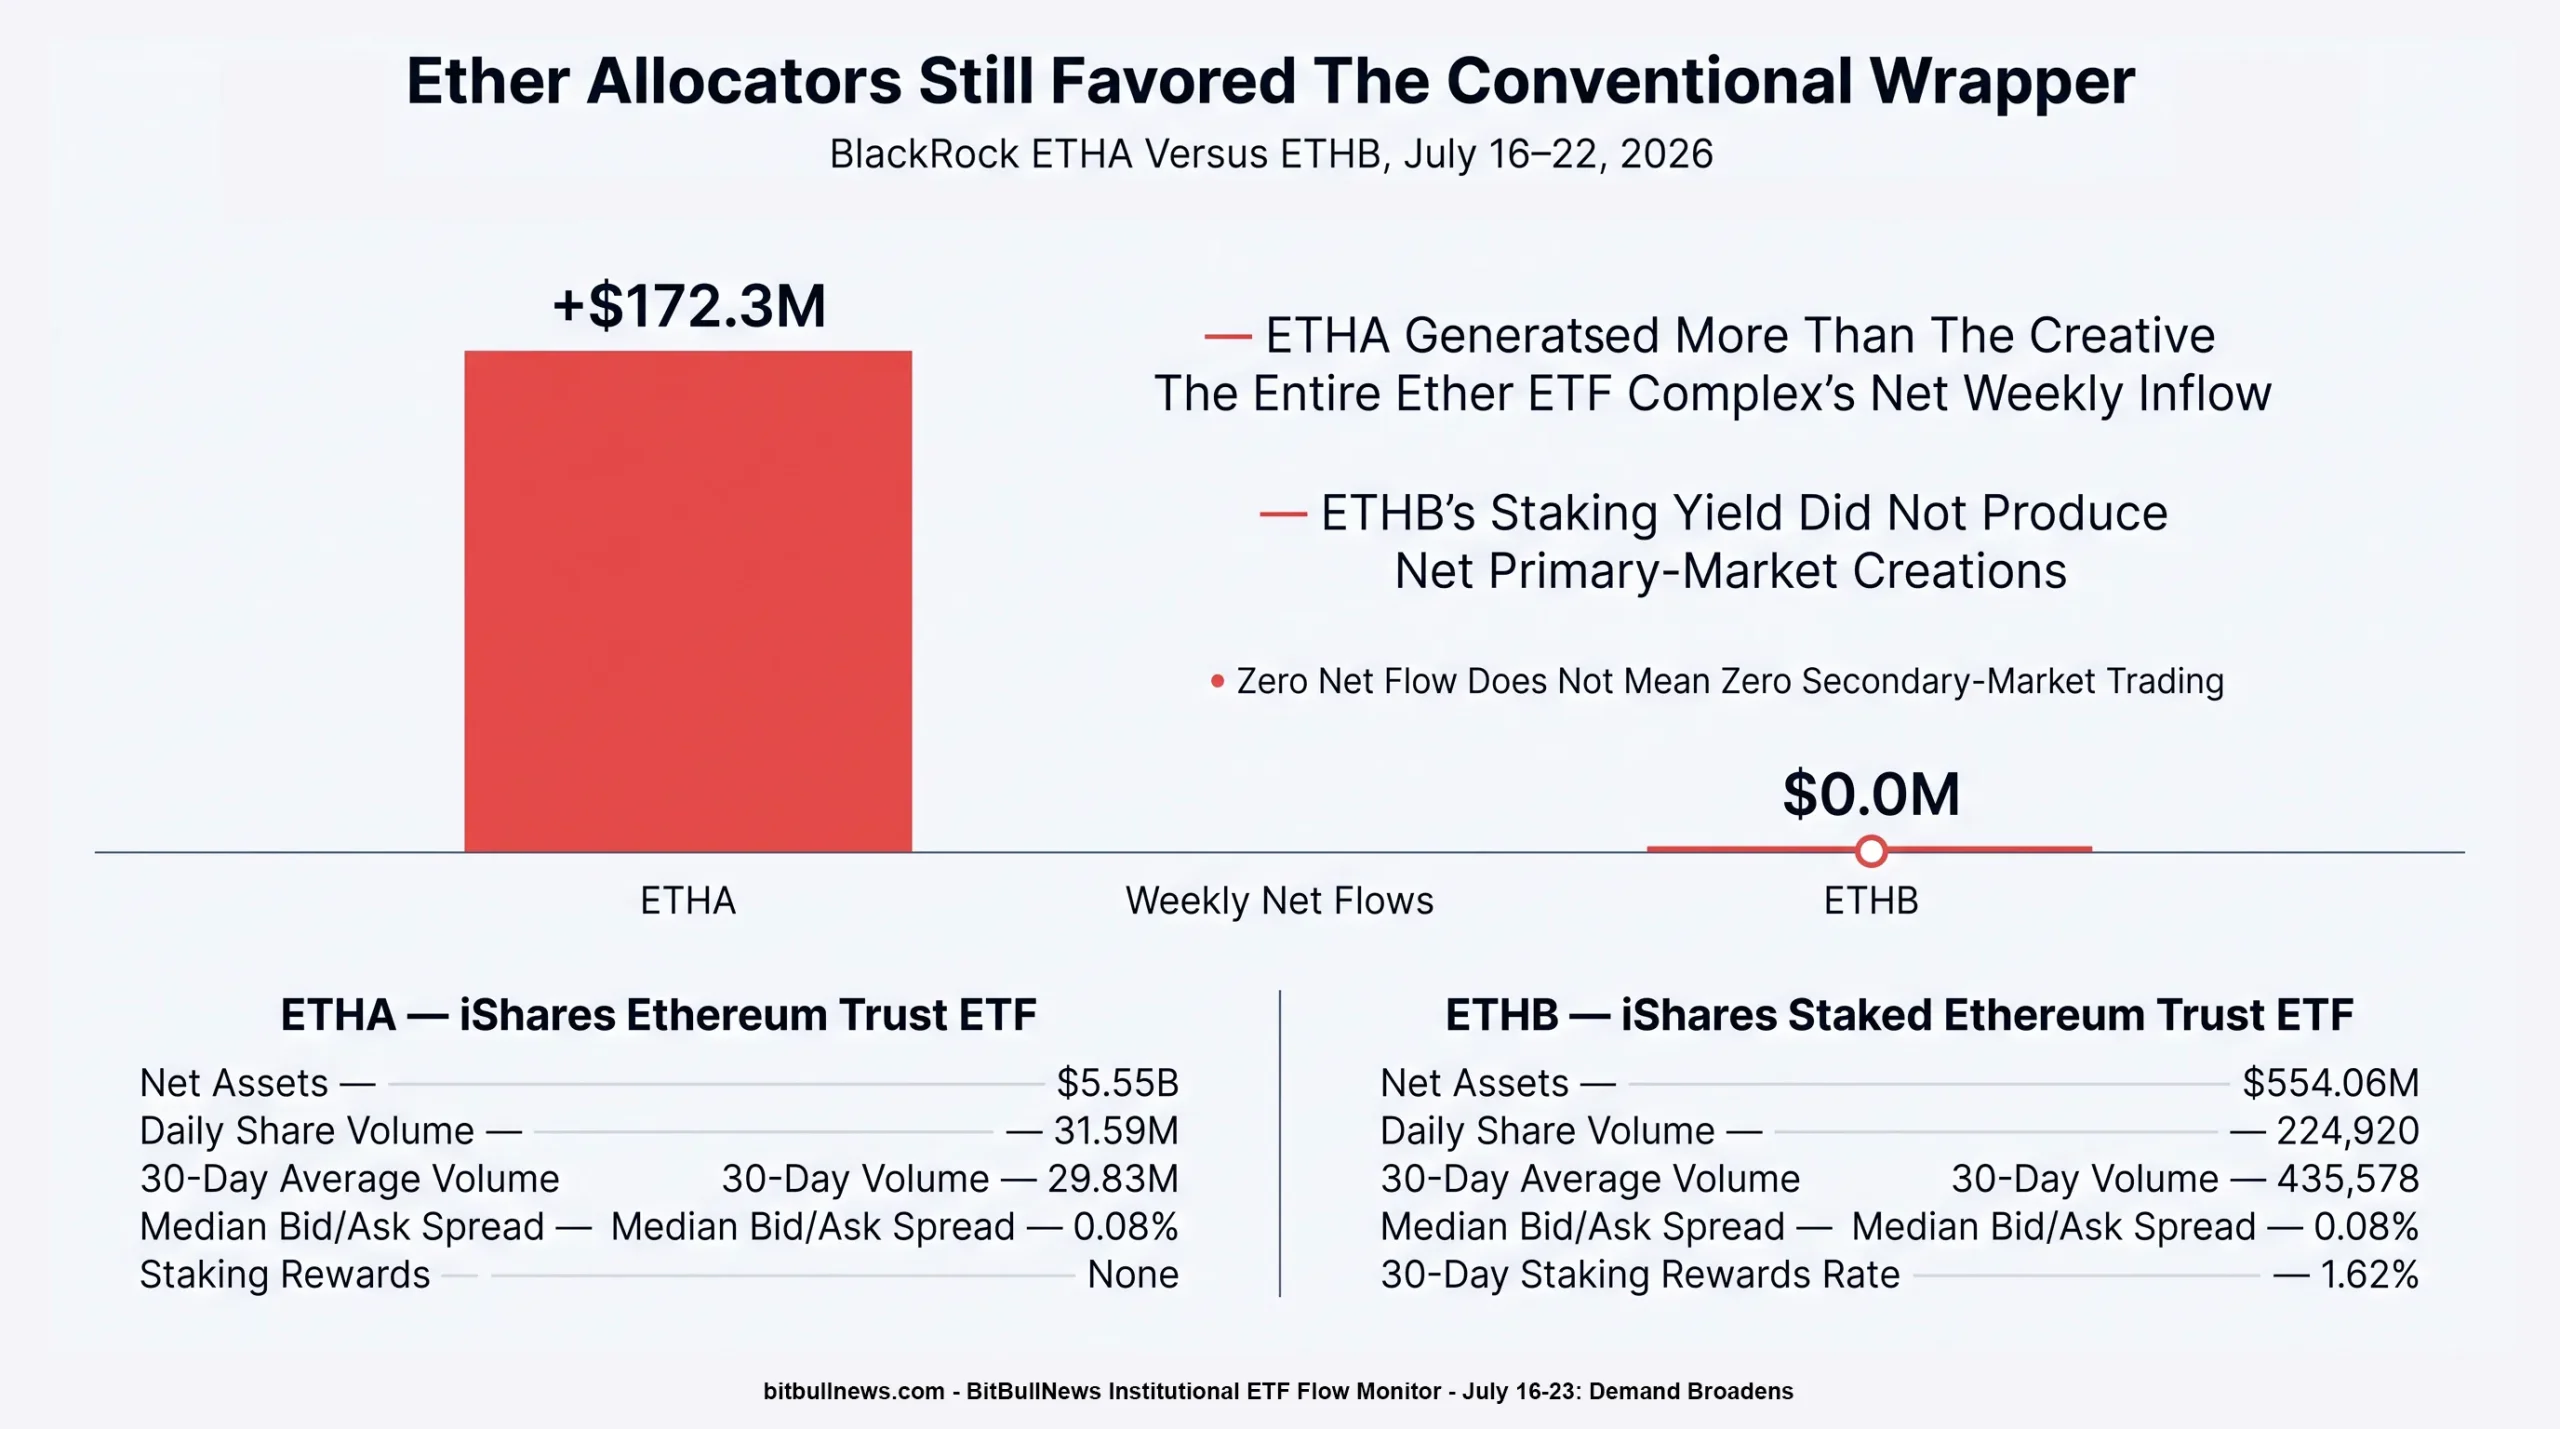
Two-Product Comparison Showing ETHA Weekly Net Flow Of +$172.3M Versus ETHB At $0.0M. Add Separate Cards Showing ETHA Net Assets Of $5.55B, ETHB Net Assets Of $554.1M And ETHB’s 1.62% 30-Day Staking Rewards Rate.
Ether Delivered The Stronger Price Response
ETF flows and underlying performance pointed in the same direction for both assets.
Bitcoin rose from a July 16 Coin Metrics close of $64,124 to the latest completed close of approximately $65,858, a gain of 2.70%. Ether advanced from $1,842.95 to approximately $1,925.28, gaining 4.47%. ETH outperformed by about 1.76 percentage points.
| Asset | Period ETF Flow | Period Price Return | Flow Interpretation |
|---|---|---|---|
| Bitcoin | +$710.5M | +2.70% | Large absolute demand with steady price appreciation |
| Ether | +$156.9M | +4.47% | Smaller absolute demand but stronger relative price response |
| ETH Minus BTC | — | +1.76 Percentage Points | ETH converted a smaller flow base into greater performance |
This does not mean one ETF dollar has a fixed price effect.
Bitcoin and Ether have different market capitalizations, liquidity profiles, derivatives markets and available supply. ETF flows can also be hedged before they appear in end-of-day data. Price formation continues around the clock outside U.S. trading hours.
The combination still provides a useful market-structure signal. Bitcoin received the deeper institutional allocation. Ether showed the stronger marginal response.
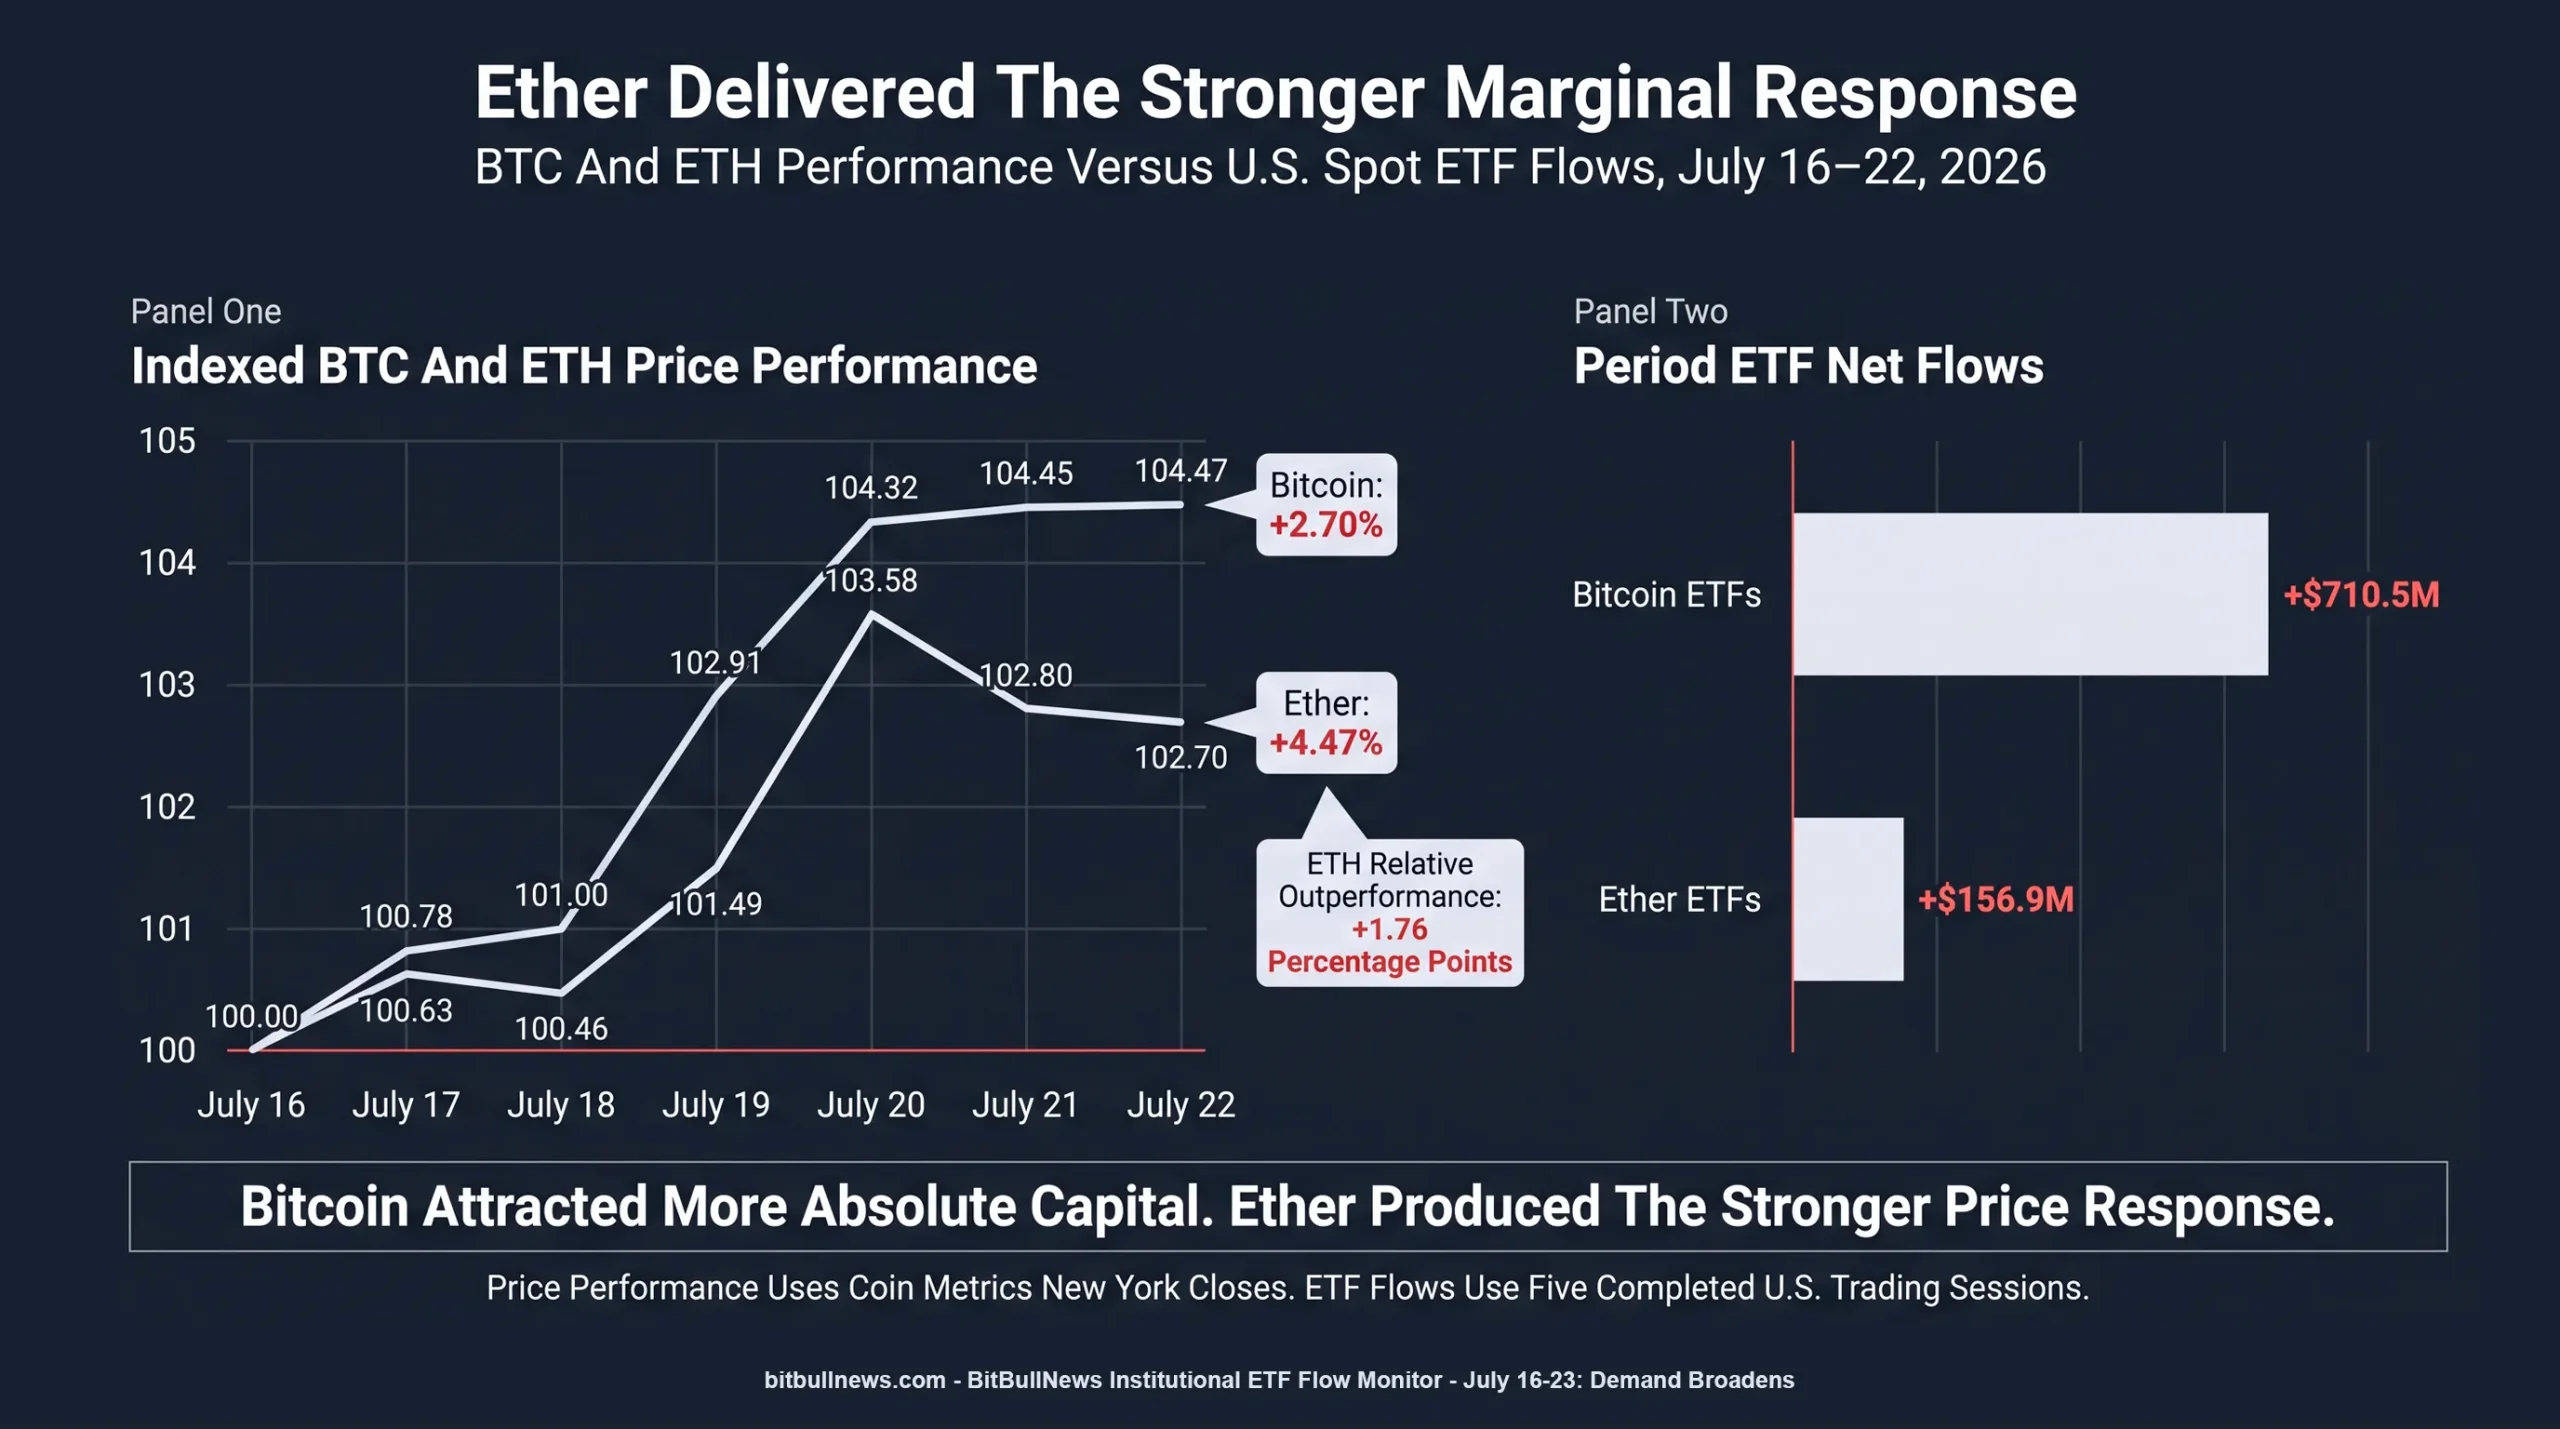
Indexed Dual-Line Chart Comparing BTC And ETH From July 16 Through July 22, With Both Assets Starting At 100. Add Period Returns Of +2.70% For BTC And +4.47% For ETH, Plus A Secondary Panel Showing Cumulative ETF Flows Of +$710.5M And +$156.9M.
Flow Intensity Was More Balanced Than The Dollar Totals
Bitcoin represented 81.9% of combined weekly crypto ETF inflows. Ether accounted for 18.1%.
That split closely matches the market’s cumulative net-flow structure. Bitcoin funds had accumulated $51.90 billion in net inflows by July 22, versus $11.26 billion for Ether funds. Bitcoin represented approximately 82.2% of that combined cumulative base.
The weekly allocation was therefore not disproportionately Bitcoin-heavy relative to the existing ETF market.
Measured against cumulative net inflows:
- Bitcoin’s weekly inflow represented approximately 1.37%.
- Ether’s weekly inflow represented approximately 1.39%.
The absolute dollars favored BTC. The relative allocation intensity was almost equal.
This is a more useful comparison than treating $710.5 million and $156.9 million as directly equivalent demand signals. The two ETF markets operate from very different starting sizes.
BlackRock Captured Three-Quarters Of The Rebound
IBIT and ETHA attracted a combined $661.4 million.
That represented 76.3% of the $867.4 million entering Bitcoin and Ether funds during the period.
BlackRock’s dominance was stronger in Ether than Bitcoin. IBIT accounted for 68.8% of BTC inflows, while ETHA generated more than 100% of net ETH inflows after competitor redemptions.
The concentration creates two competing interpretations.
The positive reading is distribution power. BlackRock can move regulated capital into crypto through established institutional and adviser channels.
The weaker reading is dependency. If flows into the leading BlackRock products slow, the rest of the market may not yet be deep enough to replace them.
Bitcoin showed signs of reducing that dependency because Fidelity, 21Shares, Grayscale’s Mini Trust and Bitwise all attracted capital. Ether did not.
Bitcoin Retained The Execution Advantage
BlackRock’s product data shows why large allocators may continue favoring Bitcoin even when Ether produces the stronger short-term return.
| Product | Exposure | Net Assets, July 22 | Daily Share Volume | 30-Day Average Volume | Median Bid/Ask Spread |
|---|---|---|---|---|---|
| IBIT | Bitcoin | $48.82B | 23.34M | 44.53M | 0.03% |
| ETHA | Ether | $5.55B | 31.59M | 29.83M | 0.08% |
| ETHB | Staked Ether | $554.06M | 224,920 | 435,578 | 0.08% |
IBIT held almost 8.8 times the net assets of ETHA and nearly 88 times the assets of ETHB. Its 30-day median bid/ask spread was 0.03%, compared with 0.08% for both Ether products.
ETHA’s daily share volume exceeded IBIT’s on July 22, but share counts are not directly comparable because the products trade at different prices. The spread and asset figures provide the cleaner institutional comparison.
IBIT remains the deeper capital pool. ETHA is liquid enough to support substantial allocations but still carries a wider execution spread. ETHB remains a specialist product with materially lower secondary-market volume.
The Weekly Inflow Rate Exceeded The Historical Pace
Farside’s displayed average daily net flows stood at approximately $82.0 million for Bitcoin funds and $22.5 million for Ether funds as of July 22.
This week’s averages were:
- Bitcoin: $142.1 million per session.
- Ether: $31.4 million per session.
Bitcoin ran approximately 73% above its displayed long-run daily average. Ether ran roughly 39% above its own average.
That confirms that the week was stronger than a routine positive period.
It does not erase the larger 2026 damage. Bitcoin and Ether remained well below their earlier cycle highs, and the ETF market was still rebuilding after substantial redemptions in prior months.
The current result should be described as a strong allocation week, not proof that the broader institutional drawdown has fully reversed.
ETF Flows Still Do Not Identify The End Investor
Net creations and redemptions are processed through authorized participants. The underlying demand can originate from asset managers, hedge funds, advisers, family offices or retail brokerage accounts.
BlackRock’s product documents state that ordinary investors trade shares in the secondary market, while only authorized participants can create or redeem large baskets directly with the trusts.
ETF flow data therefore measures changes in regulated-wrapper supply. It does not disclose:
- The identity of the final investor.
- Whether the position is strategic or tactical.
- Whether the exposure is hedged through futures or options.
- Whether a redemption reflects bearish conviction or a move into another wrapper.
- Whether the capital originated from a new crypto allocation or portfolio rebalancing.
Those limitations do not make the data weak. They define what the data can prove.
This week proves that the U.S. ETF structure expanded by a net $867.4 million. It does not prove that every dollar represented unhedged long-term institutional conviction.
What Allocators Should Watch Next
Whether Bitcoin Extends The Inflow Streak
Bitcoin funds completed six consecutive positive sessions through July 22 when July 15 is included.
The next test is duration. A longer run would show that demand can persist after the initial post-redemption recovery. A sudden negative session would not invalidate the trend, but repeated redemptions would.
Whether Ether Demand Broadens Beyond ETHA
ETHA has now carried the Ether complex across consecutive reporting periods.
The stronger confirmation would be simultaneous inflows into FETH, ETHW and ETHB. Until then, the ETH allocation signal remains strong but concentrated.
Whether GBTC Continues Funding The Mini Trust
The near-perfect weekly offset between GBTC and the Grayscale Bitcoin Mini Trust is unlikely to persist at exactly the same scale.
Continued GBTC redemptions accompanied by Mini Trust inflows would support the wrapper-migration interpretation. GBTC outflows without offsetting demand would be more negative for Grayscale and the broader market.
Whether ETHB Captures Any Primary-Market Demand
ETHB’s staking rewards did not produce net creations this week.
A shift from zero to consistent inflows would show that allocators are beginning to value staking income enough to accept the product’s added operational and liquidity risks.
Whether Price And Flow Remain Aligned
Both assets rose alongside positive ETF demand. Ether delivered the stronger price response.
If flows stay positive while prices flatten, the market may be absorbing supply from other holders. If prices rise while ETF flows weaken, derivatives and offshore spot markets will be doing more of the work.
Whether BlackRock’s Share Declines Through Broader Participation
BlackRock’s products captured more than three-quarters of combined inflows.
A lower BlackRock share would not necessarily signal weakness if total flows remain strong. It could instead show that institutional access is expanding across more platforms.
Institutional ETF Risk Dashboard
| Signal | Current Reading | Interpretation | Confirmation Needed |
|---|---|---|---|
| Bitcoin Weekly Flow | +$710.5M | Strongest source of absolute regulated demand | Continued positive sessions |
| Ether Weekly Flow | +$156.9M | Accelerating allocation into ETH exposure | Broader issuer participation |
| Combined Weekly Flow | +$867.4M | Major reversal from the previous period | Follow-through beyond one week |
| BTC Positive Sessions | 5 Of 5 | Persistent rather than one-day demand | Streak survives a weaker market session |
| ETH Positive Sessions | 4 Of 5 | Constructive but less consistent | Multiple consecutive inflow days |
| IBIT Share Of BTC Flow | 68.8% | BlackRock remained dominant | More balanced contribution from competitors |
| ETHA Share Of ETH Flow | 109.8% | Competitor redemptions offset part of ETHA demand | Positive flows into FETH, ETHW and ETHB |
| GBTC Versus Grayscale BTC | -$83.7M Versus +$85.8M | Possible migration into the cheaper wrapper | Similar pattern across future periods |
| ETHB Weekly Flow | $0.0M | Staking product did not attract net new capital | Sustained creations rather than secondary trading only |
| BTC Price Return | +2.70% | Flow and price moved together | Continued demand above the recent range |
| ETH Price Return | +4.47% | Stronger marginal response than Bitcoin | Price holds if ETF flow slows |
| BlackRock Combined Share | 76.3% | Market remains concentrated by issuer | Broader industry-wide creations |
| IBIT Median Spread | 0.03% | Bitcoin retains the execution advantage | ETH product spreads continue tightening |
| July 23 Flow Data | Not Available At Cutoff | Monitoring period ends with five completed sessions | Final session data when published |
Strong Flows, But Durability Requires Breadth
Institutional crypto ETF demand broadened this week.
Bitcoin funds attracted $710.5 million and recorded positive flows on all five completed sessions. Ether funds added $156.9 million, with the strongest day arriving at the end of the period.
The combined market reversed from a $77.8 million outflow in the previous monitor to an $867.4 million inflow. That $945.2 million swing was driven mainly by Bitcoin, but Ether delivered the stronger underlying price performance.
The quality of demand improved on the BTC side. Fidelity returned to inflows. ARKB, BITB, Morgan Stanley and VanEck also gained capital. GBTC remained the only material source of redemptions, and those losses were almost exactly offset by inflows into Grayscale’s lower-fee Mini Trust.
Ether remained more concentrated. ETHA attracted $172.3 million, exceeding the complex’s net total. Fidelity finished almost flat, Grayscale lost capital and BlackRock’s staked ETHB product recorded no net creations despite offering staking rewards.
The market is therefore sending two distinct signals.
Bitcoin has the deeper and broader allocation channel. Ether has the stronger marginal price response and comparable flow intensity relative to its smaller cumulative base.
The next step is breadth.
Bitcoin needs the current multi-issuer participation to persist. Ether needs demand to spread beyond ETHA. ETHB needs to prove that staking yield can attract primary-market capital rather than only support an existing asset base.
This was a strong institutional allocation week. It becomes a durable trend only if the next set of flows is less dependent on one issuer and one product.
Data Sources & References
- Farside Investors — Bitcoin ETF Flows
- Farside Investors — Ethereum ETF Flows
- Coin Metrics — CMBI Bitcoin Benchmark
- Coin Metrics — CMBI Ethereum Benchmark
- BlackRock — iShares Bitcoin Trust ETF
- BlackRock — iShares Ethereum Trust ETF
- BlackRock — iShares Staked Ethereum Trust ETF
- Fidelity — Crypto Funds