


Content
The stablecoin market finished the week almost exactly where it started. The liquidity underneath it moved aggressively.
DefiLlama recorded total stablecoin market capitalization of $309.85 billion, down just $130.5 million, or 0.04%, over seven days. USDT contracted by 0.08%, while USDC expanded by 0.10%. Together, the two market leaders still controlled 83.06% of outstanding value.
The network distribution told a different story.
Solana added approximately $1.16 billion of stablecoins, lifting its total by 7.67% to $16.32 billion. Ethereum lost an estimated $822 million. Polygon, Arbitrum and Avalanche each contracted by more than $160 million.
Deployment weakened at the same time. Stableflows tracked $9.11 billion of USDC, USDT, USDT0 and PYUSD inside selected DeFi protocols, down from $10.37 billion in the previous BitBullNews snapshot. The tracked supply base barely changed, but utilization fell from 4.1% to 3.6%.
Stablecoins did not leave the market in size. They changed networks, products and use cases — and a meaningful share moved away from the DeFi positions captured by the available data.
Stablecoin Market Scorecard
| Metric | Current Reading | Seven-Day Change | Market Read |
|---|---|---|---|
| Total Stablecoin Market Cap | $309.85B | -$130.5M, -0.04% | Aggregate supply was effectively flat |
| USDT Market Cap | $183.90B | -0.08% | Core offshore liquidity remained stable |
| USDC Market Cap | $73.46B | +0.10% | Small net expansion |
| USDT And USDC Combined Share | 83.06% | Broadly Unchanged | Market concentration remains extreme |
| Ethereum Stablecoin Supply | $148.69B | -0.55% | Largest absolute network decline |
| Solana Stablecoin Supply | $16.32B | +7.67% | Largest major-network expansion |
| Tracked Stablecoin Supply | $255.58B | Approximately Flat Versus July 20 | The DeFi measurement base remained stable |
| Stablecoins In Tracked DeFi | $9.11B | -12.2% Versus July 20 | Deployment fell much faster than supply |
| DeFi Utilization Rate | 3.6% | Down From 4.1% | More liquidity remained outside tracked DeFi |
| Stablecoins As Share Of DeFi TVL | 7.1% | Down From 8.4% | Stablecoin capital became less prominent in total DeFi TVL |
Data Note: DefiLlama’s market overview reports $309.85 billion, while its chain-level dashboard reports $307.79 billion. The difference reflects variations in asset classification and chain coverage. Issuer-level and chain-level totals should not be mechanically reconciled.
Large Stablecoin Moves Cancelled Each Other Out
The market’s $130.5 million headline decline concealed several larger movements in opposite directions.
PYUSD produced the largest contraction among major fiat-backed stablecoins, losing an estimated $215 million. USDT fell by roughly $147 million, while USD1 contracted by about $130 million.
USDGO moved the other way, adding approximately $107 million. USDG gained $81 million, USDC expanded by $73 million and RLUSD added roughly $58 million.
Major Stablecoin Supply Changes
| Stablecoin Or Tokenized Cash Product | Current Value | Seven-Day Change | Estimated Dollar Change |
|---|---|---|---|
| PYUSD | $2.67B | -7.47% | -$215M |
| USDT | $183.90B | -0.08% | -$147M |
| USD1 | $4.14B | -3.05% | -$130M |
| USDe | $3.97B | -1.03% | -$41M |
| USDS | $6.65B | -0.29% | -$19M |
| USDY | $2.15B | -0.49% | -$11M |
| BUIDL | $2.64B | +0.16% | +$4M |
| DAI | $4.86B | +0.26% | +$13M |
| United Stables U | $1.07B | +1.85% | +$19M |
| USYC | $3.01B | +1.53% | +$45M |
| RLUSD | $1.59B | +3.79% | +$58M |
| USDC | $73.46B | +0.10% | +$73M |
| USDG | $3.24B | +2.58% | +$81M |
| USDGO | $1.11B | +10.68% | +$107M |
Estimated dollar changes are calculated from current values and DefiLlama’s displayed seven-day percentage changes. Figures are rounded. Changes in yield-bearing products such as USYC and USDY may include movements in net asset value rather than token issuance alone.
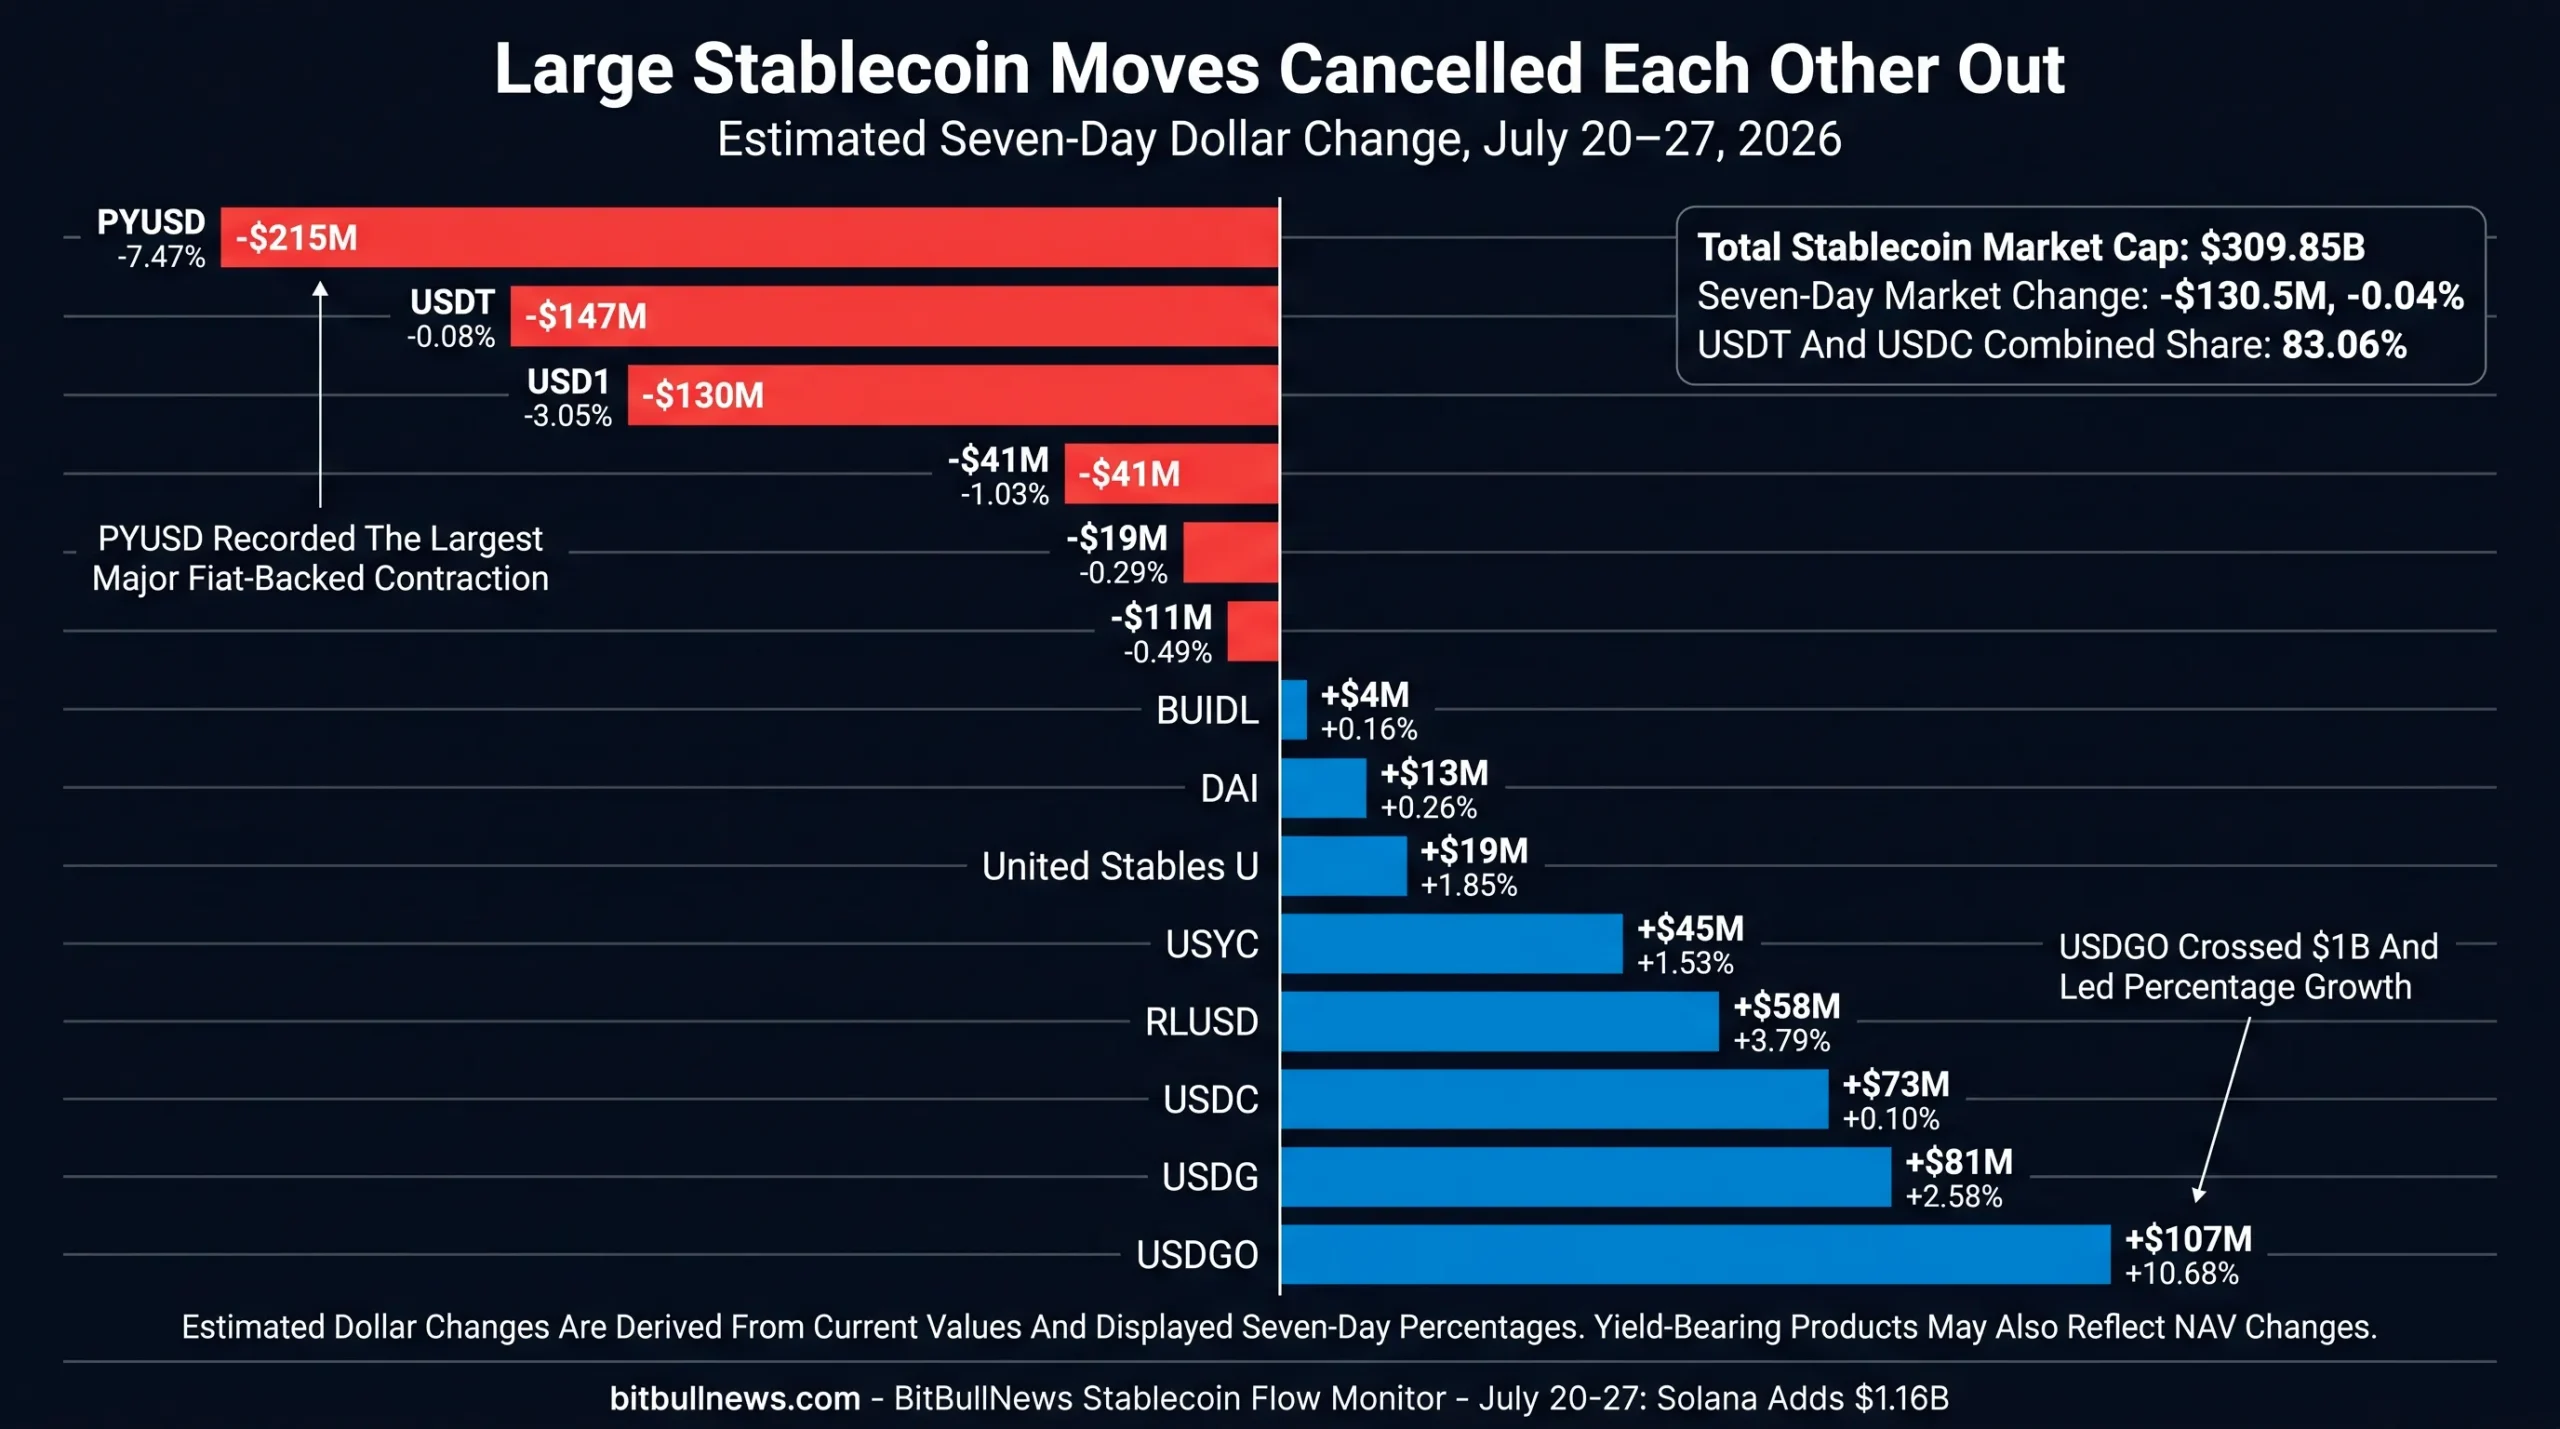
The distribution points to rotation rather than a broad withdrawal from digital dollars.
USDT and USDC together experienced an estimated net decline of only $74 million against a combined market value above $257 billion. Most of the movement occurred among smaller products or through changes in where tokens were issued and held.
USDT And USDC Remained Stable At The Top
USDT ended the period at approximately $183.90 billion, retaining 59.35% market dominance. USDC stood at $73.46 billion. Their combined share remained above 83%, leaving the market heavily dependent on two issuers.
The aggregate figures were quiet. Their network distributions were not.
USDT increased by 14.43% on Solana and 11.29% on Aptos. It declined by 0.77% on Ethereum, 3.61% on Arbitrum and 5.43% on Polygon. Tron remained the largest USDT network at approximately $89.73 billion.
USDC also expanded on Solana, rising 7.35% to $7.61 billion. Hyperliquid’s USDC balance increased 1.01% to $6.17 billion, while Ethereum, Base, Arbitrum, Polygon and Avalanche recorded declines.
A flat issuer-level balance therefore does not mean liquidity conditions were stable everywhere. Lending rates, exchange depth, bridge demand and liquidation capacity depend on where the tokens are available.
Stablecoin Liquidity Relocated Between Networks
Ethereum still held almost half of the stablecoin market captured by DefiLlama’s chain dashboard. Its dominance stood at 48.31%, but its lead narrowed as Solana absorbed the week’s largest inflow.
Stablecoin Supply By Network
| Network | Current Stablecoin Supply | Seven-Day Change | Estimated Dollar Change | Dominant Stablecoin |
|---|---|---|---|---|
| Ethereum | $148.69B | -0.55% | -$822M | USDT |
| Tron | $90.48B | +0.12% | +$108M | USDT |
| Solana | $16.32B | +7.67% | +$1.16B | USDC |
| BNB Chain | $13.43B | -0.70% | -$95M | USDT |
| Hyperliquid | $6.32B | +0.67% | +$42M | USDC |
| Base | $4.85B | -0.70% | -$34M | USDC |
| Arbitrum | $3.39B | -4.59% | -$163M | USDC |
| Polygon | $3.16B | -5.50% | -$184M | USDC |
| X Layer | $1.98B | +2.19% | +$42M | USDG |
| Avalanche | $1.43B | -10.22% | -$163M | BUIDL |
| Aptos | $1.23B | +6.98% | +$81M | USDT |
| XRP Ledger | $999.0M | +1.91% | +$19M | RLUSD |
Estimated dollar changes are derived from current supply and seven-day percentage movements. DefiLlama’s chain dashboard reports $307.79 billion in aggregate stablecoin value, compared with $309.85 billion on its broader market page.
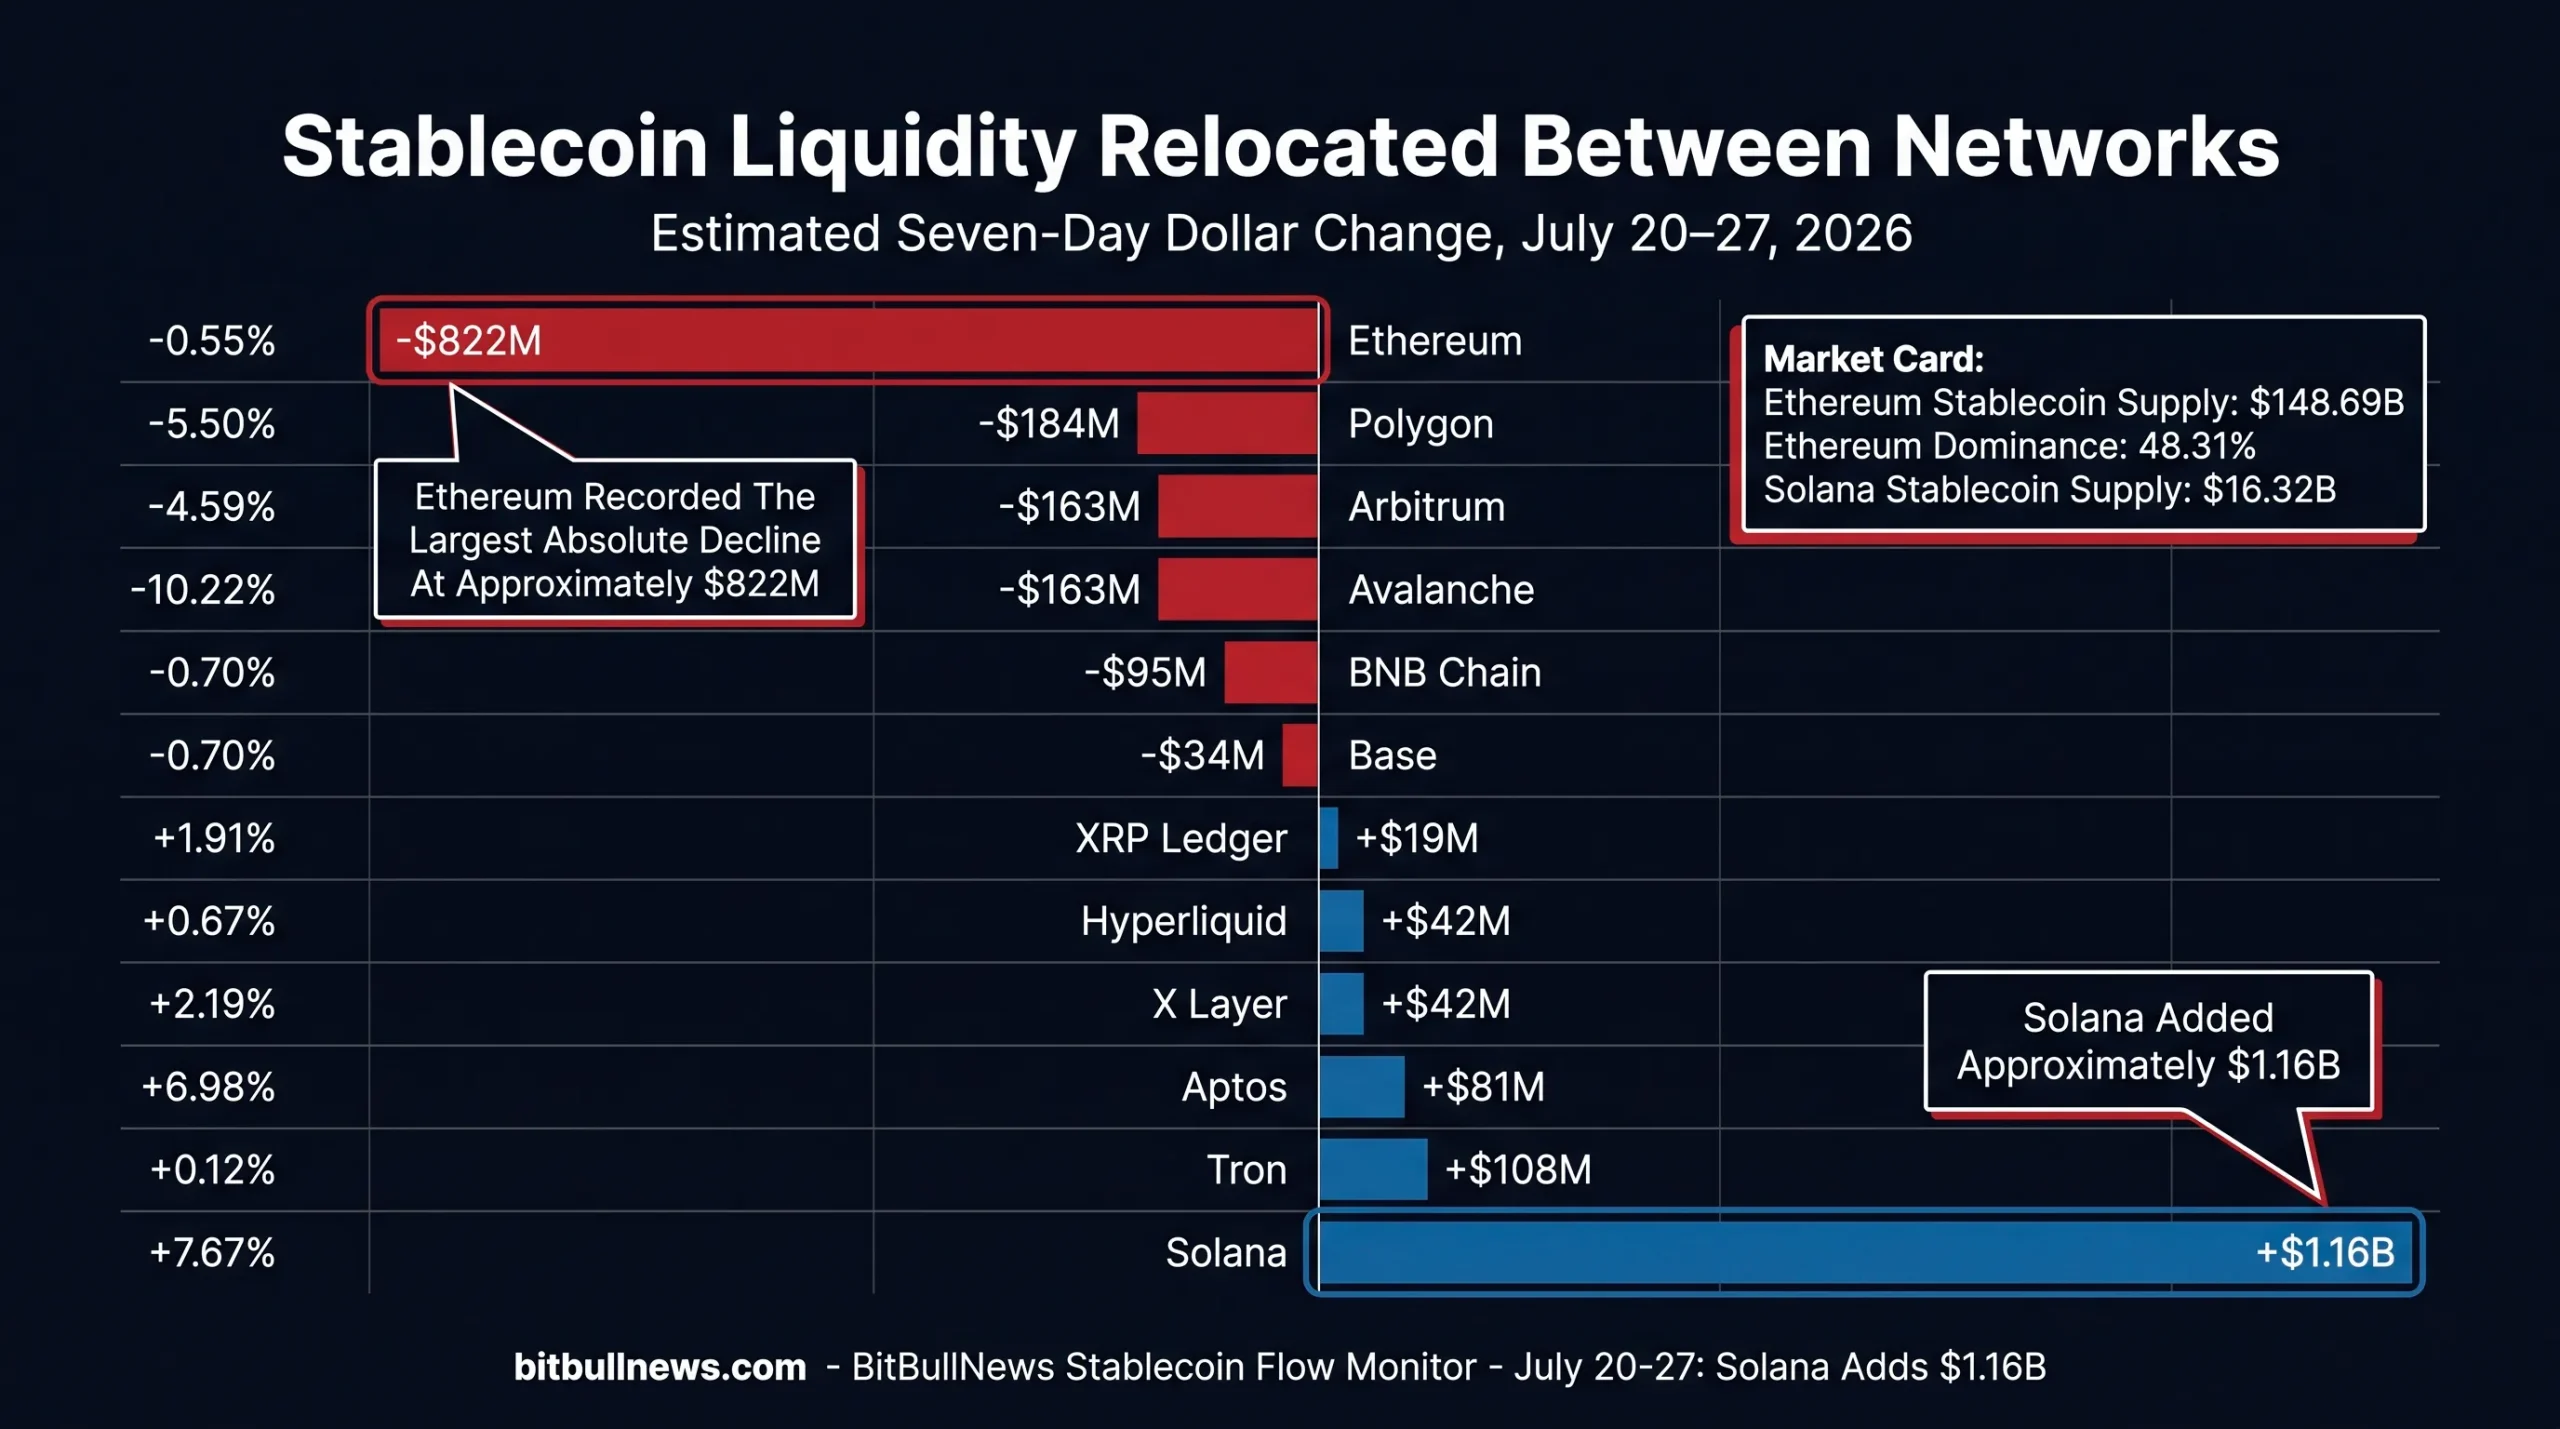
The table shows that the week was not a broad risk-off event. Tron, Solana, Hyperliquid, X Layer, Aptos and XRP Ledger all expanded. The losses were concentrated on Ethereum and several smart-contract networks that had previously accumulated substantial USDC, PYUSD or BUIDL balances.
Solana Attracted A Broad Liquidity Wave
Solana’s stablecoin supply increased from roughly $15.16 billion to $16.32 billion, adding approximately $1.16 billion in seven days.
The inflow was not dependent on a single issuer.
USDC contributed around $521 million. USDT added approximately $420 million. USDGO and BUIDL each supplied another $106–107 million. USDG accounted for the remaining $8 million among the five largest contributors.
Solana Stablecoin Inflow Composition
| Solana Asset | Current Supply | Seven-Day Change | Estimated Dollar Increase | Share Of Solana’s Net Gain |
|---|---|---|---|---|
| USDC | $7.61B | +7.35% | +$521M | 44.8% |
| USDT | $3.33B | +14.43% | +$420M | 36.1% |
| USDGO | $1.11B | +10.69% | +$107M | 9.2% |
| BUIDL | $653.84M | +19.45% | +$106M | 9.2% |
| USDG | $619.84M | +1.33% | +$8M | 0.7% |
| Major Contributors | — | — | Approximately +$1.16B | Approximately 100% |
The five listed products explain almost the entire increase reported on DefiLlama’s Solana stablecoin dashboard.
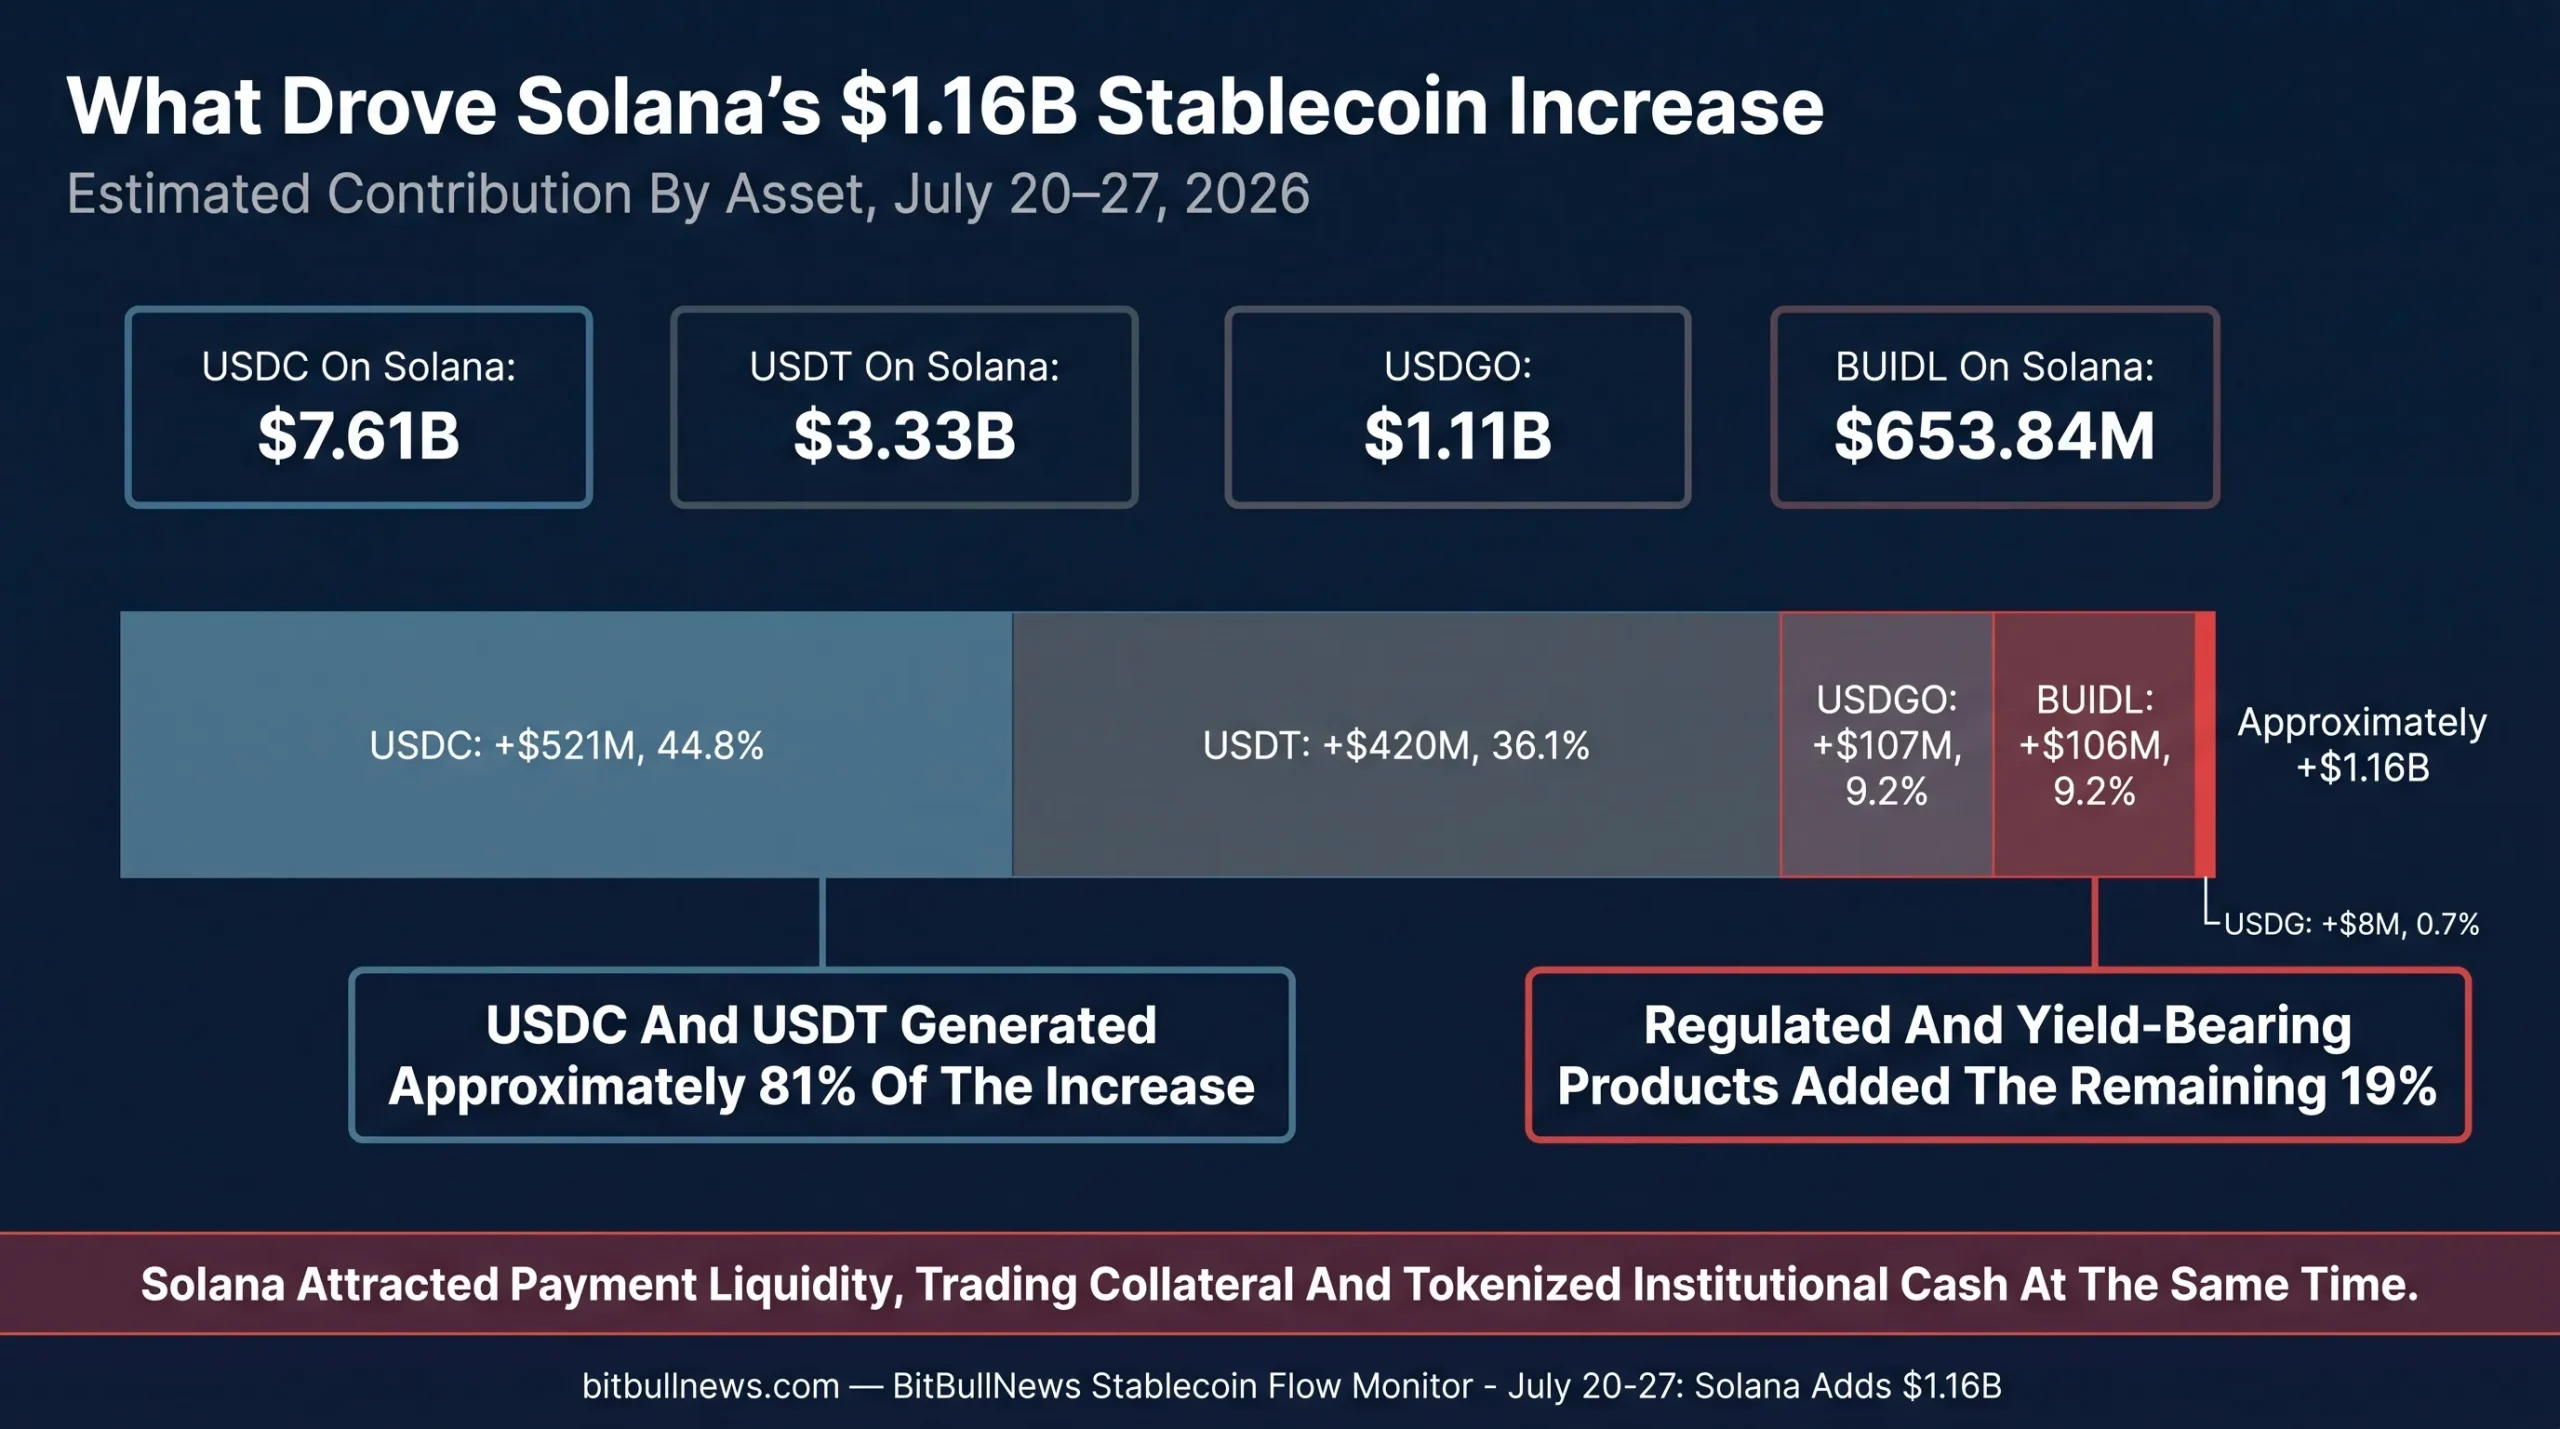
USDC and USDT generated approximately 81% of Solana’s increase. The remaining 19% came from regulated enterprise liquidity and a tokenized institutional fund.
That mix is stronger than an inflow driven entirely by one temporary issuance. Solana simultaneously gained:
- General-purpose trading and payment liquidity through USDT.
- Regulated fiat-backed liquidity through USDC and USDGO.
- Yield-bearing institutional cash through BUIDL.
- Additional multichain liquidity through USDG.
The main limitation is utilization. Solana’s tracked stablecoin supply expanded much faster than the value entering the DeFi applications measured by Stableflows.
USDGO Crossed $1 Billion
USDGO delivered the strongest percentage growth among billion-dollar stablecoins, rising 10.68% to approximately $1.11 billion. Its entire tracked supply was located on Solana.
OSL announced on July 20 that USDGO had crossed $1 billion in circulating supply. The company described it as an enterprise-focused stablecoin intended for institutional payments, treasury operations and cross-border settlement. USDGO is issued by Anchorage Digital Bank and distributed by OSL.
The growth curve has been steep:
- Approximately $50 million at launch in February.
- More than $100 million by April.
- Above $1 billion by July 20.
- Approximately $1.11 billion at the latest DefiLlama snapshot.
That issuance history is measurable. Actual enterprise payment adoption is harder to assess.
OSL has not published transaction-level data sufficient to distinguish operating payments from treasury inventory, liquidity reserves or positions held by a limited number of institutions. Supply proves that capital entered the product. It does not prove that the same value circulated through commercial settlement.
USDG And USDGO Are Different Products
The similar tickers conceal different legal and distribution structures.
USDG, or Global Dollar, is issued by Paxos Digital Singapore and regulated under the Monetary Authority of Singapore framework. Its market value reached approximately $3.24 billion, with the largest balance on X Layer, followed by Solana and Ethereum.
USDGO is issued by Anchorage Digital Bank and distributed by OSL. Its entire $1.11 billion supply was concentrated on Solana.
USDG added an estimated $81 million during the week. USDGO gained approximately $107 million.
The distinction matters for network risk. USDG has multichain distribution. USDGO currently depends on a single settlement network, which simplifies supply reconciliation but concentrates operational exposure.
RLUSD Expanded On Both Native Networks
RLUSD increased 3.79% to approximately $1.59 billion, adding an estimated $58 million.
XRP Ledger supply rose 1.34% to $894.6 million. Ethereum supply increased 7.12% to $694.8 million. The faster percentage expansion occurred on Ethereum, while XRP Ledger retained the larger absolute balance.
Ripple introduced Ripple Mint on July 23, giving institutions a unified interface to access, mint, redeem and manage RLUSD. Ripple also invested in Notabene, whose Flow platform is expected to integrate RLUSD for coordinated B2B stablecoin payments.
The timing aligns with RLUSD’s weekly expansion, but the public data does not establish causation. The new infrastructure may support future issuance and usage. It does not identify who minted the additional $58 million or how the tokens were deployed.
PYUSD Reversed Direction
PYUSD recorded the largest major fiat-backed contraction, falling 7.47% to approximately $2.67 billion.
The decline came almost entirely from Ethereum and Arbitrum. Solana’s PYUSD balance was effectively flat.
PYUSD Supply By Network
| PYUSD Network | Current Supply | Seven-Day Change | Estimated Dollar Change |
|---|---|---|---|
| Ethereum | $1.73B | -8.98% | Approximately -$171M |
| Solana | $682.32M | +0.36% | Approximately +$2M |
| Arbitrum | $169.88M | -21.27% | Approximately -$46M |
| Flow | $69.73M | -0.90% | Below -$1M |
| Polygon | $10.15M | +0.10% | Approximately Flat |
| Sei | $3.14M | +2.65% | Below +$1M |
Ethereum and Arbitrum explain nearly all of PYUSD’s estimated $215 million market-wide contraction.
The move reversed the previous BitBullNews monitoring period, when PYUSD had expanded modestly.
No public issuer disclosure identified the reason. The supply data can establish redemptions or reduced outstanding value, but not whether the change reflected treasury management, incentive expiry, exchange movements or a shift into another PayPal-linked account structure.
Ethereum remains the key market. It still holds almost two-thirds of PYUSD’s outstanding supply.
Ethereum Lost Liquidity Across Several Products
Ethereum’s total stablecoin supply declined by 0.55% to approximately $148.69 billion, a reduction of roughly $822 million.
The decline was broad:
- USDT fell 0.77%, removing roughly $590 million.
- USDC declined 0.26%, equivalent to approximately $122 million.
- PYUSD lost about $171 million.
- USDe contracted by close to $100 million.
- USD1 declined by around $30 million.
The figures overlap with positive offsets from assets such as RLUSD and USDG, which expanded on Ethereum.
This was not one fund moving between networks. Several of Ethereum’s largest dollar assets contracted simultaneously.
Ethereum still held 48.31% of chain-level stablecoin supply. Its liquidity base remains larger than Tron, Solana, BNB Chain and Hyperliquid combined. The week nevertheless showed that dominance can decline even when the overall stablecoin market remains flat.
Layer-2 Liquidity Contracted
Arbitrum lost approximately $163 million, while Polygon contracted by roughly $184 million. Base declined by a smaller $34 million.
Arbitrum’s weakness was concentrated in USDC, PYUSD and USDT:
- USDC fell 3.82%.
- PYUSD declined 21.27%.
- USDT contracted 3.61%.
Polygon’s contraction was led by USDC and USDT, which declined 6.60% and 5.43%, respectively.
Base provides an important counterexample. Its outstanding stablecoin supply fell slightly, but the amount placed in the protocols captured by Stableflows increased.
Supply and deployment can therefore move in opposite directions.
Avalanche’s Decline Was Mostly BUIDL And USDC
Avalanche stablecoin supply fell 10.22% to approximately $1.43 billion, removing an estimated $163 million.
BUIDL declined 13.84% on Avalanche to $634.2 million. USDC fell 12.25% to $415.3 million. Together, the two products explain almost the entire network-level contraction.
BUIDL’s total market value remained nearly flat because its Solana balance increased by approximately $106 million while Avalanche lost about $102 million.
This is the clearest example of the week’s core theme. The product barely changed in aggregate, but its network footprint shifted substantially.
DeFi Deployment Fell While Supply Held Steady
Stableflows tracked $255.58 billion of USDC, USDT, USDT0 and PYUSD across its supported networks. Only $9.11 billion was placed in the selected DeFi protocols covered by the dashboard.
Compared with the July 20 BitBullNews snapshot, the tracked supply base was almost unchanged. DeFi deployment fell by $1.26 billion.
DeFi Stablecoin Deployment
| DeFi Deployment Metric | July 20 Snapshot | July 27 Snapshot | Change |
|---|---|---|---|
| Tracked Stablecoin Supply | $255.64B | $255.58B | Approximately Flat |
| Stablecoins In Tracked DeFi | $10.37B | $9.11B | -$1.26B, -12.2% |
| Utilization Rate | 4.1% | 3.6% | -0.5 Percentage Points |
| Stablecoins As Share Of DeFi TVL | 8.4% | 7.1% | -1.3 Percentage Points |
Stableflows covers USDC, USDT, USDT0 and PYUSD inside selected protocols. It does not measure every stablecoin, centralized exchange balance, payments account, treasury wallet or DeFi application.
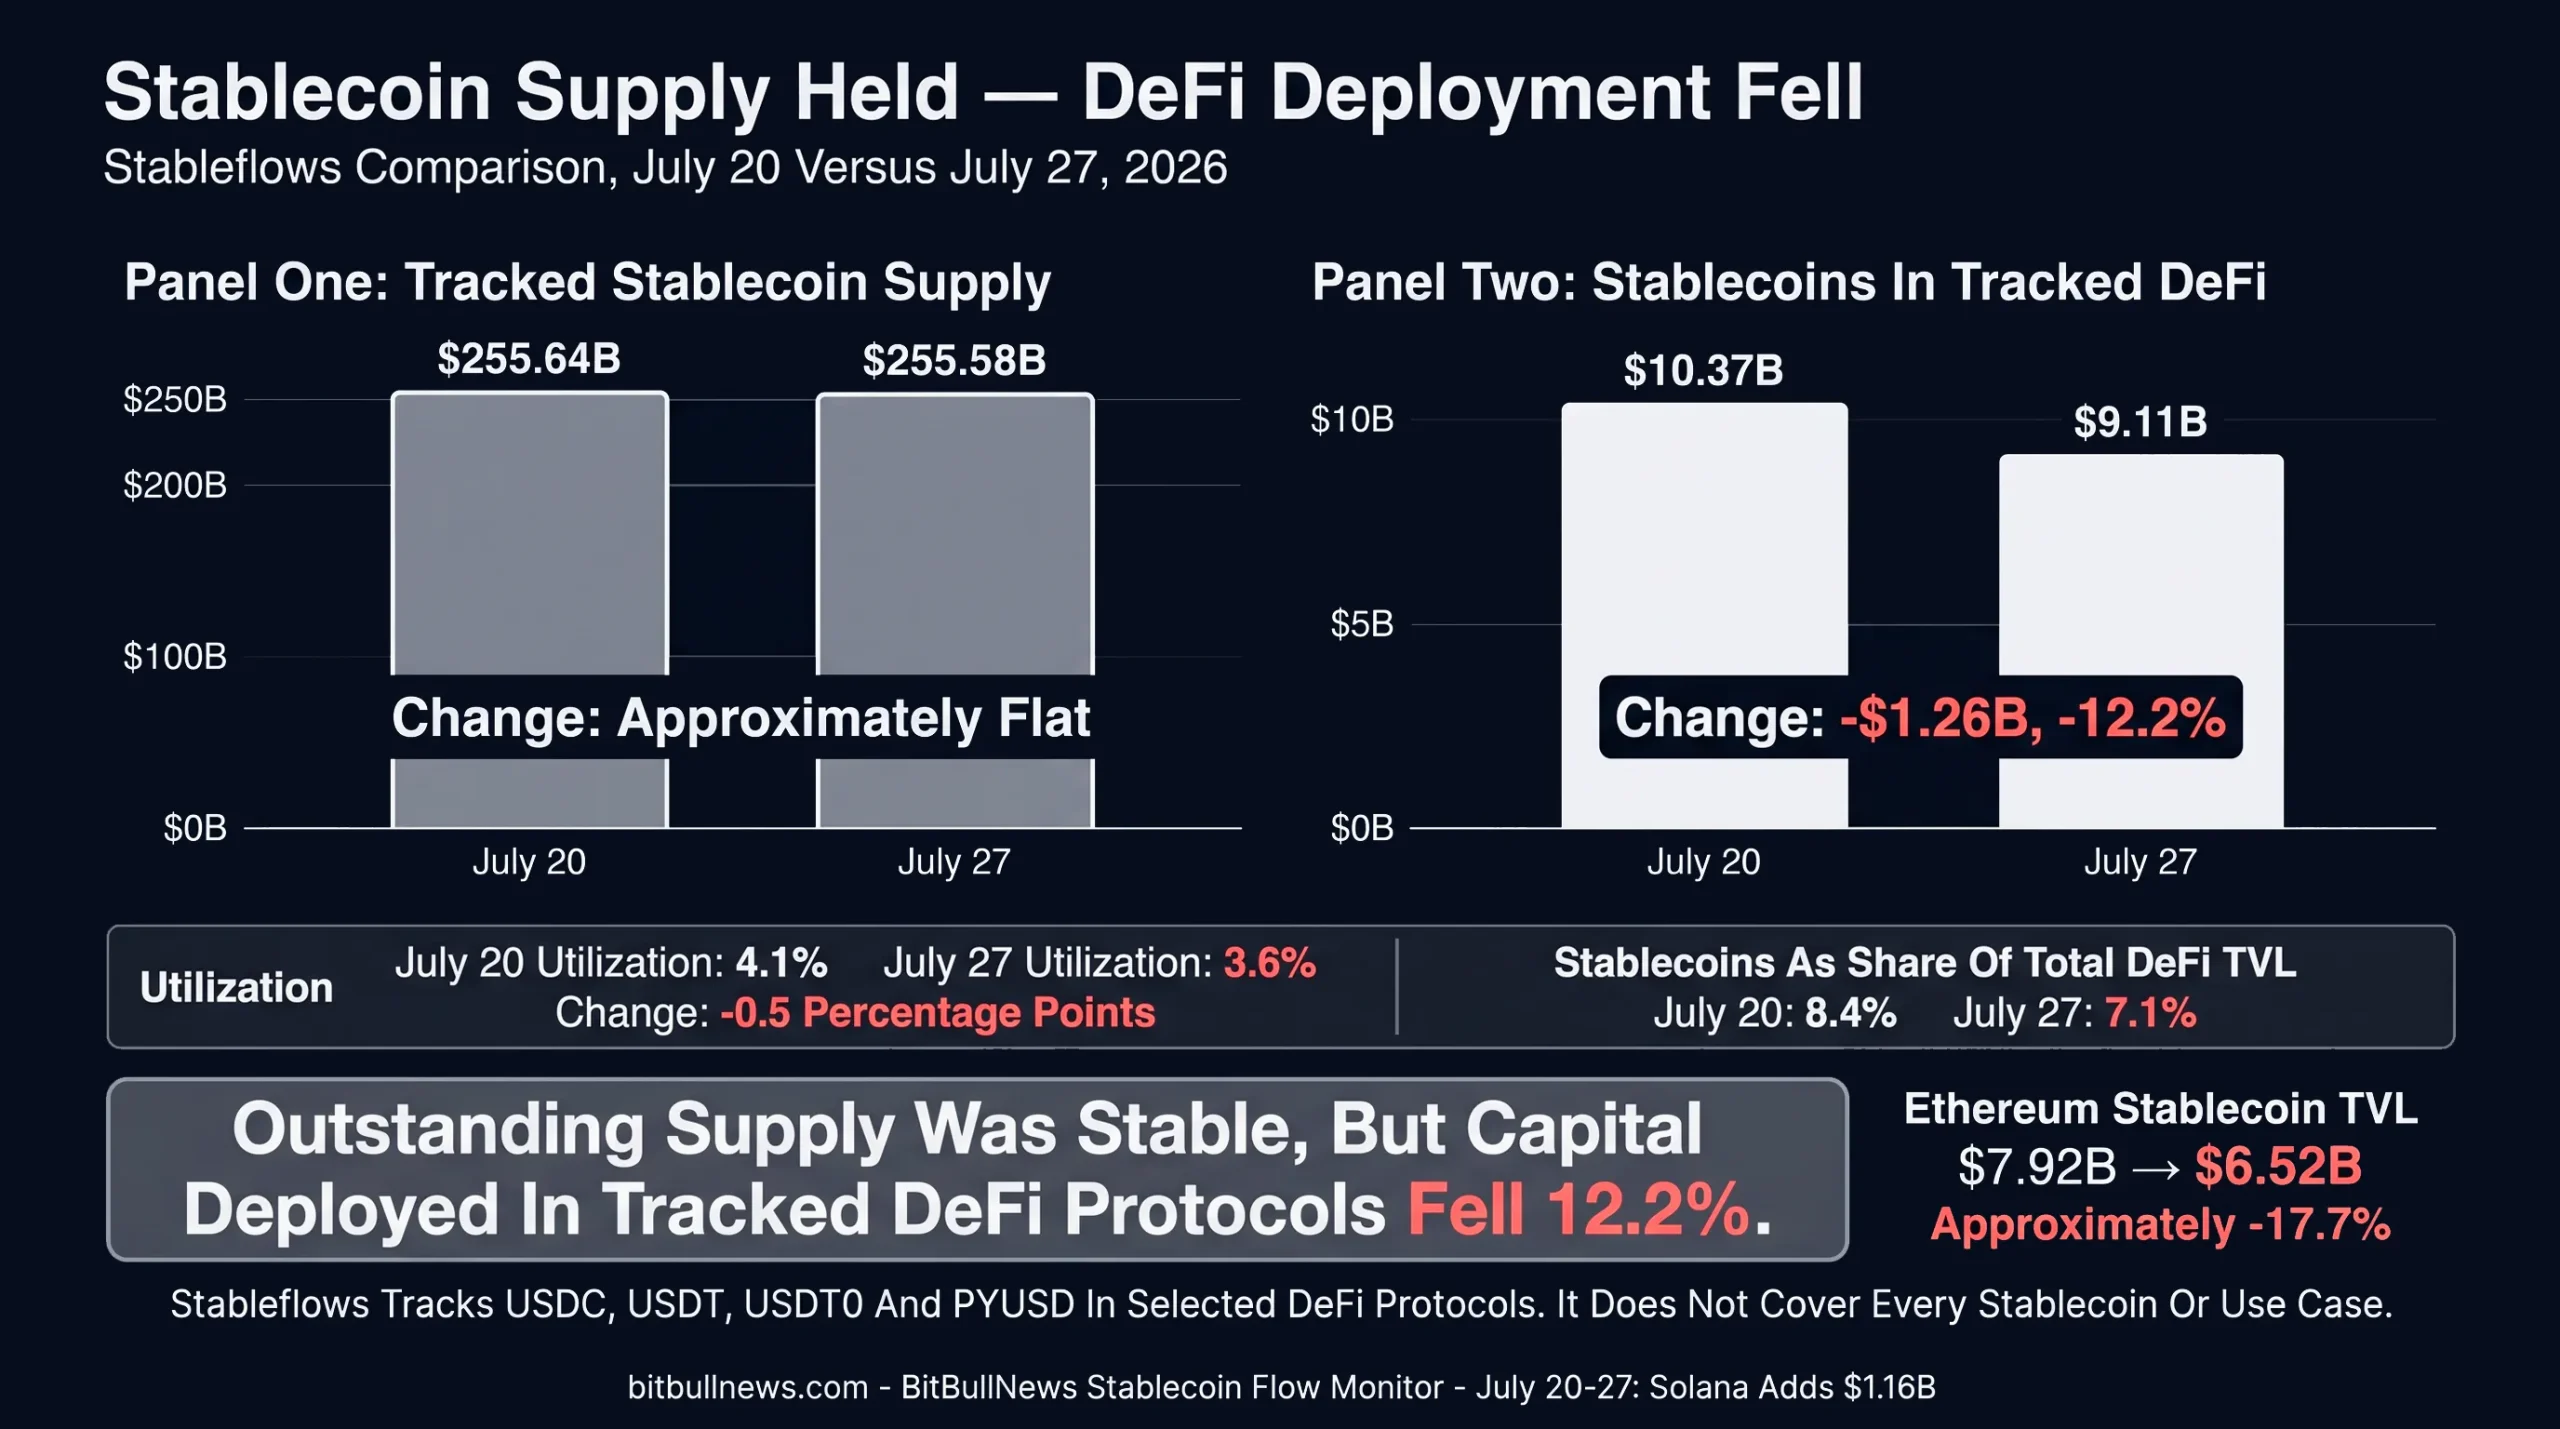
Ethereum accounted for most of the measured decline. Stablecoin TVL in the covered Ethereum protocols fell from $7.92 billion to $6.52 billion, a reduction of approximately 17.7%. Its tracked stablecoin supply declined by less than 1%.
That divergence means capital remained available onchain but was no longer sitting in the same lending markets, liquidity pools or other monitored positions.
The destination cannot be established from the dashboard. Possible locations include centralized exchanges, treasury wallets, payment accounts, custody platforms or protocols outside Stableflows’ coverage.
Solana Supply Grew Faster Than Its DeFi Deployment
Solana’s tracked DeFi stablecoin value increased from approximately $931 million to $965 million, a gain of only $34 million.
Its tracked four-token supply increased from $10.66 billion to $11.62 billion. Utilization consequently declined from 8.7% to 8.3%.
The broader DefiLlama dashboard recorded a larger network increase because it includes assets such as USDGO, BUIDL and USDG that fall outside Stableflows’ USDC, USDT, USDT0 and PYUSD scope.
That is the main constraint on the bullish Solana reading.
The network attracted substantial liquidity, but only a small part of the weekly addition appeared inside the selected DeFi protocols. Some of the capital may be intended for payments, exchange settlement, institutional custody or treasury management rather than lending.
Base And Sui Increased Their Deployment Rates
Not every network followed the broader DeFi contraction.
DeFi Utilization By Network
| Network | Stablecoins In DeFi | Tracked Stablecoin Supply | Utilization Rate | Previous Utilization |
|---|---|---|---|---|
| Ethereum | $6.52B | $124.02B | 5.3% | 6.3% |
| Solana | $965.28M | $11.62B | 8.3% | 8.7% |
| Base | $339.91M | $4.20B | 8.1% | 6.7% |
| Arbitrum | $314.71M | $3.17B | 9.9% | 9.2% |
| Avalanche | $301.33M | $749.64M | 40.2% | 39.4% |
| BNB Chain | $185.00M | $10.76B | 1.7% | 1.8% |
| Plasma | $128.34M | $733.27M | 17.5% | 15.1% |
| Sui | $105.65M | $281.65M | 37.5% | 20.1% |
| Hyperliquid | $99.35M | $6.29B | 1.6% | 1.6% |
| Polygon | $60.06M | $2.56B | 2.3% | 2.3% |
| Stellar | $45.14M | $339.25M | 13.3% | 16.1% |
| Tron | $32.44M | $89.67B | Below 0.1% | Below 0.1% |
| Aptos | $13.73M | $1.20B | 1.1% | Not Previously Listed |
Current figures are from Stableflows’ July 27 snapshot. Previous utilization rates come from the July 20 BitBullNews monitoring snapshot using the same dashboard scope.
Base increased its tracked stablecoin TVL from $282.3 million to $339.9 million, while tracked supply declined slightly. Its utilization rate rose from 6.7% to 8.1%.
Sui nearly doubled its measured stablecoin TVL from $54.8 million to $105.7 million. Utilization increased from 20.1% to 37.5%.
Avalanche retained the highest utilization rate among the larger networks in the table at 40.2%, even as its overall stablecoin supply contracted sharply.
High utilization is not automatically positive. It means more capital is working, but it also means a larger share is exposed to smart contracts, liquidation systems and protocol counterparties.
Peg Stability Was Not The Main Risk
USDT, USDC, PYUSD, USDG, USDGO, RLUSD, USDS and DAI all traded at or very close to $1 in DefiLlama’s latest snapshot. No major payment stablecoin suffered a persistent market-wide depeg during the reporting period.
USYC and USDY traded above $1 because they are yield-bearing products with appreciating net asset values. Their prices should not be interpreted using the same framework as fixed-price payment stablecoins.
BUIDL also differs from USDT or USDC. It represents a regulated fund backed by cash, Treasury bills and repurchase agreements, with accrued income distributed to eligible investors.
The week’s risks came from distribution and deployment:
- Liquidity became more concentrated on Solana.
- Ethereum and major layer-2 networks lost supply.
- PYUSD experienced a significant product-level contraction.
- Stablecoin capital inside tracked DeFi protocols fell sharply.
- Newer regulated tokens expanded faster than their publicly measurable usage.
A stable $1 price confirms that the market is clearing near par. It does not prove deep liquidity, broad adoption or immediate redemption capacity during stress.
What Treasury Managers Should Watch Next
Whether Solana’s Inflow Becomes Active Liquidity
Solana added $1.16 billion of stablecoins, but its tracked DeFi deployment increased by only about $34 million.
A rise in utilization would show that the new supply is feeding lending, liquidity and trading activity. Continued supply growth with falling utilization would indicate that more capital is being held outside those applications.
Whether PYUSD Stabilizes
Ethereum and Arbitrum accounted for almost the entire PYUSD contraction.
Another large decline would point to a persistent reduction in the product’s core liquidity base. Stabilization would support the view that the move was a discrete redemption or treasury adjustment.
Whether USDGO Produces Usage Data
Crossing $1 billion is a major issuance milestone.
The next requirement is evidence of activity: payment volume, transaction frequency, the number of active institutional counterparties and redemption behavior. Supply held in treasury or liquidity wallets should not be treated as equivalent to commercial settlement.
Whether Ripple Mint Supports Sustained RLUSD Growth
RLUSD expanded on both Ethereum and XRP Ledger as Ripple launched new institutional minting and management infrastructure.
Continued supply growth would strengthen the relationship between product access and adoption. Transaction data will still be required to separate payment use from passive liquidity inventory.
Whether Ethereum DeFi Capital Returns
Ethereum lost approximately $1.40 billion from the DeFi positions tracked by Stableflows while its underlying four-token supply changed much less.
A recovery would indicate temporary repositioning. Continued contraction would suggest stablecoin holders are reducing DeFi exposure while retaining the assets elsewhere.
Whether Layer-2 Outflows Persist
Arbitrum and Polygon lost a combined estimated $347 million in outstanding stablecoins.
The next report should determine whether that was temporary treasury movement or part of a broader shift toward Solana and other settlement networks.
Stablecoin Risk Dashboard
| Signal | Current Reading | Interpretation | Confirmation Needed |
|---|---|---|---|
| Total Market Supply | $309.85B, -0.04% | Aggregate market was effectively flat | Return to sustained net issuance |
| USDT Supply | $183.90B, -0.08% | Core market liquidity remained stable | Growth without weaker reserve quality |
| USDC Supply | $73.46B, +0.10% | Small net expansion | Broader growth across major networks |
| USDT And USDC Share | 83.06% | Market remains highly concentrated | Durable growth among credible alternatives |
| Solana Supply | $16.32B, +7.67% | Largest major-network inflow | Higher usage and DeFi deployment |
| Ethereum Supply | $148.69B, -0.55% | Broad product-level contraction | Stablecoin and DeFi recovery |
| PYUSD Supply | $2.67B, -7.47% | Largest major fiat-backed decline | Stabilization on Ethereum and Arbitrum |
| USDGO Supply | $1.11B, +10.68% | Rapid institutional issuance growth | Published payment and settlement activity |
| RLUSD Supply | $1.59B, +3.79% | Growth across both native networks | Ripple Mint converts into sustained usage |
| BUIDL Total | $2.64B, +0.16% | Aggregate fund value was stable | Chain allocation stops shifting sharply |
| BUIDL On Solana | +19.45% | Institutional cash moved toward Solana | Stable longer-term allocation |
| BUIDL On Avalanche | -13.84% | Major source of Avalanche’s contraction | Recovery or orderly reallocation |
| DeFi Stablecoin TVL | $9.11B, -12.2% | Deployment fell despite stable supply | Return of lending and liquidity demand |
| DeFi Utilization | 3.6% | Most tracked stablecoins remain outside DeFi | Productive deployment without excessive leverage |
| Peg Stability | Major Payment Tokens Near $1 | No broad price-stability event | Continued primary-market redemption liquidity |
The Liquidity Paradox: Solana Surges, but Capital Sits Idle
The stablecoin market did not materially shrink this week. It relocated.
Total capitalization remained near $309.85 billion, down only 0.04%. USDT and USDC barely moved and retained more than 83% of the market.
Solana was the clear winner.
The network added an estimated $1.16 billion, led by approximately $521 million of USDC and $420 million of USDT. USDGO and BUIDL contributed another $107 million and $106 million. The inflow combined trading collateral, payment liquidity and tokenized institutional cash.
Ethereum lost approximately $822 million. Arbitrum, Polygon and Avalanche also contracted. PYUSD posted the largest product-level decline, while USDGO, USDG and RLUSD gained.
The cautious signal came from deployment.
Tracked stablecoin supply barely changed, but stablecoin value inside selected DeFi protocols fell by $1.26 billion. Utilization dropped from 4.1% to 3.6%. Solana’s supply surge had not yet produced a comparable increase in deployed capital.
That distinction will define the next report.
Issuance measures available liquidity. Network supply shows where it sits. DeFi utilization and transaction data show whether the capital is lending, trading, settling or simply waiting.
This week delivered a major Solana inflow and rapid expansion among newer regulated products. The next test is whether that liquidity begins doing financial work.
Data Sources & References
- DefiLlama Stablecoin Market Dashboard
- DefiLlama Stablecoins By Chain
- DefiLlama USDT Data
- DefiLlama USDC Data
- DefiLlama PYUSD Data
- DefiLlama USDG Data
- DefiLlama USDGO Data
- DefiLlama RLUSD Data
- DefiLlama BUIDL Data
- Stableflows DeFi Utilization Dashboard
- OSL — USDGO Surpasses $1 Billion
- Anchorage Digital — USDGO Reserve Attestations
- Ripple — Ripple Mint
- Notabene — Strategic Investment From Ripple
- Circle Transparency
- Tether Transparency