


Content
The stablecoin market contracted this week, but the headline decline was more concentrated than it first appeared.
DefiLlama recorded total stablecoin market capitalization of $310.04 billion, down $1.19 billion, or 0.38%, over seven days. USDT barely moved. USDC declined modestly. Most of the damage came from a handful of products, led by Sky Dollar and BlackRock’s BUIDL token.
Liquidity also changed location.
Ethereum, BNB Chain and Avalanche lost stablecoin supply, while Solana, Hyperliquid, Aptos and XRP Ledger gained. Solana’s increase was particularly notable because it came despite a decline in USDC. A sharp expansion in USDT more than compensated for the USDC outflow.
The market therefore did not experience a uniform flight from digital dollars. It experienced a rotation between issuers, product structures and settlement networks.
Usage data was less constructive. Artemis reported that average daily transfer volume, transaction count and active addresses all declined over the latest 30-day comparison period. Supply remains large, but less of it is moving.
Stablecoin Market Scorecard
| Metric | Current Reading | Change | Market Read |
|---|---|---|---|
| DefiLlama Stablecoin Market Cap | $310.04B | -$1.19B Over Seven Days | Moderate net supply contraction |
| Seven-Day Market Change | -0.38% | — | Decline was concentrated rather than market-wide |
| USDT Market Cap | $184.02B | -0.01% Over Seven Days | Supply was effectively unchanged |
| USDC Market Cap | $73.38B | -0.21% Over Seven Days | Small net contraction |
| USDT And USDC Combined Share | 83.02% | — | Market remains highly concentrated |
| Artemis Tracked Supply | $314.80B | -1.10% Over 30 Days | Broader supply trend remains negative |
| Average Daily Transfer Volume | $194.30B | -26.20% Versus Previous 30 Days | Capital circulated less aggressively |
| Average Daily Transactions | 63.20M | -11.30% Versus Previous 30 Days | Onchain payment and settlement activity weakened |
| Average Daily Active Addresses | 4.50M | -7.80% Versus Previous 30 Days | Participation declined less than volume |
Methodology Note: DefiLlama and Artemis use different token classifications, chain coverage and calculation methods. Their absolute supply totals should not be combined. DefiLlama is used for the seven-day supply analysis; Artemis is used for the broader 30-day activity comparison.
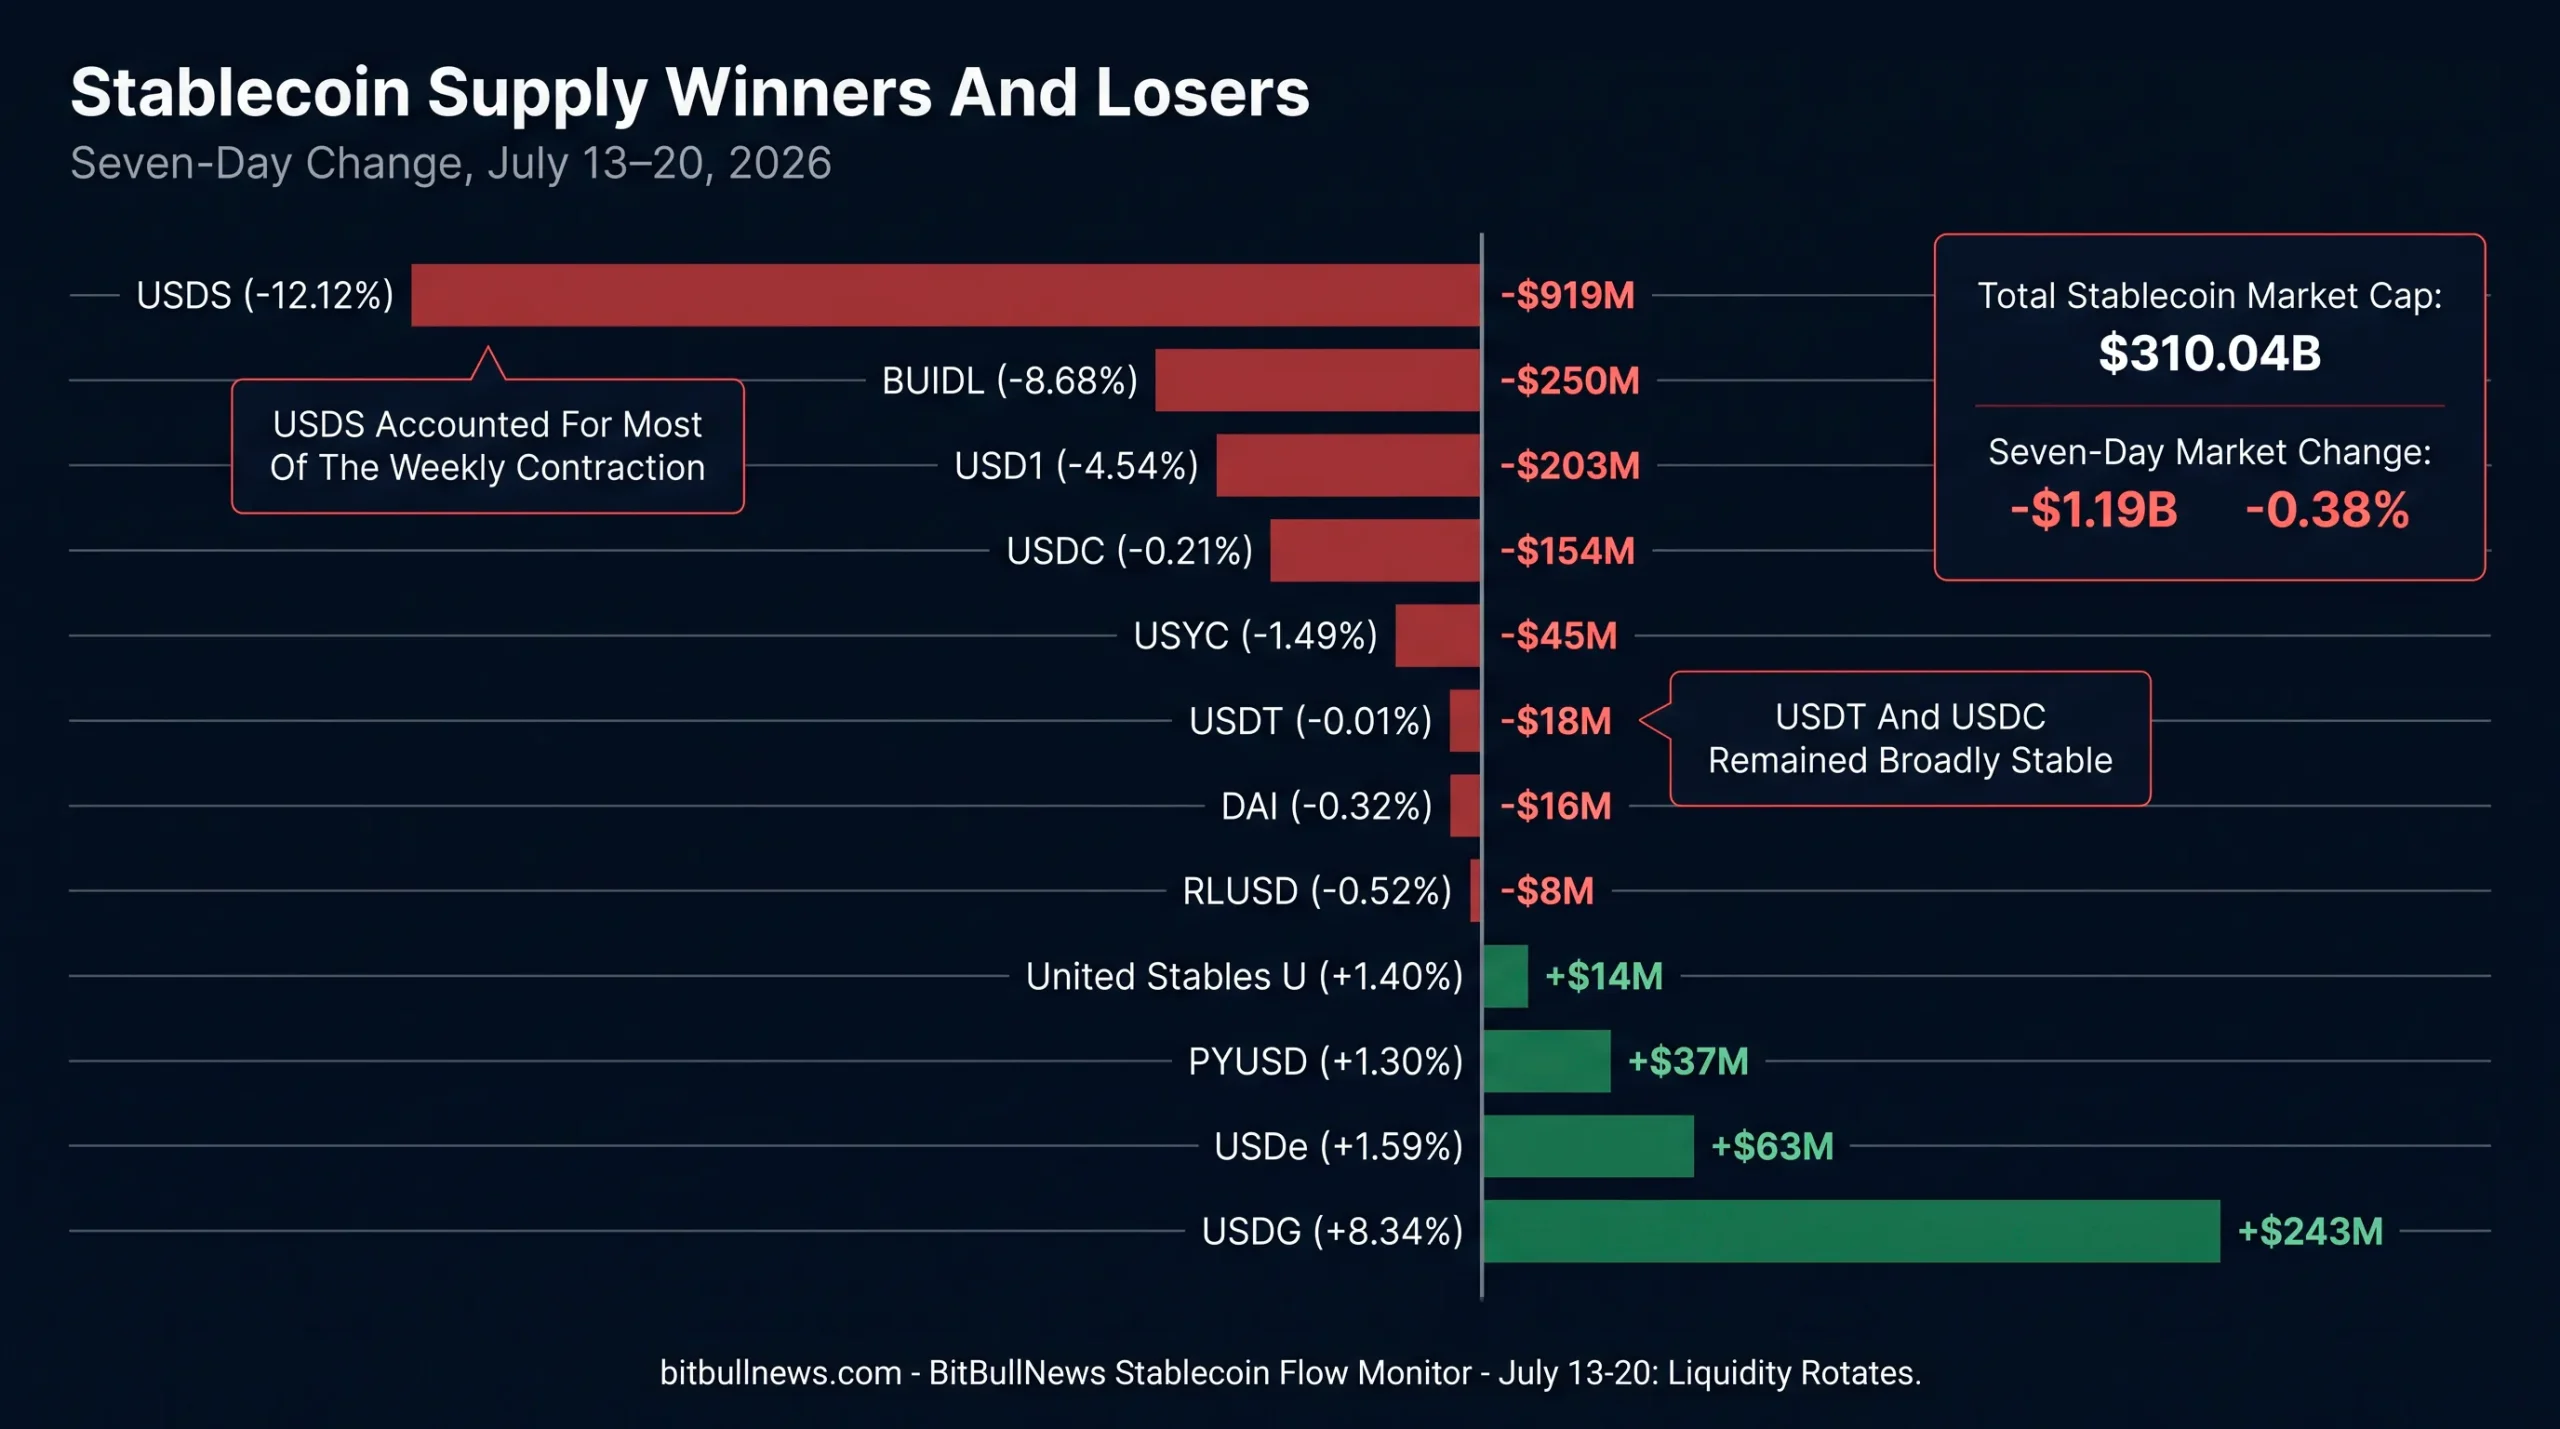
Horizontal Diverging Bar Chart Showing The Seven-Day Percentage And Estimated Dollar Supply Changes Of The Largest Stablecoins. Highlight USDS And BUIDL As The Main Contractions And USDG As The Largest Major Gainer.
The Pullback Was Driven By A Few Products
The market lost approximately $1.19 billion over seven days, but USDT and USDC together accounted for only around $172 million of estimated contraction.
USDT’s supply declined by just 0.01%, equivalent to roughly $18 million. USDC fell 0.21%, or approximately $154 million. Against a combined market capitalization of more than $257 billion, those moves were marginal.
The larger changes happened below the two market leaders.
| Stablecoin Or Tokenized Cash Product | Current Value | Seven-Day Change | Estimated Dollar Change |
|---|---|---|---|
| USDS | $6.67B | -12.12% | -$919M |
| BUIDL | $2.63B | -8.68% | -$250M |
| USD1 | $4.27B | -4.54% | -$203M |
| USDC | $73.38B | -0.21% | -$154M |
| USYC | $2.96B | -1.49% | -$45M |
| USDT | $184.02B | -0.01% | -$18M |
| DAI | $4.85B | -0.32% | -$16M |
| RLUSD | $1.53B | -0.52% | -$8M |
| USDG | $3.16B | +8.34% | +$243M |
| USDe | $4.01B | +1.59% | +$63M |
| PYUSD | $2.88B | +1.30% | +$37M |
| United Stables U | $1.05B | +1.40% | +$14M |
Estimated dollar changes are calculated from current values and DefiLlama’s displayed seven-day percentage changes. Figures are rounded and may not sum exactly because the underlying dashboards update continuously.
The distribution matters.
A broad stablecoin withdrawal would normally appear through meaningful contractions in USDT and USDC, which account for roughly 83% of the market. Instead, the two incumbents were nearly flat while USDS, BUIDL and USD1 produced most of the negative movement.
That points to product-specific repositioning rather than a systemic exit from stablecoins.
USDS Accounted For Most Of The Weekly Decline
Sky Dollar recorded the largest major supply contraction.
USDS fell 12.12% to approximately $6.67 billion, removing an estimated $919 million from circulation. More than 98% of the remaining USDS supply sat on Ethereum in the latest token-level snapshot. Ethereum-based USDS fell almost 12% during the same period.
The contraction was not offset by a return to DAI. DAI supply declined another 0.32% during the week.
That detail weakens the argument that the movement was simply an internal migration from USDS back into its predecessor. Public supply data does not identify whether holders redeemed into USDC, moved into savings products, repaid debt or shifted capital elsewhere.
The only defensible conclusion is that Sky’s primary circulating dollar contracted sharply while the wider stablecoin market remained comparatively stable.
For risk managers, this is a reminder that crypto-backed stablecoin supply can respond differently from fiat-backed issuance. USDS depends on Sky Protocol’s collateral, debt and savings architecture rather than a conventional process in which verified customers exchange bank dollars directly with an issuer.
BUIDL Contracted While Consolidating On Ethereum
BlackRock’s BUIDL token fell 8.68% to $2.63 billion, an estimated weekly decline of about $250 million.
The chain-level data shows that this was not a simple, uniform redemption.
| BUIDL Network | Current Supply | Seven-Day Change | Approximate Dollar Change |
|---|---|---|---|
| Ethereum | $1.16B | +13.18% | +$135M |
| Avalanche | $736.05M | -18.46% | -$167M |
| Solana | $547.36M | -13.19% | -$83M |
| BNB Chain | $110.62M | -54.97% | -$135M |
| OP Mainnet | $26.30M | +0.06% | Flat |
| Arbitrum | $24.49M | +0.06% | Flat |
| Aptos | $16.13M | +0.07% | Flat |
| Polygon | $13.69M | -1.83% | Below -$1M |
BUIDL supply increased on Ethereum while falling sharply on Avalanche, Solana and BNB Chain. The aggregate token supply still declined, indicating that cross-chain redistribution occurred alongside net contraction.
This is an important distinction.
A fall in supply on one network does not necessarily mean investors exited the product. Capital may move through redemptions, reissuance or internal allocation changes between supported networks. In BUIDL’s case, Ethereum regained a larger share of the remaining supply even as the total fund footprint shrank.
BUIDL also differs from a conventional payment stablecoin. It represents an interest-bearing institutional fund backed by cash, U.S. Treasury bills and repurchase agreements. It targets a stable $1 token value but pays accrued income through additional tokens.
Classifying it alongside USDT and USDC can be useful for measuring dollar-denominated onchain liquidity. It should not erase the legal and economic differences between a redeemable stablecoin and a regulated investment-fund share.
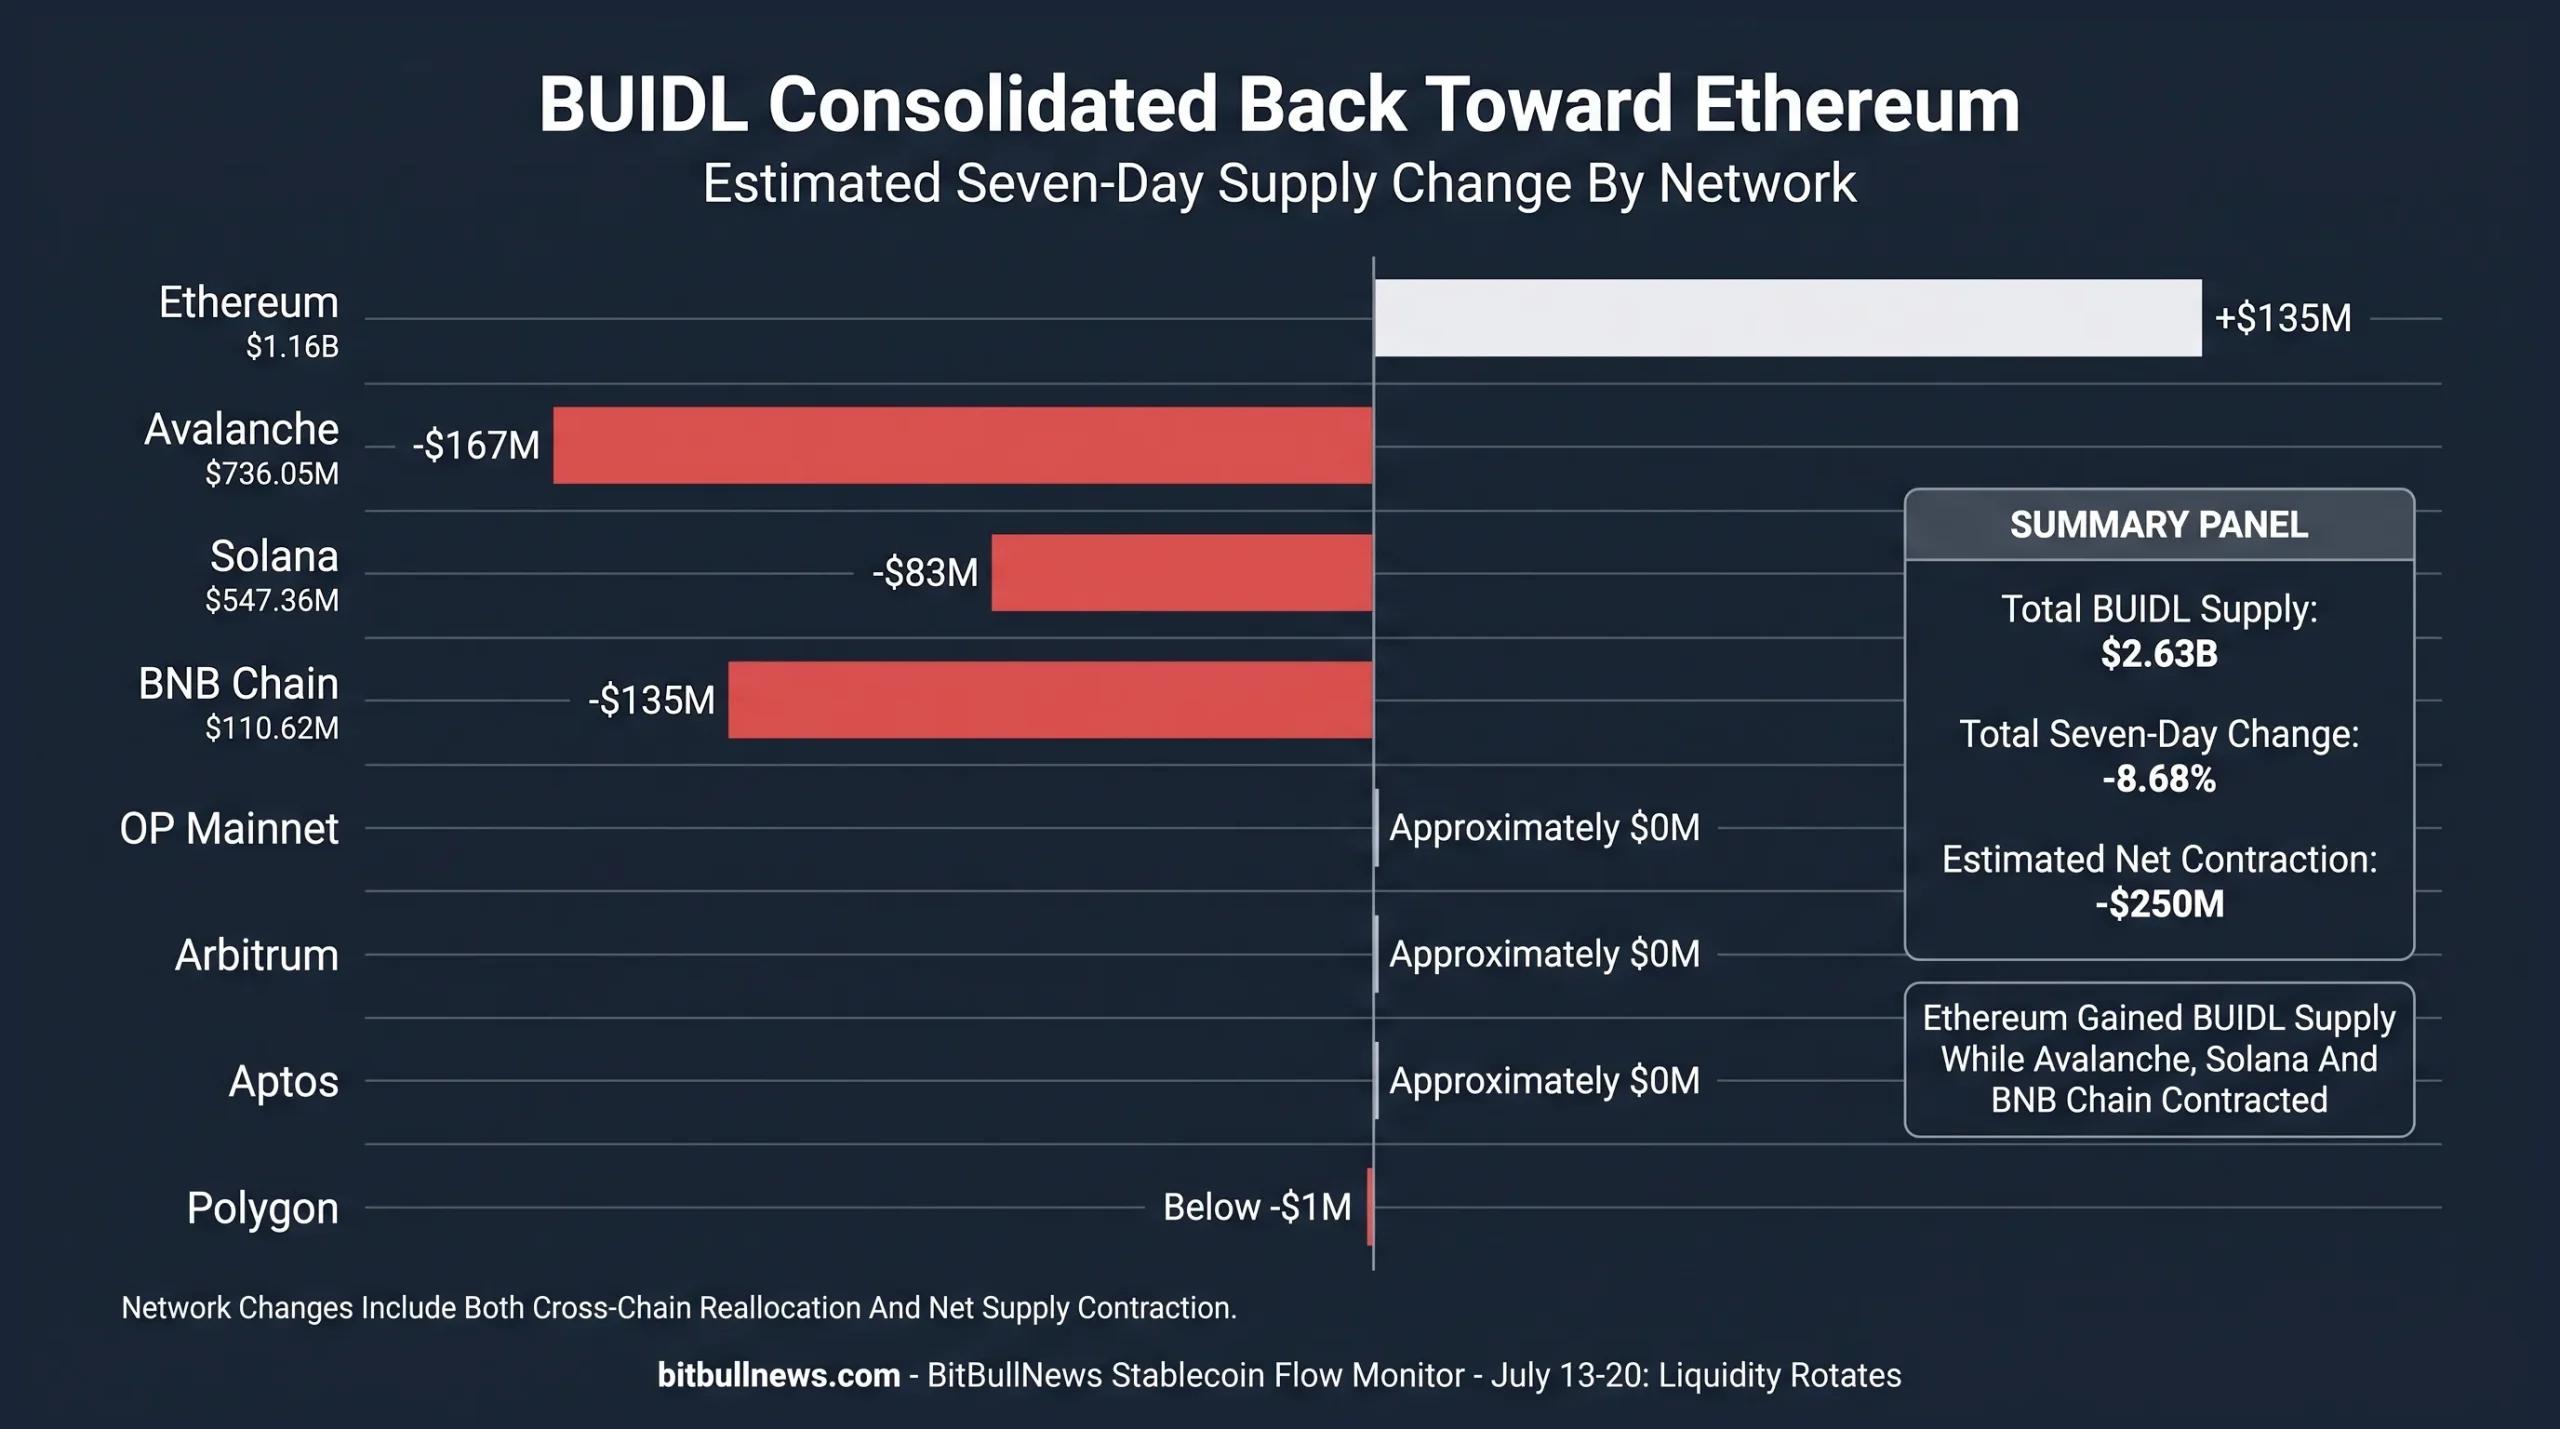
Stacked Or Grouped Horizontal Bar Chart Showing BUIDL Supply By Network And Its Seven-Day Change. Emphasize Ethereum’s $135M Increase Against Declines On Avalanche, Solana And BNB Chain.
USDT And USDC Remained The Market’s Anchor
USDT ended the period at approximately $184.02 billion, maintaining 59.35% market dominance. USDC stood at $73.38 billion, representing another 23.67% of the market. Together, the two tokens controlled approximately 83.02% of total stablecoin capitalization.
Neither recorded a material weekly supply change.
That stability is the strongest evidence against interpreting the $1.19 billion market decline as a general liquidity shock. The products most commonly used for centralized exchange collateral, cross-border transfers, DeFi settlement and institutional minting remained intact.
The network composition beneath those totals did change.
USDT Rotated Toward Solana
USDT supply on Solana increased 16.87% to approximately $2.91 billion. That represents an estimated weekly addition of roughly $421 million.
At the same time:
- Tron-based USDT declined 0.10% to $89.61 billion.
- Ethereum-based USDT fell 0.44% to $76.18 billion.
- Arbitrum-based USDT declined 3.38%.
- Polygon-based USDT increased 0.82%.
Solana therefore gained USDT without requiring Tether’s total supply to expand. The movement was primarily a change in where liquidity was deployed.
The chain still held far less USDT than Tron or Ethereum, but a 16.87% weekly increase is large enough to matter for exchange settlement, DeFi pools and payments infrastructure on Solana.
USDC Shifted Toward Hyperliquid
USDC’s network pattern moved in the opposite direction on Solana.
Solana-based USDC declined 2.89% to $7.09 billion. Ethereum-based USDC increased 0.19%, while Hyperliquid’s USDC supply rose 1.96% to approximately $6.10 billion. Base, Arbitrum and Polygon all recorded declines.
Hyperliquid now holds a USDC balance approaching Solana’s, despite being a much narrower ecosystem centered on trading and financial applications.
That does not make Hyperliquid a larger general-purpose stablecoin network. It shows how rapidly a specialized venue can absorb dollar collateral when its applications create concentrated demand.
Solana Gained Despite Losing USDC
At the chain level, Ethereum remained dominant with $149.67 billion in stablecoin capitalization, equal to 48.58% of the tracked market. Its supply fell 0.55%, removing approximately $828 million.
Solana gained 0.93% to $15.16 billion.
The token-level breakdown explains the apparent contradiction:
- Solana USDT increased by roughly $421 million.
- Solana USDC declined by approximately $211 million.
- BUIDL fell by roughly $83 million.
- Smaller products accounted for the remaining difference.
The network gained stablecoin liquidity because Tether issuance and migration outweighed the contractions in USDC and tokenized Treasury products.
| Network | Stablecoin Supply | Seven-Day Change | Estimated Dollar Change | Dominant Stablecoin |
|---|---|---|---|---|
| Ethereum | $149.67B | -0.55% | -$828M | USDT |
| Tron | $90.36B | -0.07% | -$63M | USDT |
| Solana | $15.16B | +0.93% | +$140M | USDC |
| BNB Chain | $13.52B | -2.08% | -$287M | USDT |
| Hyperliquid | $6.28B | +1.83% | +$113M | USDC |
| Base | $4.88B | -0.19% | -$9M | USDC |
| Arbitrum | $3.56B | -2.10% | -$76M | USDC |
| Polygon | $3.34B | -1.89% | -$64M | USDC |
| X Layer | $1.93B | +0.44% | +$8M | USDG |
| Avalanche | $1.60B | -11.31% | -$203M | BUIDL |
| Aptos | $1.15B | +6.09% | +$66M | USDT |
| XRP Ledger | $980.26M | +5.06% | +$47M | RLUSD |
| Plasma | $940.25M | -5.01% | -$50M | USDT |
Estimated dollar changes are derived from current supply and DefiLlama’s seven-day percentage changes.
Avalanche posted the steepest decline among the major networks, losing 11.31%. BUIDL was its dominant dollar product and fell 18.46% on the network, making the BlackRock fund’s redistribution a major contributor to Avalanche’s weekly result.
Aptos and XRP Ledger moved in the opposite direction. Aptos gained 6.09%, with USDT accounting for more than 73% of its stablecoin supply. XRP Ledger increased 5.06%, with RLUSD representing roughly 90% of the network’s total.
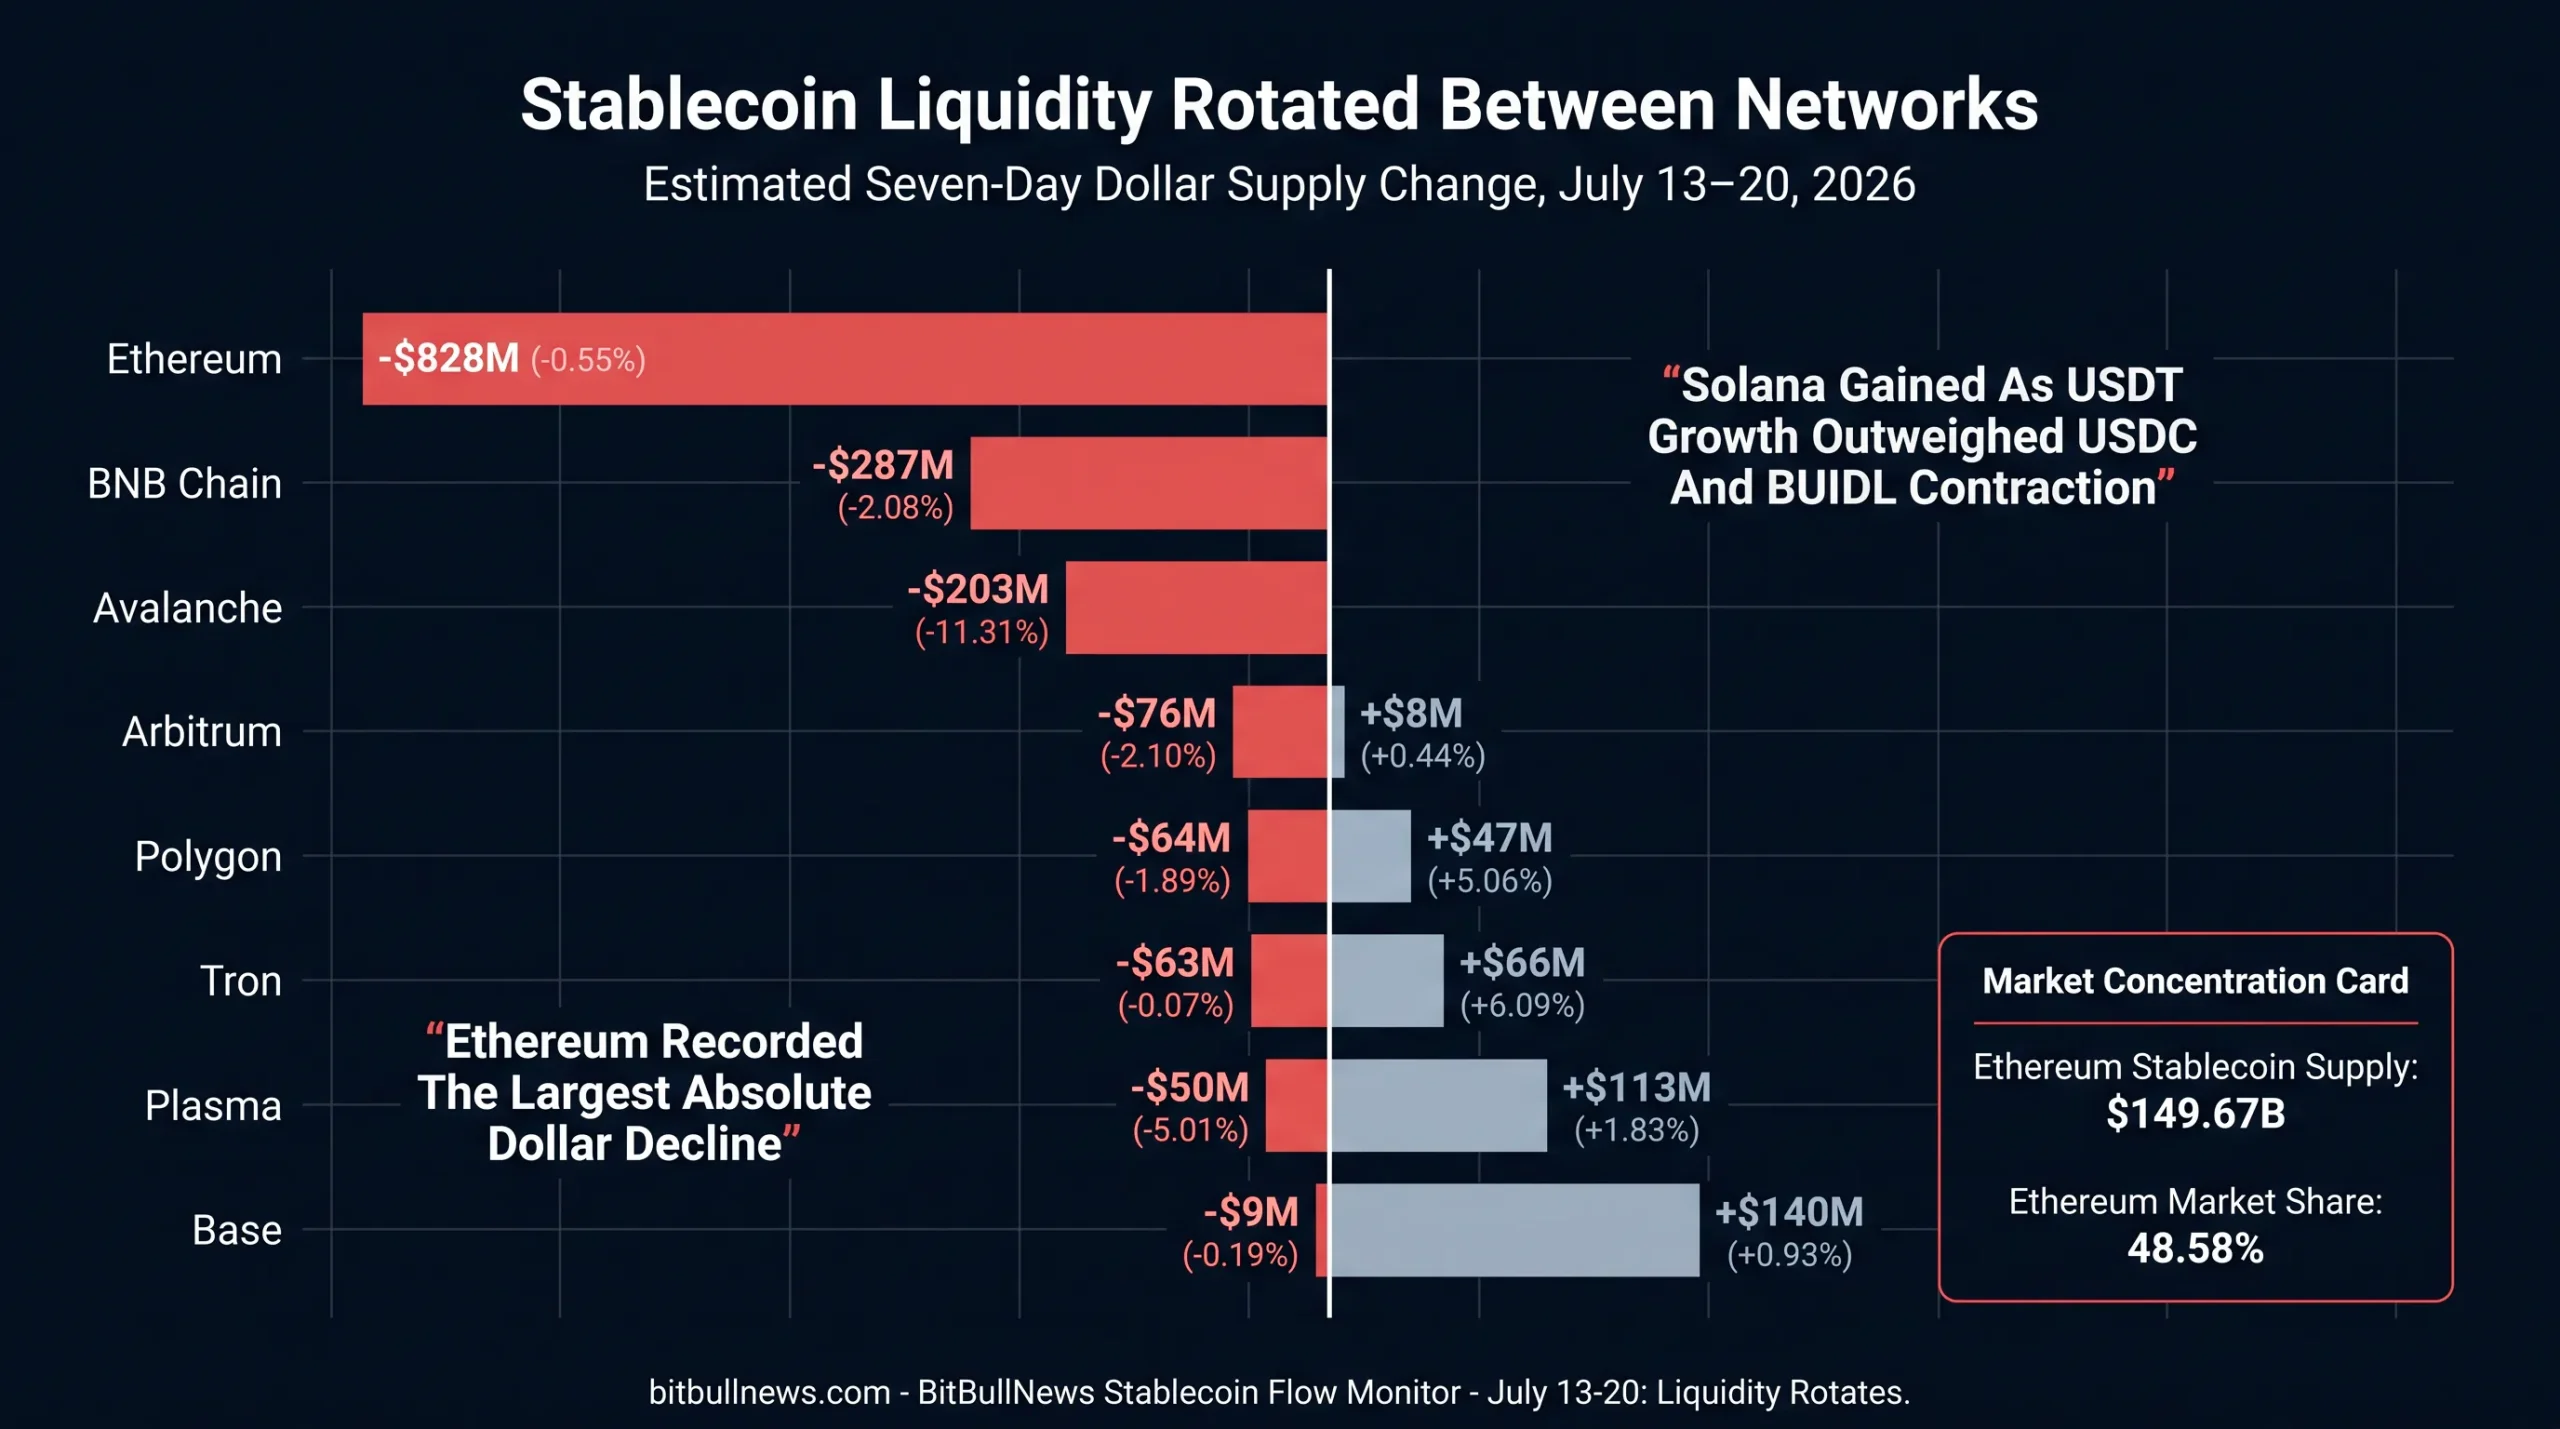
Horizontal Diverging Bar Chart Showing Seven-Day Stablecoin Supply Changes By Network. Highlight Ethereum, BNB Chain And Avalanche As The Largest Dollar Declines, And Solana, Hyperliquid, Aptos And XRP Ledger As Gainers.
Supply Held Up Better Than Usage
The activity data was weaker than the supply data.
Artemis tracked $314.8 billion of stablecoin supply, down 1.1% over 30 days. Average daily transfer volume fell 26.2% compared with the previous 30-day period, to $194.3 billion.
Transactions declined 11.3% to an average of 63.2 million per day. Active addresses fell 7.8% to 4.5 million.
| Artemis Activity Metric | Current Daily Average | Change Versus Previous 30 Days |
|---|---|---|
| Stablecoin Supply | $314.80B | -1.10% |
| Transfer Volume | $194.30B | -26.20% |
| Transactions | 63.20M | -11.30% |
| Active Addresses | 4.50M | -7.80% |
The differences in scale are informative.
Transfer volume declined much faster than supply, transaction count or active addresses. That means the average amount moved per transaction and per active address also fell.
Users did not disappear at the same rate as capital movement. They continued transacting, but the value moving through the system was smaller.
That pattern can emerge when:
- Institutional settlement activity slows.
- Exchange-related transfers decline.
- Large treasury movements become less frequent.
- Retail and payment-sized transactions represent a larger share of activity.
The aggregate data cannot isolate which explanation dominated. It does show that stablecoin supply was not being used as intensively as during the preceding 30-day period.
This is a more cautious signal than a pure supply chart would provide. Outstanding tokens measure available digital-dollar liquidity. Transfer volume and active addresses show whether that liquidity is circulating.
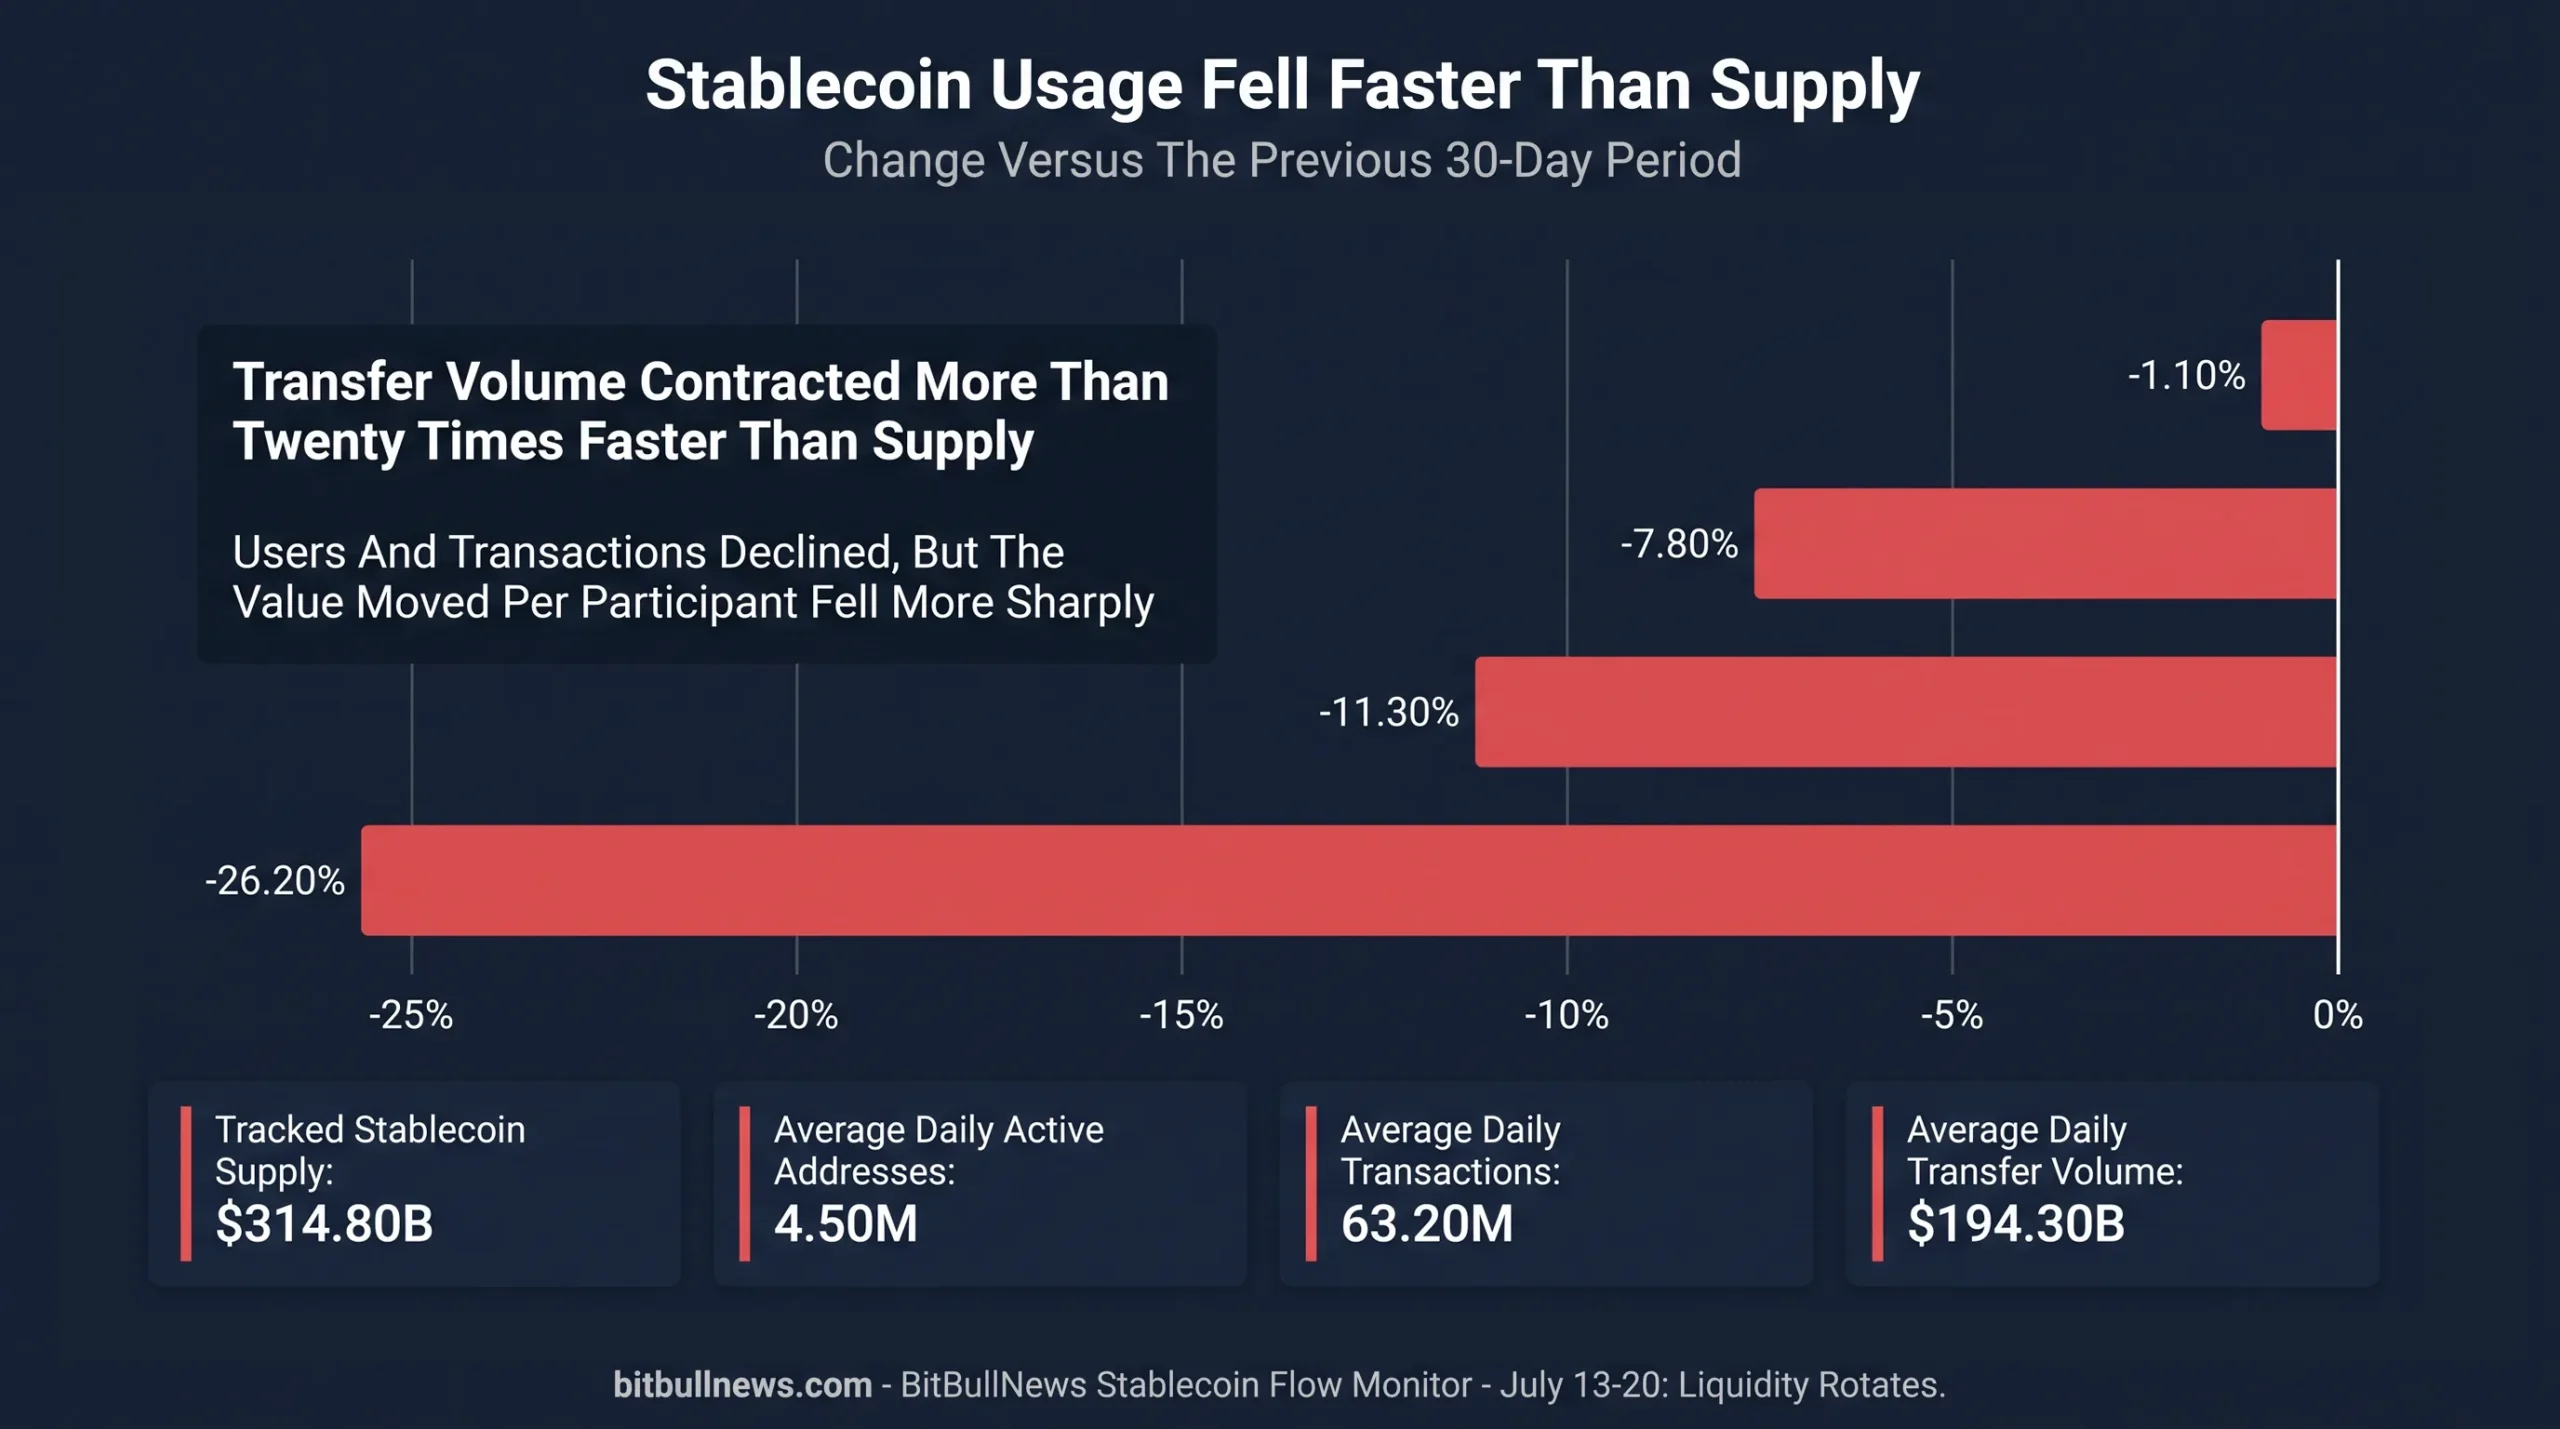
Four-Bar Divergence Chart Showing 30-Day Changes In Supply, Average Daily Transfer Volume, Transactions And Active Addresses. Emphasize That Volume Fell 26.2% While Supply Declined Only 1.1%.
Only A Small Share Of Stablecoins Is Deployed In DeFi
Stableflows.finance tracked $255.64 billion of USDT, USDC, USDT0 and PYUSD supply across its supported networks on July 20. Approximately $10.37 billion was deposited in tracked DeFi protocols, producing a utilization rate of 4.1%. The stablecoin positions represented 8.4% of total DeFi TVL in the monitored market.
| Network | Stablecoins In DeFi | Tracked Stablecoin Supply | Utilization Rate |
|---|---|---|---|
| Ethereum | $7.92B | $124.97B | 6.3% |
| Solana | $931.03M | $10.66B | 8.7% |
| Avalanche | $314.87M | $798.42M | 39.4% |
| Arbitrum | $307.00M | $3.32B | 9.2% |
| Base | $282.29M | $4.24B | 6.7% |
| BNB Chain | $188.90M | $10.76B | 1.8% |
| Plasma | $114.45M | $756.05M | 15.1% |
| Hyperliquid | $98.67M | $6.22B | 1.6% |
| Polygon | $61.88M | $2.70B | 2.3% |
| Sui | $54.75M | $271.76M | 20.1% |
| Stellar | $43.61M | $270.41M | 16.1% |
| Tron | $37.84M | $89.50B | Below 0.1% |
Scope Note: The dashboard tracks USDC, USDT, USDT0 and PYUSD deployed in selected DeFi protocols. It does not measure every stablecoin or every use case.
Ethereum held the largest absolute amount of stablecoins in DeFi, but Avalanche posted the highest utilization rate among the major networks in the table.
Tron showed the reverse structure. It held almost $90 billion of tracked stablecoins, yet less than $38 million appeared in the monitored DeFi protocols. Tron’s stablecoin economy is therefore primarily associated with transfers, exchange settlement and other uses outside the dashboard’s DeFi scope.
Hyperliquid also had low measured DeFi utilization despite holding more than $6 billion in stablecoins. Much of that liquidity is tied to the network’s specialized trading architecture rather than the conventional lending and liquidity pools included in broad DeFi measurements.
Supply should never be treated as a direct proxy for productive deployment. A token can sit on an exchange, support remittances, serve as trading collateral or remain idle in a wallet without appearing in DeFi TVL.
USDG Was The Week’s Largest Major Gainer
Global Dollar increased 8.34% to approximately $3.16 billion, adding an estimated $243 million.
Paxos issues USDG through its Singapore-regulated entity. The product is designed to be redeemable one-to-one for U.S. dollars, and Paxos publishes monthly reserve attestations.
The growth deserves attention because it came during a contracting week for the broader market.
USDG remains far smaller than USDT or USDC, but an 8.34% weekly expansion shows that regulated alternatives can gain share without requiring market-wide supply growth. Capital can rotate between stablecoins while the total pool remains flat or declines.
The public data does not identify which platform or investor group created the new supply. It would be premature to attribute the increase to a specific partnership, exchange or jurisdiction.
The measurable signal is that USDG expanded while several larger products contracted.
PYUSD Continued Its Gradual Expansion
PayPal USD increased 1.30% to approximately $2.88 billion, adding an estimated $37 million.
PayPal currently advertises a 4% annual rewards rate for eligible PYUSD balances and plans availability across approximately 70 markets. The token can be used within PayPal, transferred to external wallets and spent through supported merchant infrastructure.
Those distribution channels provide PYUSD with a different growth model from exchange-centered stablecoins.
USDT’s scale is built around global trading and dollar settlement. USDC combines crypto-market liquidity with institutional minting, payments and regulated financial infrastructure. PYUSD can be distributed directly inside an existing consumer and merchant network.
The weekly supply increase does not prove that rewards or international availability caused the new issuance. It does show that PYUSD continued growing while most of its major fiat-backed competitors were flat or negative.
Network-level data was less positive. PYUSD declined on Ethereum, Solana and Arbitrum during the latest token-specific seven-day snapshot. That suggests the aggregate increase may have occurred through other supported environments or reflects differences in dashboard update timing.
USDe Stabilized After A Larger Monthly Contraction
USDe increased 1.59% over seven days to approximately $4.01 billion.
The weekly rise followed a weaker broader period. Artemis still showed USDe supply down 2.04% over 30 days, while its average daily transfer volume declined 34.46%. Transaction count and active addresses, however, rose from the previous comparison period.
The chain-level composition was mixed:
- Ethereum-based USDe increased 5.39%.
- Base increased 7.24%.
- Plasma increased 18.49%.
- BNB Chain fell 21.04%.
- Mantle declined 5.35%.
USDe’s weekly recovery therefore included both net expansion and cross-chain redistribution.
Because USDe maintains stability through collateral and delta-neutral hedging rather than cash reserves alone, its supply can respond to derivatives funding, collateral demand and the economics of the protocol’s yield products.
The current data shows stabilization, not a return to sustained expansion. One positive week is not enough to reverse the weaker monthly trend.
Peg Stability Was Not The Main Risk
DefiLlama displayed USDT, USDC, USDS, DAI, USD1, USDe, USDG and PYUSD at or very close to $1 in the latest snapshot. No major stablecoin in the market’s top tier experienced a persistent system-wide depeg during the reporting period.
The week’s risk came from supply and liquidity distribution rather than price stability.
That distinction matters. A stablecoin can maintain its peg while losing billions in circulation. Redemptions reduce the issuer’s footprint without necessarily damaging secondary-market pricing, provided arbitrage and redemption channels remain functional.
For institutional users, peg stability should be monitored alongside:
- The speed and concentration of redemptions.
- Reserve liquidity.
- Primary-market access.
- Chain-specific liquidity.
- Exchange and DeFi depth.
- The legal claim represented by the token.
A $1 price confirms that the market is clearing near par. It does not show how easily a large holder can redeem, transfer or liquidate a position during stress.
What Traders And Treasury Managers Should Watch
Whether USDS Stabilizes
USDS produced the week’s largest supply contraction by a wide margin.
Another double-digit decline would turn a concentrated weekly event into a more persistent change in Sky’s circulating dollar base. Stabilization would support the interpretation that the move reflected a discrete portfolio adjustment.
Whether Solana’s USDT Expansion Persists
Solana added roughly $421 million of USDT while losing around $211 million of USDC.
Continued Tether growth would reduce the network’s historical dependence on USDC and deepen the number of available dollar-liquidity channels. A reversal would suggest the increase was a temporary allocation rather than structural demand.
Whether BUIDL Continues Consolidating On Ethereum
BUIDL expanded on Ethereum while shrinking on several alternative networks.
The next data point should reveal whether that was a one-week rebalancing or the beginning of a more concentrated deployment strategy. Chain-level reductions matter even when investors retain exposure to the same fund elsewhere.
Whether Usage Recovers Before Supply
Transfer volume fell much faster than supply.
A healthier next phase would show transaction volume and active addresses recovering without requiring another large wave of token issuance. More supply with falling velocity would add idle liquidity rather than demonstrate greater adoption.
Whether USDG Broadens Beyond Its Core Networks
USDG was the strongest major supply gainer.
The quality of that growth depends on whether liquidity spreads across wallets, exchanges, payment routes and networks rather than accumulating in a small number of controlled addresses or venues.
Whether DeFi Utilization Moves Above 4%
Only 4.1% of the stablecoin supply tracked by Stableflows was deployed in its monitored DeFi protocols.
Higher utilization could signal stronger lending and trading demand. It could also increase smart-contract and counterparty exposure. The direction is less important than understanding where the capital is being placed and what risk it earns.
Stablecoin Risk Dashboard
| Signal | Current Reading | Interpretation | Confirmation Needed |
|---|---|---|---|
| Total Market Supply | -0.38% Over Seven Days | Moderate contraction | Stabilization in USDS and tokenized cash products |
| USDT Supply | -0.01% | Core offshore dollar liquidity held steady | Continued chain-level demand |
| USDC Supply | -0.21% | Small contraction, not a major redemption wave | Return to net minting |
| USDS Supply | -12.12% | Largest source of weekly weakness | Evidence that contraction has stopped |
| BUIDL Supply | -8.68% | Fund shrank while consolidating on Ethereum | Stable multi-chain allocation |
| USDG Supply | +8.34% | Regulated challenger gained market share | Broader distribution and usage |
| Solana Stablecoins | +0.93% | USDT growth outweighed USDC and BUIDL declines | Follow-through in USDT liquidity |
| Ethereum Stablecoins | -0.55% | Largest absolute network outflow | Recovery across USDS and major fiat-backed tokens |
| Average Daily Transfer Volume | -26.20% Over 30 Days | Stablecoins circulated less intensively | Volume recovery without artificial churn |
| Average Daily Active Addresses | -7.80% Over 30 Days | Participation softened but remained more resilient than volume | Renewed wallet growth |
| DeFi Utilization | 4.10% | Most stablecoins remain outside tracked DeFi protocols | Productive deployment without excessive risk |
| Peg Stability | Major Tokens Near $1 | No broad price-stability event | Continued primary-market liquidity |
Resilience at the Top, Rotation Beneath
Stablecoin supply fell this week, but the market’s core did not break.
USDT was effectively unchanged. USDC declined by only 0.21%. Together, the two largest stablecoins still controlled approximately 83% of the market.
The $1.19 billion contraction came mainly from USDS, BUIDL and USD1. That makes the week a story of product-level repositioning rather than a general withdrawal from digital dollars.
Network flows told a second story.
Ethereum, BNB Chain and Avalanche lost liquidity. Solana gained because a roughly $421 million increase in USDT outweighed contractions in USDC and BUIDL. Hyperliquid continued absorbing USDC, while Aptos and XRP Ledger also expanded.
The weaker signal came from usage. Average daily stablecoin transfer volume fell 26.2% over the latest 30-day comparison period, much faster than supply, transactions or active addresses. Digital dollars remained available, but they circulated less intensively.
That is the metric that matters next.
The stablecoin market does not need another wave of issuance to demonstrate strength. It needs existing supply to move through payments, settlement, trading and productive financial applications without creating excessive concentration or contract risk.
This week showed resilience at the top, stress in selected products and rapid liquidity rotation beneath the surface.
Data Sources & References
- DefiLlama Stablecoin Market Dashboard
- DefiLlama Stablecoins By Chain
- DefiLlama USDT Data
- DefiLlama USDC Data
- DefiLlama USDS Data
- DefiLlama USDe Data
- DefiLlama PYUSD Data
- DefiLlama BUIDL Data
- Artemis Stablecoin Analytics
- Visa Onchain Analytics
- Circle Transparency And Reserve Reporting
- Tether Transparency
- Paxos USDG Transparency
- Paxos USDG Documentation
- PayPal USD Product Information
- Stableflows DeFi Utilization Dashboard