



Content
The crypto derivatives market grew less fragile this week, even as Bitcoin moved toward its highest level since early June.

Bitcoin gained 2.88% over seven days to the latest completed New York close of $66,404. Ether advanced 2.42% to $1,923, leaving BTC ahead by 0.46 percentage points. The move was modest, but the way it happened matters: perpetual funding remained controlled, futures open interest declined during the latest 24-hour window and U.S. spot ETFs absorbed nearly $887 million across BTC and ETH over five completed sessions.
This was different from the previous week’s short-covering surge.
Leveraged funds continued adding net shorts in standard CME Bitcoin and Ether futures through July 14. Prices then rose without funding reaching stressed levels. That left the market with a constructive but unstable combination: stronger spot demand, a persistent institutional short base and a heavily call-skewed options book approaching the July 31 expiry.
The immediate risk is no longer excessive funding. It is concentration. Bitcoin options open interest is heavily clustered around a handful of expiries and upside strikes, while Ether’s near-term July 24 expiry carries more put than call open interest even though the wider ETH options book remains call-heavy.
Data Cutoff: Price returns use the latest completed Coin Metrics New York close available on July 22. Futures, funding and options figures use live July 22 snapshots. U.S. ETF flows include the five completed sessions from July 15 through July 21.
Market Structure Scorecard
| Metric | Bitcoin | Ether | Market Read |
|---|---|---|---|
| Seven-Day Benchmark Return | +2.88% | +2.42% | BTC regained a narrow relative-performance lead |
| Latest New York Close | $66,404 | $1,923 | Both assets held near weekly highs |
| Three-Month Realized Volatility | 36.62% | 52.49% | ETH remained the higher-beta market |
| Aggregated Futures Open Interest | $21.6B | $12.3B | BTC retained the larger outstanding futures base |
| 24-Hour Open Interest Change | -1.40% | -2.21% | Leverage declined as prices held firm |
| Average Funding Rate | +0.0078% | +0.0030% | Longs paid shorts, but positioning was not crowded |
| 24-Hour Futures Volume | $21.1B | $14.8B | ETH turnover remained high relative to its market size |
| 24-Hour Liquidations | $34.8M | $17.1M | No broad liquidation cascade was underway |
| Deribit Options Open Interest | $28.78B | $3.26B | Options exposure remained heavily BTC-dominated |
| 30-Day Implied Volatility | 38.09% | 51.04% | Options priced materially higher risk for ETH |
Coin Metrics supplied the benchmark returns and realized-volatility figures. Coinalyze supplied the live futures snapshot, while Deribit-based options data came through PerpFinder’s July 22 feed.
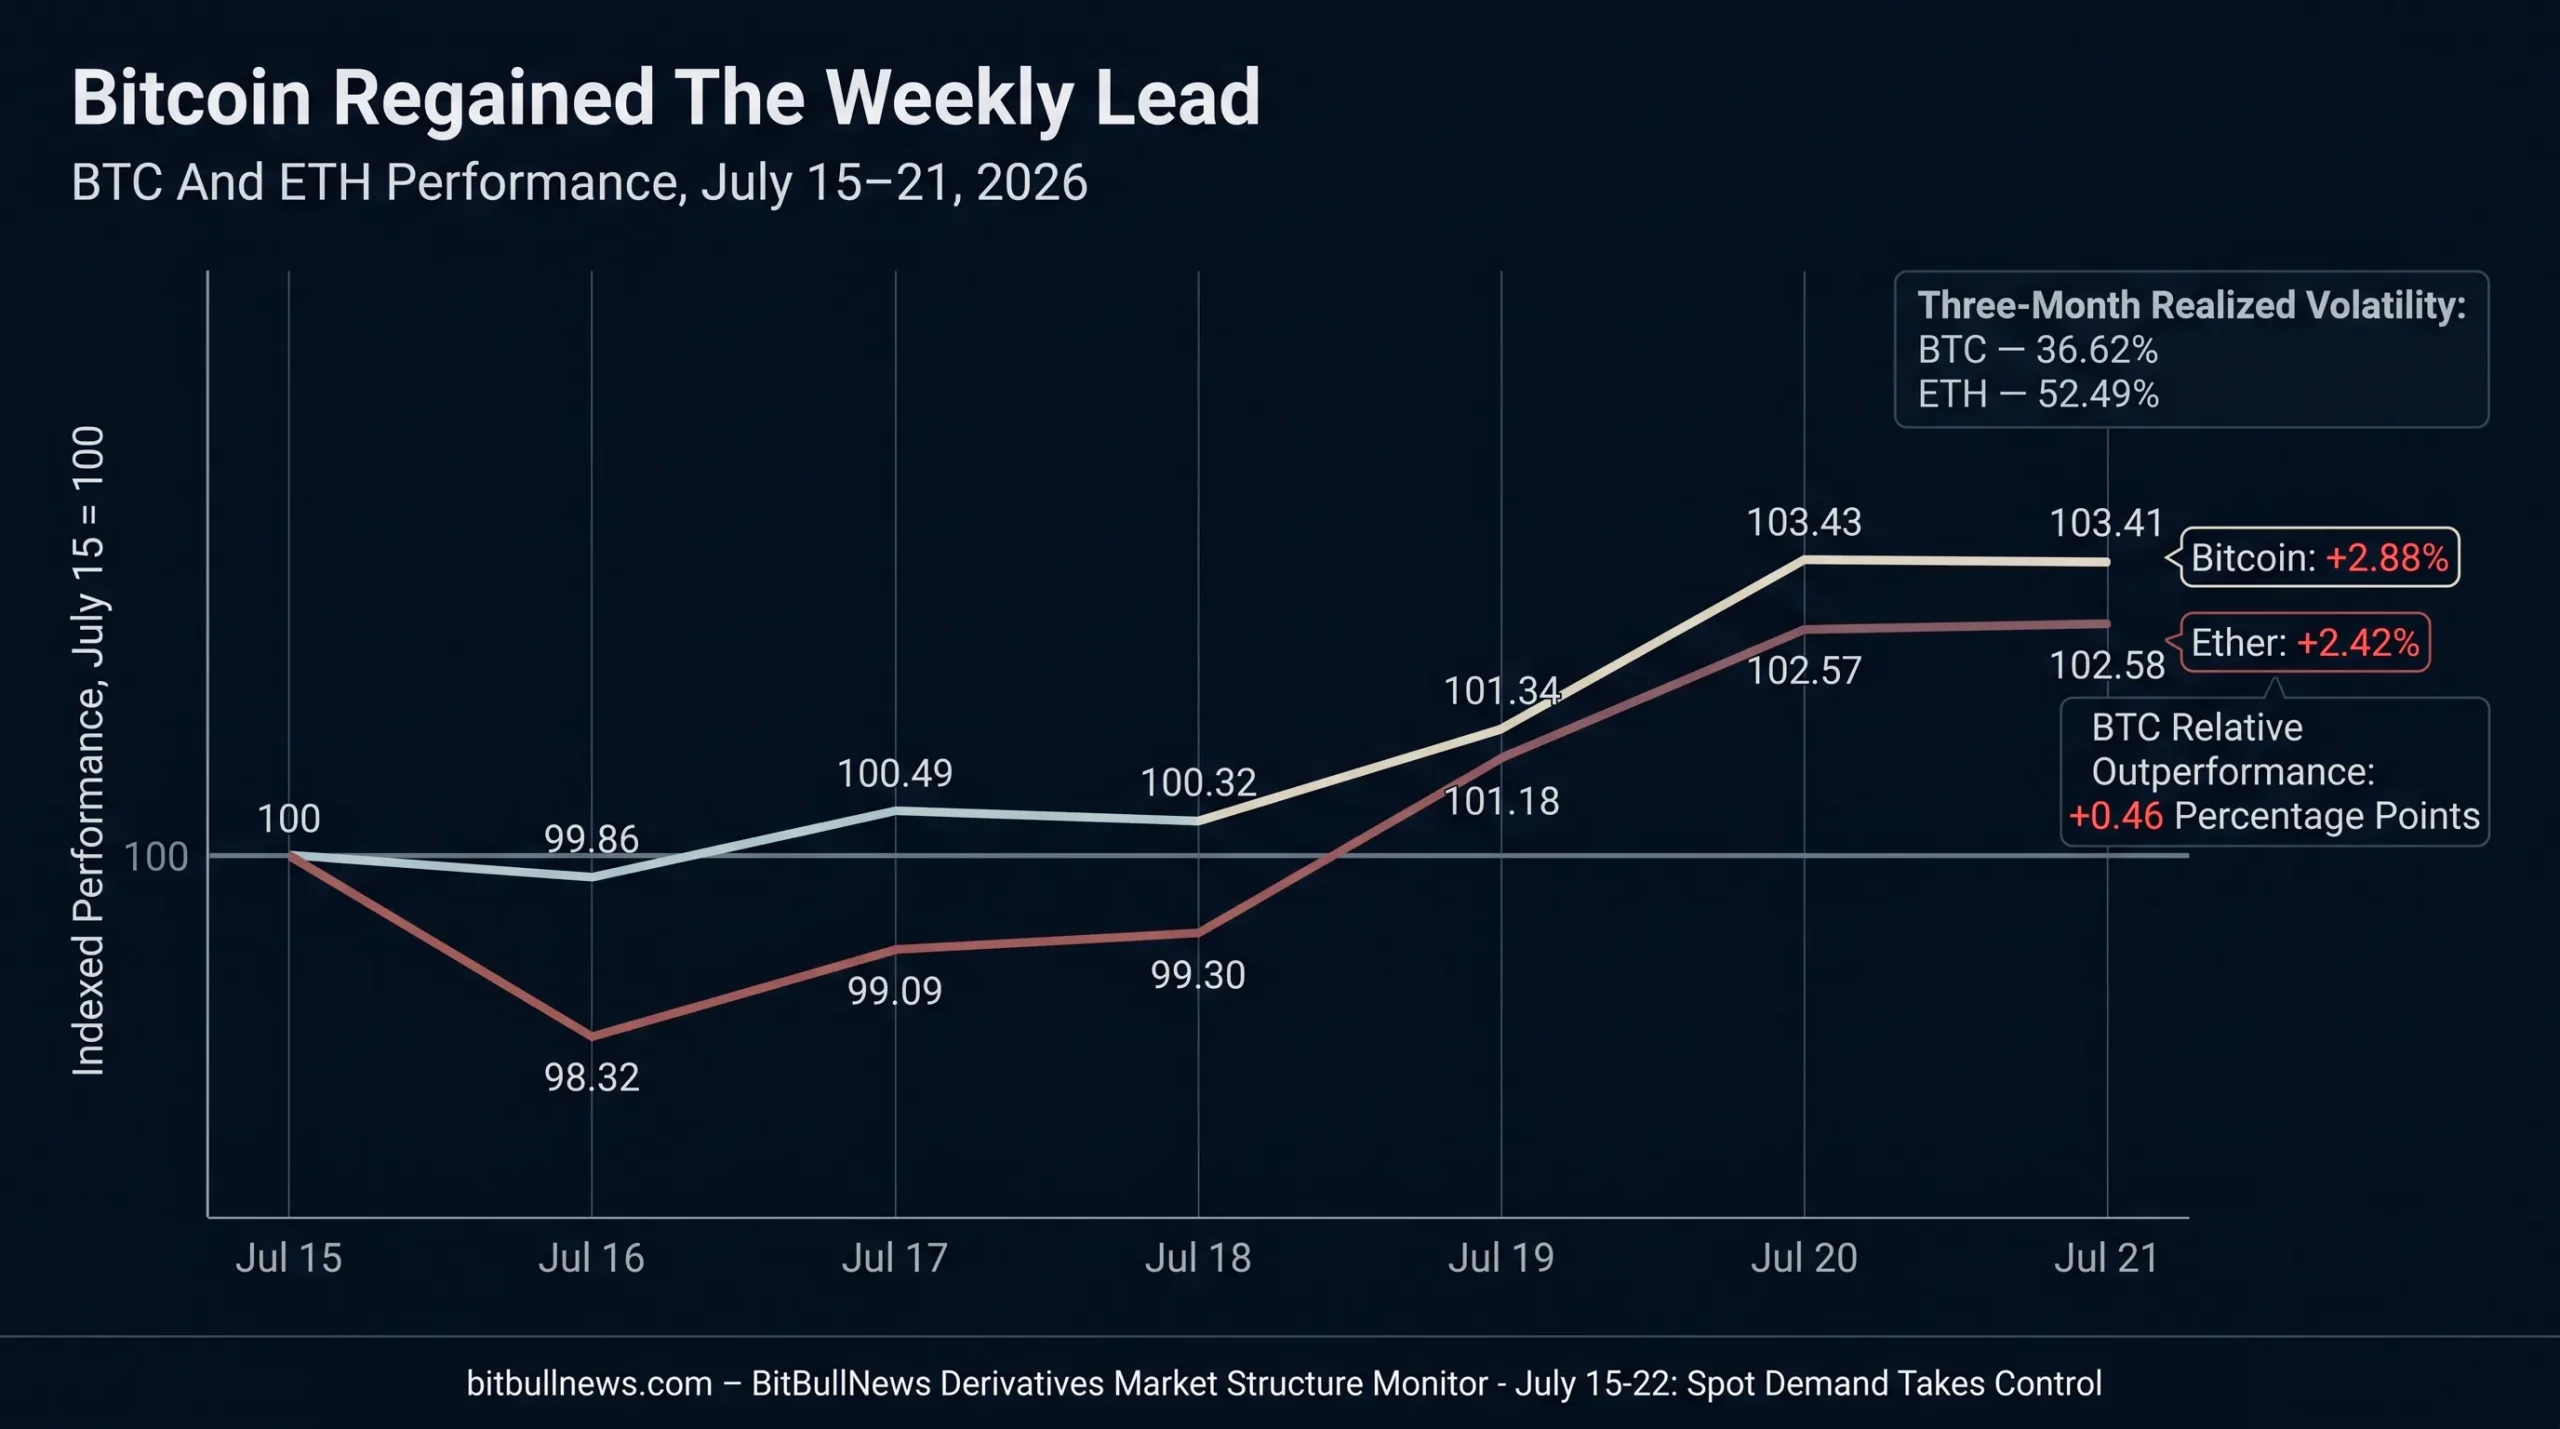
Indexed Line Chart Comparing BTC And ETH Performance From July 15 Through July 21, 2026. Set Both Assets To 100 At The July 15 New York Close. Annotate Bitcoin’s Break Above $66,000 And Show Period Returns Of +2.88% For BTC And +2.42% For ETH.
Price Rose While Leverage Cooled
The strongest signal this week was the divergence between price and short-term leverage.
Bitcoin futures open interest stood at $21.6 billion in the July 22 snapshot, down 1.40% over 24 hours. Ether open interest fell 2.21% to $12.3 billion. Both assets were trading close to their highest levels of the monitoring period despite the decline in outstanding futures positions.
That is generally cleaner than a rally built on rapidly expanding open interest.
When price and open interest rise together, the market is adding leverage in the direction of the move. That can strengthen momentum, but it also raises the amount of positioning that must be liquidated if the trend reverses. When price holds while open interest contracts, weaker positions are being removed without forcing the underlying asset lower.
Funding reinforced that interpretation.
Bitcoin’s average displayed funding rate was +0.0078%, while Ether’s was only +0.0030%. Long positions still paid shorts, but neither rate signalled an urgent scramble for leveraged upside exposure. Predicted funding remained similarly contained at +0.0070% for BTC and +0.0062% for ETH.
The market therefore entered July 22 with less obvious perpetual-futures stress than it carried during the previous week’s rebound.
That does not mean leverage disappeared. BTC and ETH together represented almost 73% of the open interest tracked in Coinalyze’s cross-market snapshot. A sharp move in either asset would still drive the majority of forced futures activity across the market.
Spot ETF Demand Absorbed The Rally
U.S. spot ETF flows provided the strongest evidence that the price move was supported outside the perpetual-futures market.
Bitcoin ETFs attracted a net $749.1 million across the five completed sessions from July 15 through July 21. Ether ETFs added another $138.1 million. Combined regulated-wrapper demand reached $887.2 million.
| Trading Date | Bitcoin ETF Flow | Ether ETF Flow | Combined Flow |
|---|---|---|---|
| July 15 | +$107.7M | +$53.9M | +$161.6M |
| July 16 | +$79.1M | -$28.0M | +$51.1M |
| July 17 | +$132.3M | +$36.7M | +$169.0M |
| July 20 | +$226.8M | +$38.0M | +$264.8M |
| July 21 | +$203.2M | +$37.5M | +$240.7M |
| Period Total | +$749.1M | +$138.1M | +$887.2M |
Bitcoin funds recorded five consecutive positive sessions. Ether funds were positive on four of five days, with the July 16 redemption more than offset by subsequent inflows.
This does not prove that ETF buyers caused the entire price move. Crypto trades continuously, while ETF creations and redemptions occur inside the U.S. market structure and can be hedged before final flow data appears.
The combination is nevertheless important:
- BTC and ETH prices increased.
- ETF demand was strongly positive.
- Perpetual funding remained moderate.
- Futures open interest declined during the latest 24-hour period.
Taken together, those conditions are more consistent with a spot-supported rally than a move driven primarily by leveraged longs. That is an inference from the relationship between the datasets, not a direct identification of every buyer.
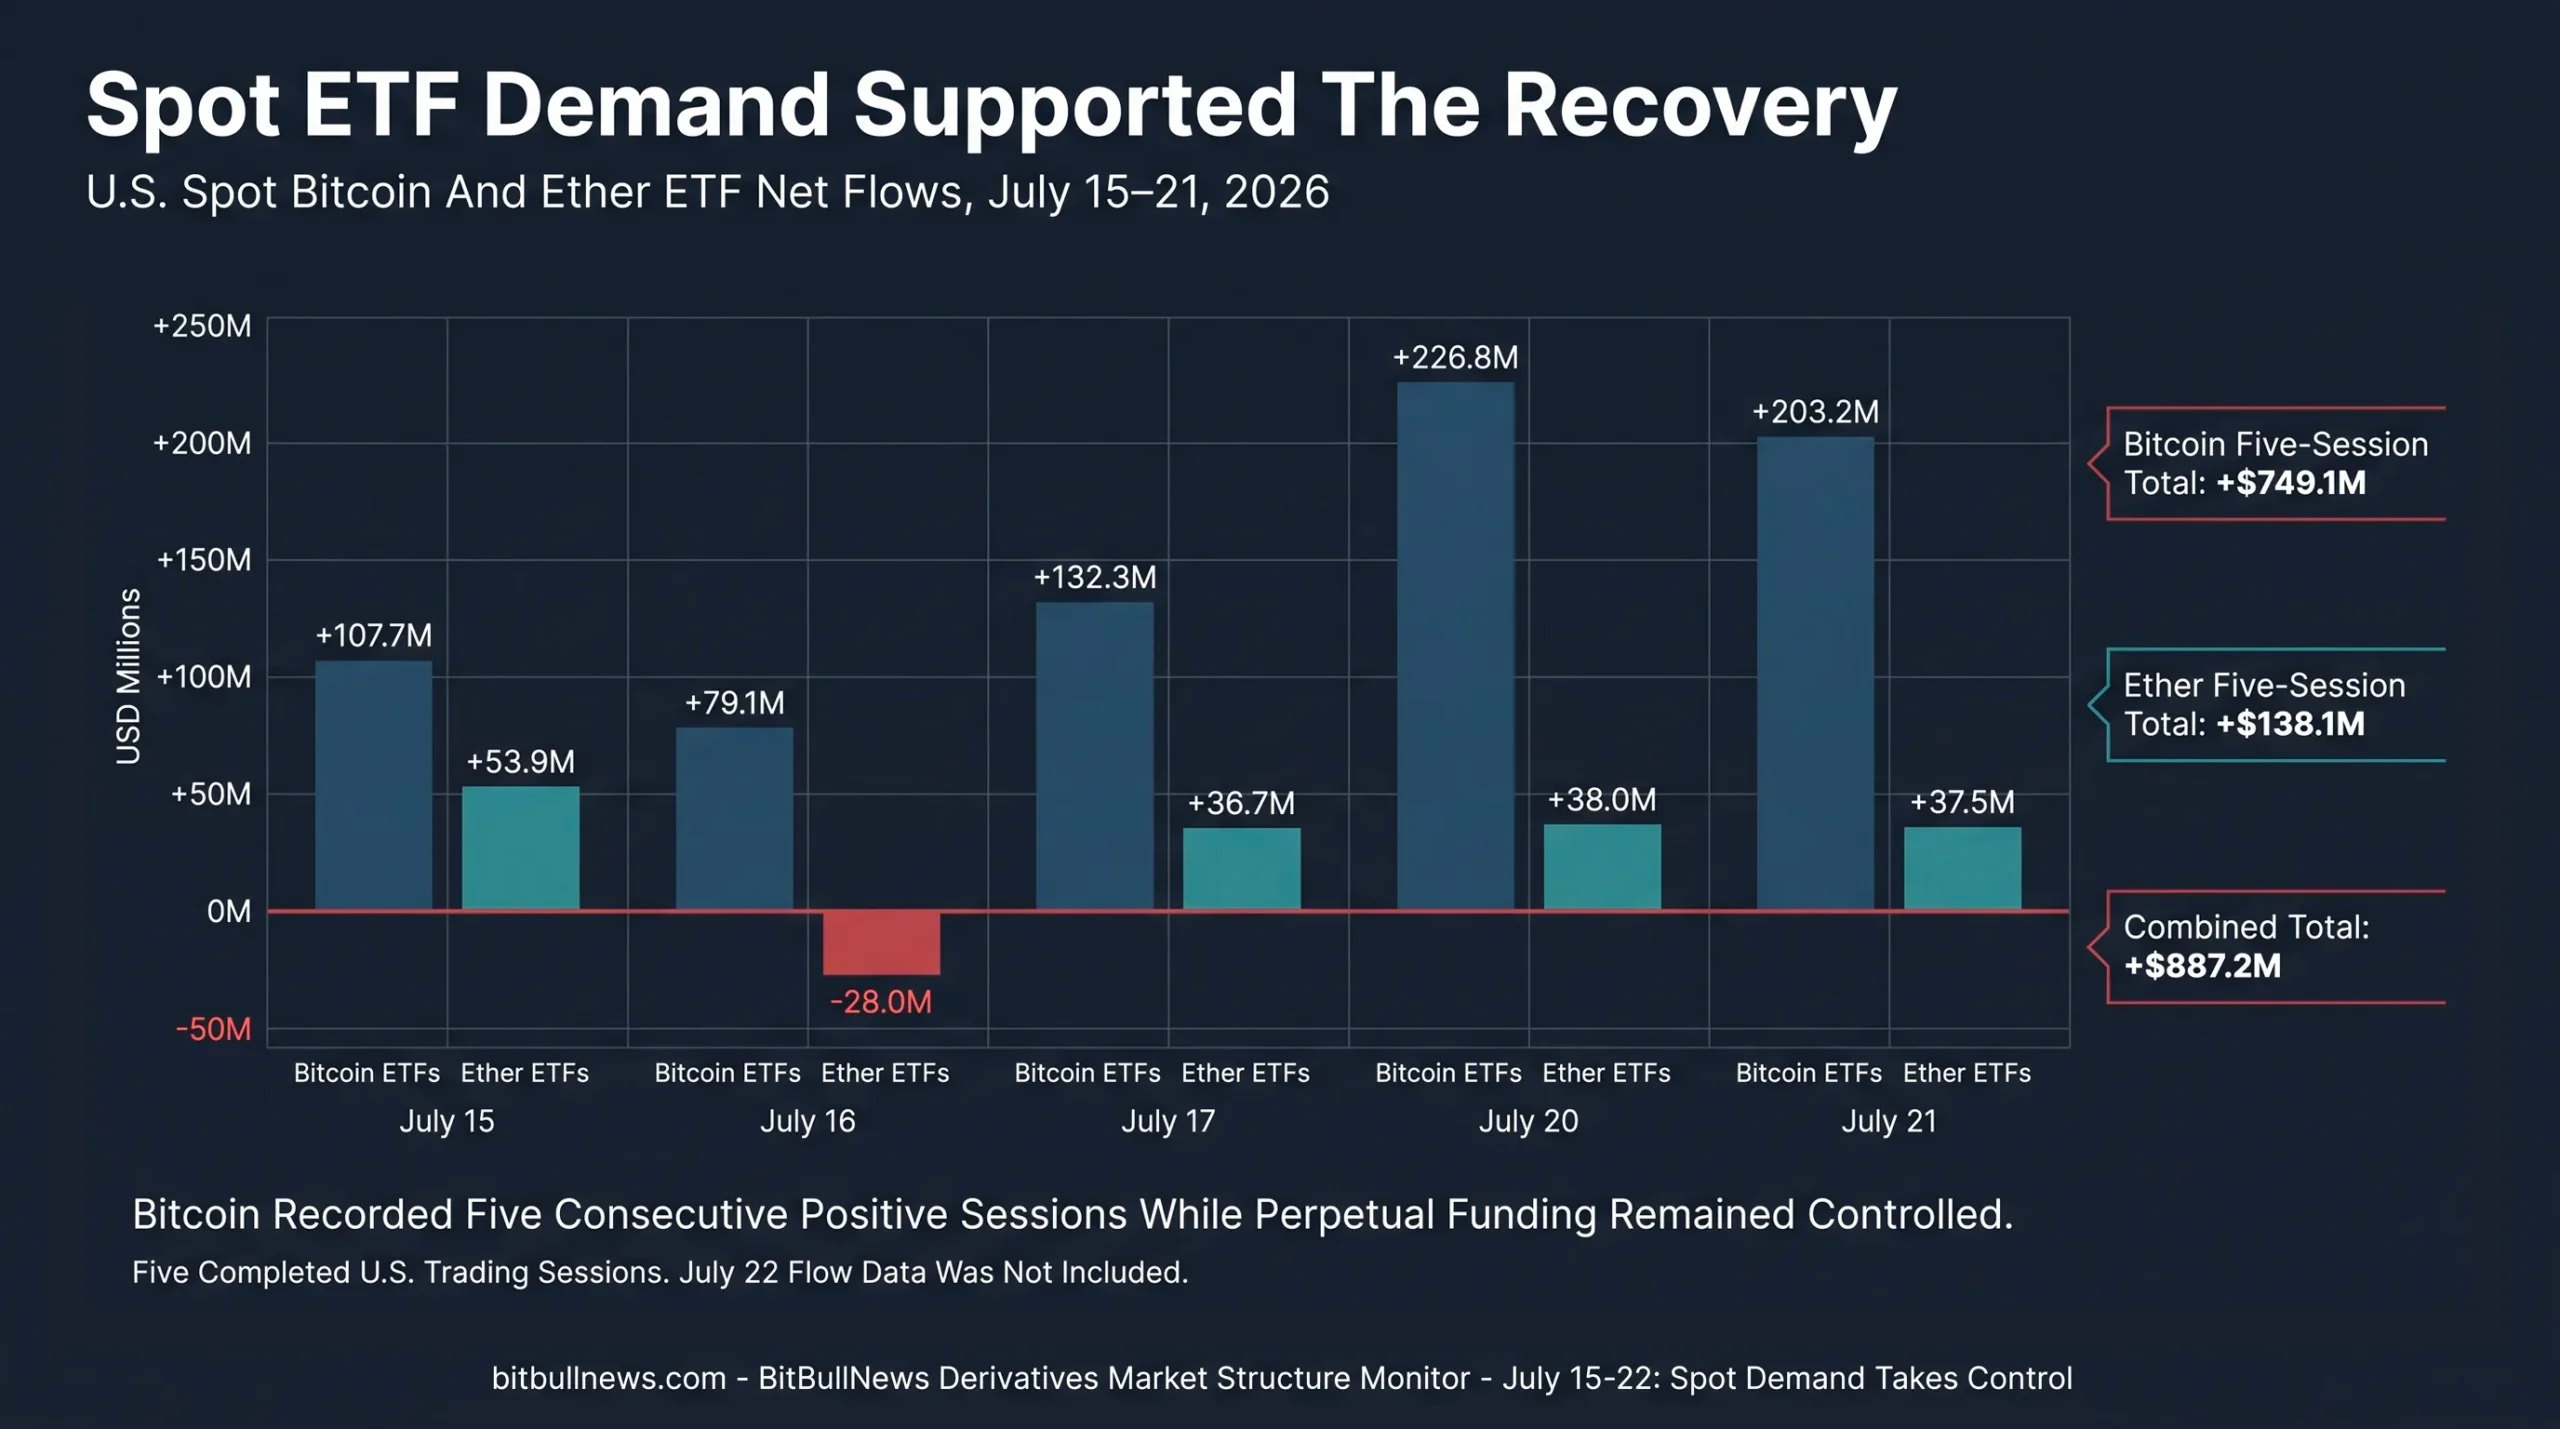
Grouped Daily Bar Chart Showing Bitcoin And Ether ETF Net Flows From July 15 Through July 21. Add Cumulative Callouts Of +$749.1M For BTC, +$138.1M For ETH And +$887.2M Combined.
Bitcoin Regained The Relative Lead
Ether had dominated the previous monitoring period, but that relative-strength advantage narrowed this week.
BTC’s seven-day benchmark return of 2.88% exceeded ETH’s 2.42%. Ether still carried considerably higher realized volatility: 52.49% over three months versus 36.62% for Bitcoin. ETH therefore delivered slightly less return over the period while continuing to expose holders to a substantially wider historical range of outcomes.
The difference was small enough that it should not be framed as a full rotation out of ETH.
Ether remained stronger on a monthly basis. Coin Metrics showed a 10.94% one-month gain for ETH compared with 3.53% for BTC. The weekly result instead suggests that Bitcoin caught up after ETH’s earlier burst of relative performance.
The futures structure also remained more active in ETH relative to its size.
ETH generated $14.8 billion in 24-hour futures volume against $12.3 billion in open interest, producing an open-interest-to-volume ratio of 0.829. Bitcoin recorded $21.1 billion in volume against $21.6 billion in open interest, for a ratio of 1.026. ETH positions therefore turned over more rapidly even after open interest declined.
That supports a balanced conclusion: Bitcoin regained the weekly lead, but Ether remained the more actively traded and more volatile derivatives market relative to its capital base.
CME Funds Added Shorts Into The Recovery
The latest CFTC report covered positions held on July 14 and was released after the start of the monitoring period.
Standard CME Bitcoin futures open interest increased by 553 contracts to 19,385. Standard Ether futures open interest rose by 793 contracts to 22,539.
The trader-category split remained defensive.
| CME Contract | Open Interest | Weekly OI Change | Asset Manager Net | Weekly Net Change | Leveraged Fund Net | Weekly Net Change |
|---|---|---|---|---|---|---|
| Bitcoin Futures | 19,385 | +553 | +2,815 | +430 | -7,491 | -774 |
| Ether Futures | 22,539 | +793 | -1,406 | +703 | -7,961 | -652 |
Net position equals reported long contracts minus reported short contracts. Weekly changes compare July 14 positions with July 7.
Bitcoin asset managers held 4,779 long contracts against 1,964 shorts, leaving them net long by 2,815. Their net position improved by 430 contracts because short exposure fell faster than long exposure.
Leveraged funds moved the other way. Their Bitcoin net short widened from 6,717 contracts to 7,491. They reduced longs by 391 contracts and added 383 shorts, increasing the bearish imbalance by 774.
Ether showed a similar split.
Asset managers remained net short, but the position improved by 703 contracts to -1,406. Leveraged funds increased their net short by 652 contracts to -7,961.
The report predates much of the move toward $66,000, so it cannot show how many shorts were covered after July 14. It does establish the market’s starting position: regulated futures entered the rally with leveraged funds increasing bearish exposure in both assets.
That creates potential fuel for further upside if prices continue rising. It also requires caution. A leveraged-fund short can hedge ETF, spot, options or offshore exposure and should not automatically be treated as an outright directional bet.
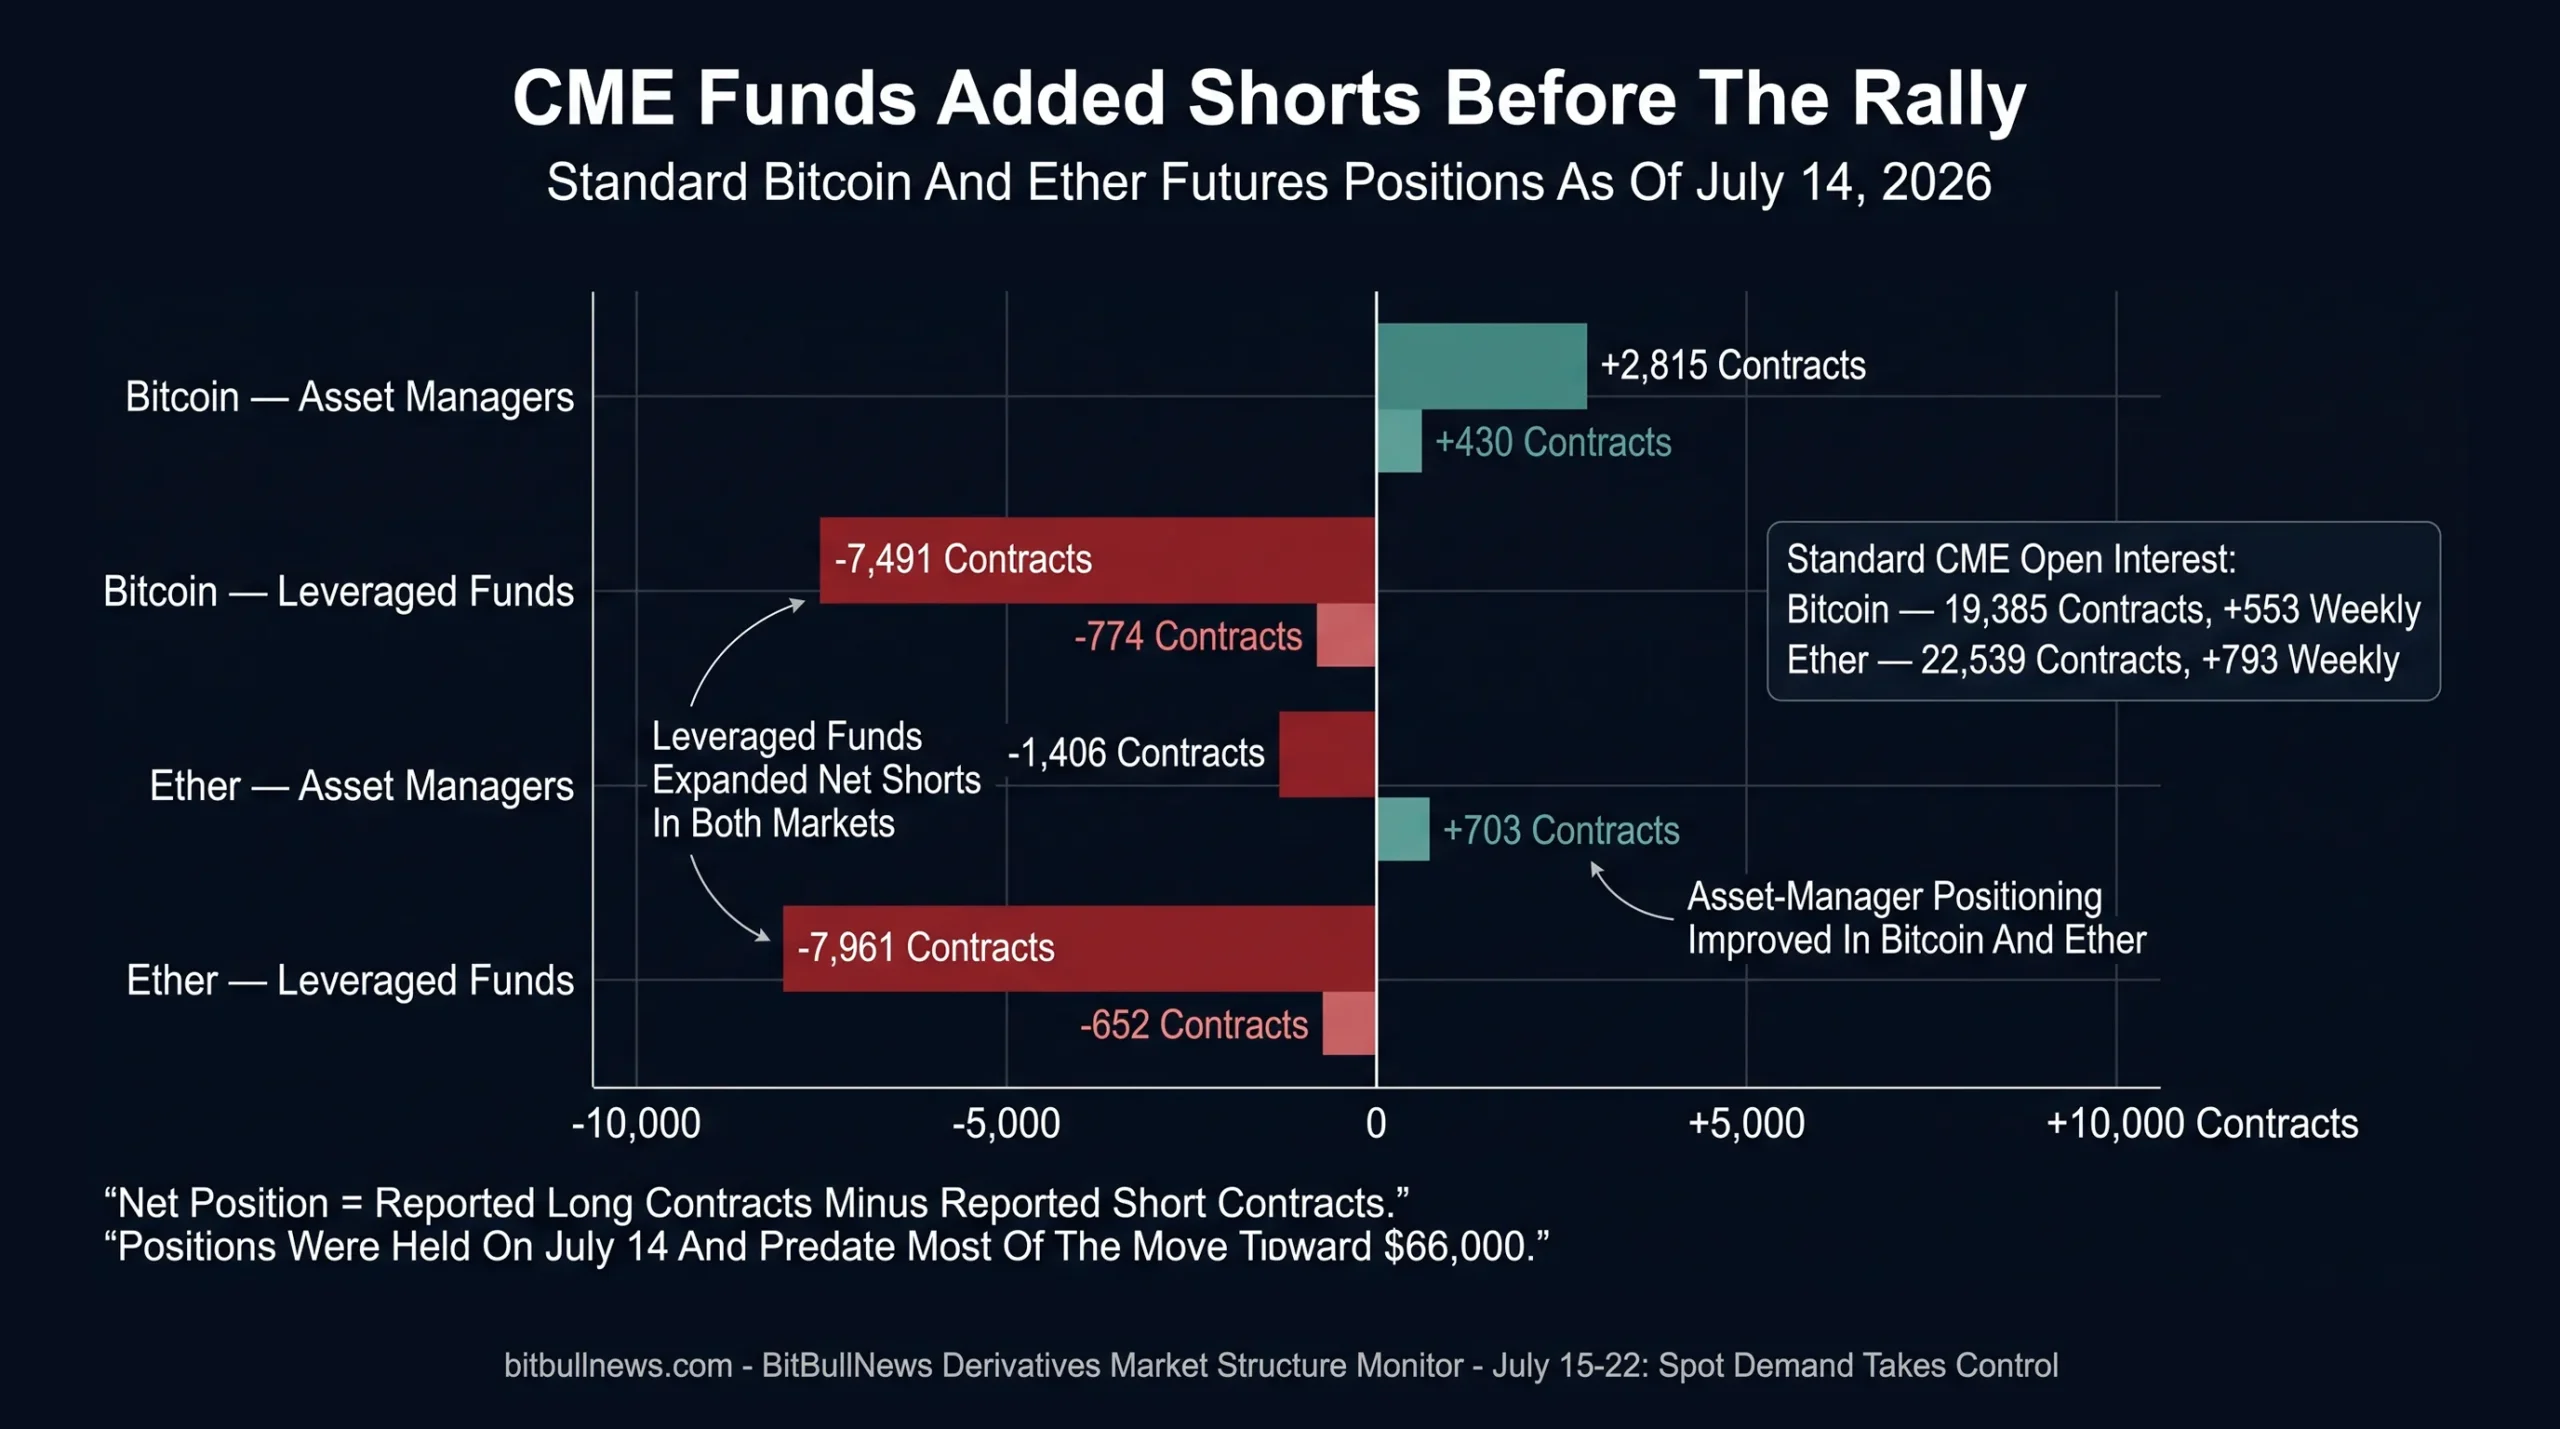
Grouped Horizontal Diverging Bar Chart Showing Net CME Positions For Bitcoin And Ether Asset Managers And Leveraged Funds. Display July 14 Net Positions And Weekly Changes From July 7.
Options Traders Concentrated On Bitcoin Upside
Deribit’s Bitcoin options market carried $28.78 billion in open interest on July 22, compared with $3.26 billion for Ether. BTC therefore represented almost 90% of combined open interest across the two options books.
The Bitcoin book was strongly tilted toward calls.
BTC’s put-to-call open-interest ratio stood at 0.44, while its 24-hour put-to-call volume ratio was only 0.24. Ether’s corresponding ratios were 0.52 and 0.56. Calls outweighed puts in both markets, but the immediate flow imbalance was substantially stronger in Bitcoin.
| Options Metric | Bitcoin | Ether |
|---|---|---|
| Deribit Open Interest | $28.78B | $3.26B |
| 24-Hour Notional Volume | $2.87B | $345.1M |
| 30-Day Implied Volatility | 38.09% | 51.04% |
| Put-To-Call Open Interest | 0.44 | 0.52 |
| Put-To-Call 24-Hour Volume | 0.24 | 0.56 |
| Listed Contracts | 840 | 662 |
| Largest Single Expiry | July 31: $9.65B | December 25: $833.9M |
A low put-to-call ratio does not prove that traders are uniformly bullish. Calls may be sold rather than purchased, and institutional portfolios frequently combine options with futures and spot hedges.
It does show where gross exposure and dealer hedging requirements are concentrated.
Bitcoin’s largest individual contracts included July 31 calls at $70,000 and $72,000, both of which ranked among the market’s largest positions. With the Deribit index near $65,960, those strikes sat close enough to spot to become relevant if the rally continued.
Dealer positioning around those strikes can accelerate price movement in either direction. If dealers are short calls, rising spot prices can force them to buy BTC futures or spot as a hedge. If the positions are customer call sales and dealers are long gamma, hedge activity can instead suppress movement.
Open interest alone cannot identify the direction of dealer exposure.
The July 31 Expiry Dominates Bitcoin Risk
The July 31 Bitcoin expiry carried $9.65 billion in open interest, equal to roughly one-third of the entire Deribit BTC options market.
Calls represented $7.54 billion of that total, while puts accounted for $2.11 billion. The expiry’s put-to-call open-interest ratio was only 0.28.
The next two largest maturities were:
- December 25: $6.15 billion.
- September 25: $6.05 billion.
Together with July 31, those three expiries represented $21.85 billion, or approximately 75.9% of Bitcoin options open interest.
| Bitcoin Expiry | Call Open Interest | Put Open Interest | Total Open Interest | Put/Call OI |
|---|---|---|---|---|
| July 24, 2026 | $634.1M | $502.1M | $1.14B | 0.79 |
| July 31, 2026 | $7.54B | $2.11B | $9.65B | 0.28 |
| August 28, 2026 | $1.71B | $936.2M | $2.64B | 0.55 |
| September 25, 2026 | $3.81B | $2.24B | $6.05B | 0.59 |
| December 25, 2026 | $3.94B | $2.21B | $6.15B | 0.56 |
The July 24 expiry is too small to dominate the entire market, but its $1.14 billion notional can still create short-term hedge adjustments. The much larger risk sits one week later.
A move toward $70,000 before July 31 would bring major call strikes closer to the money and could increase the sensitivity of dealer hedges. A rejection below the current range would reduce the delta of those calls and unwind some related hedge demand.
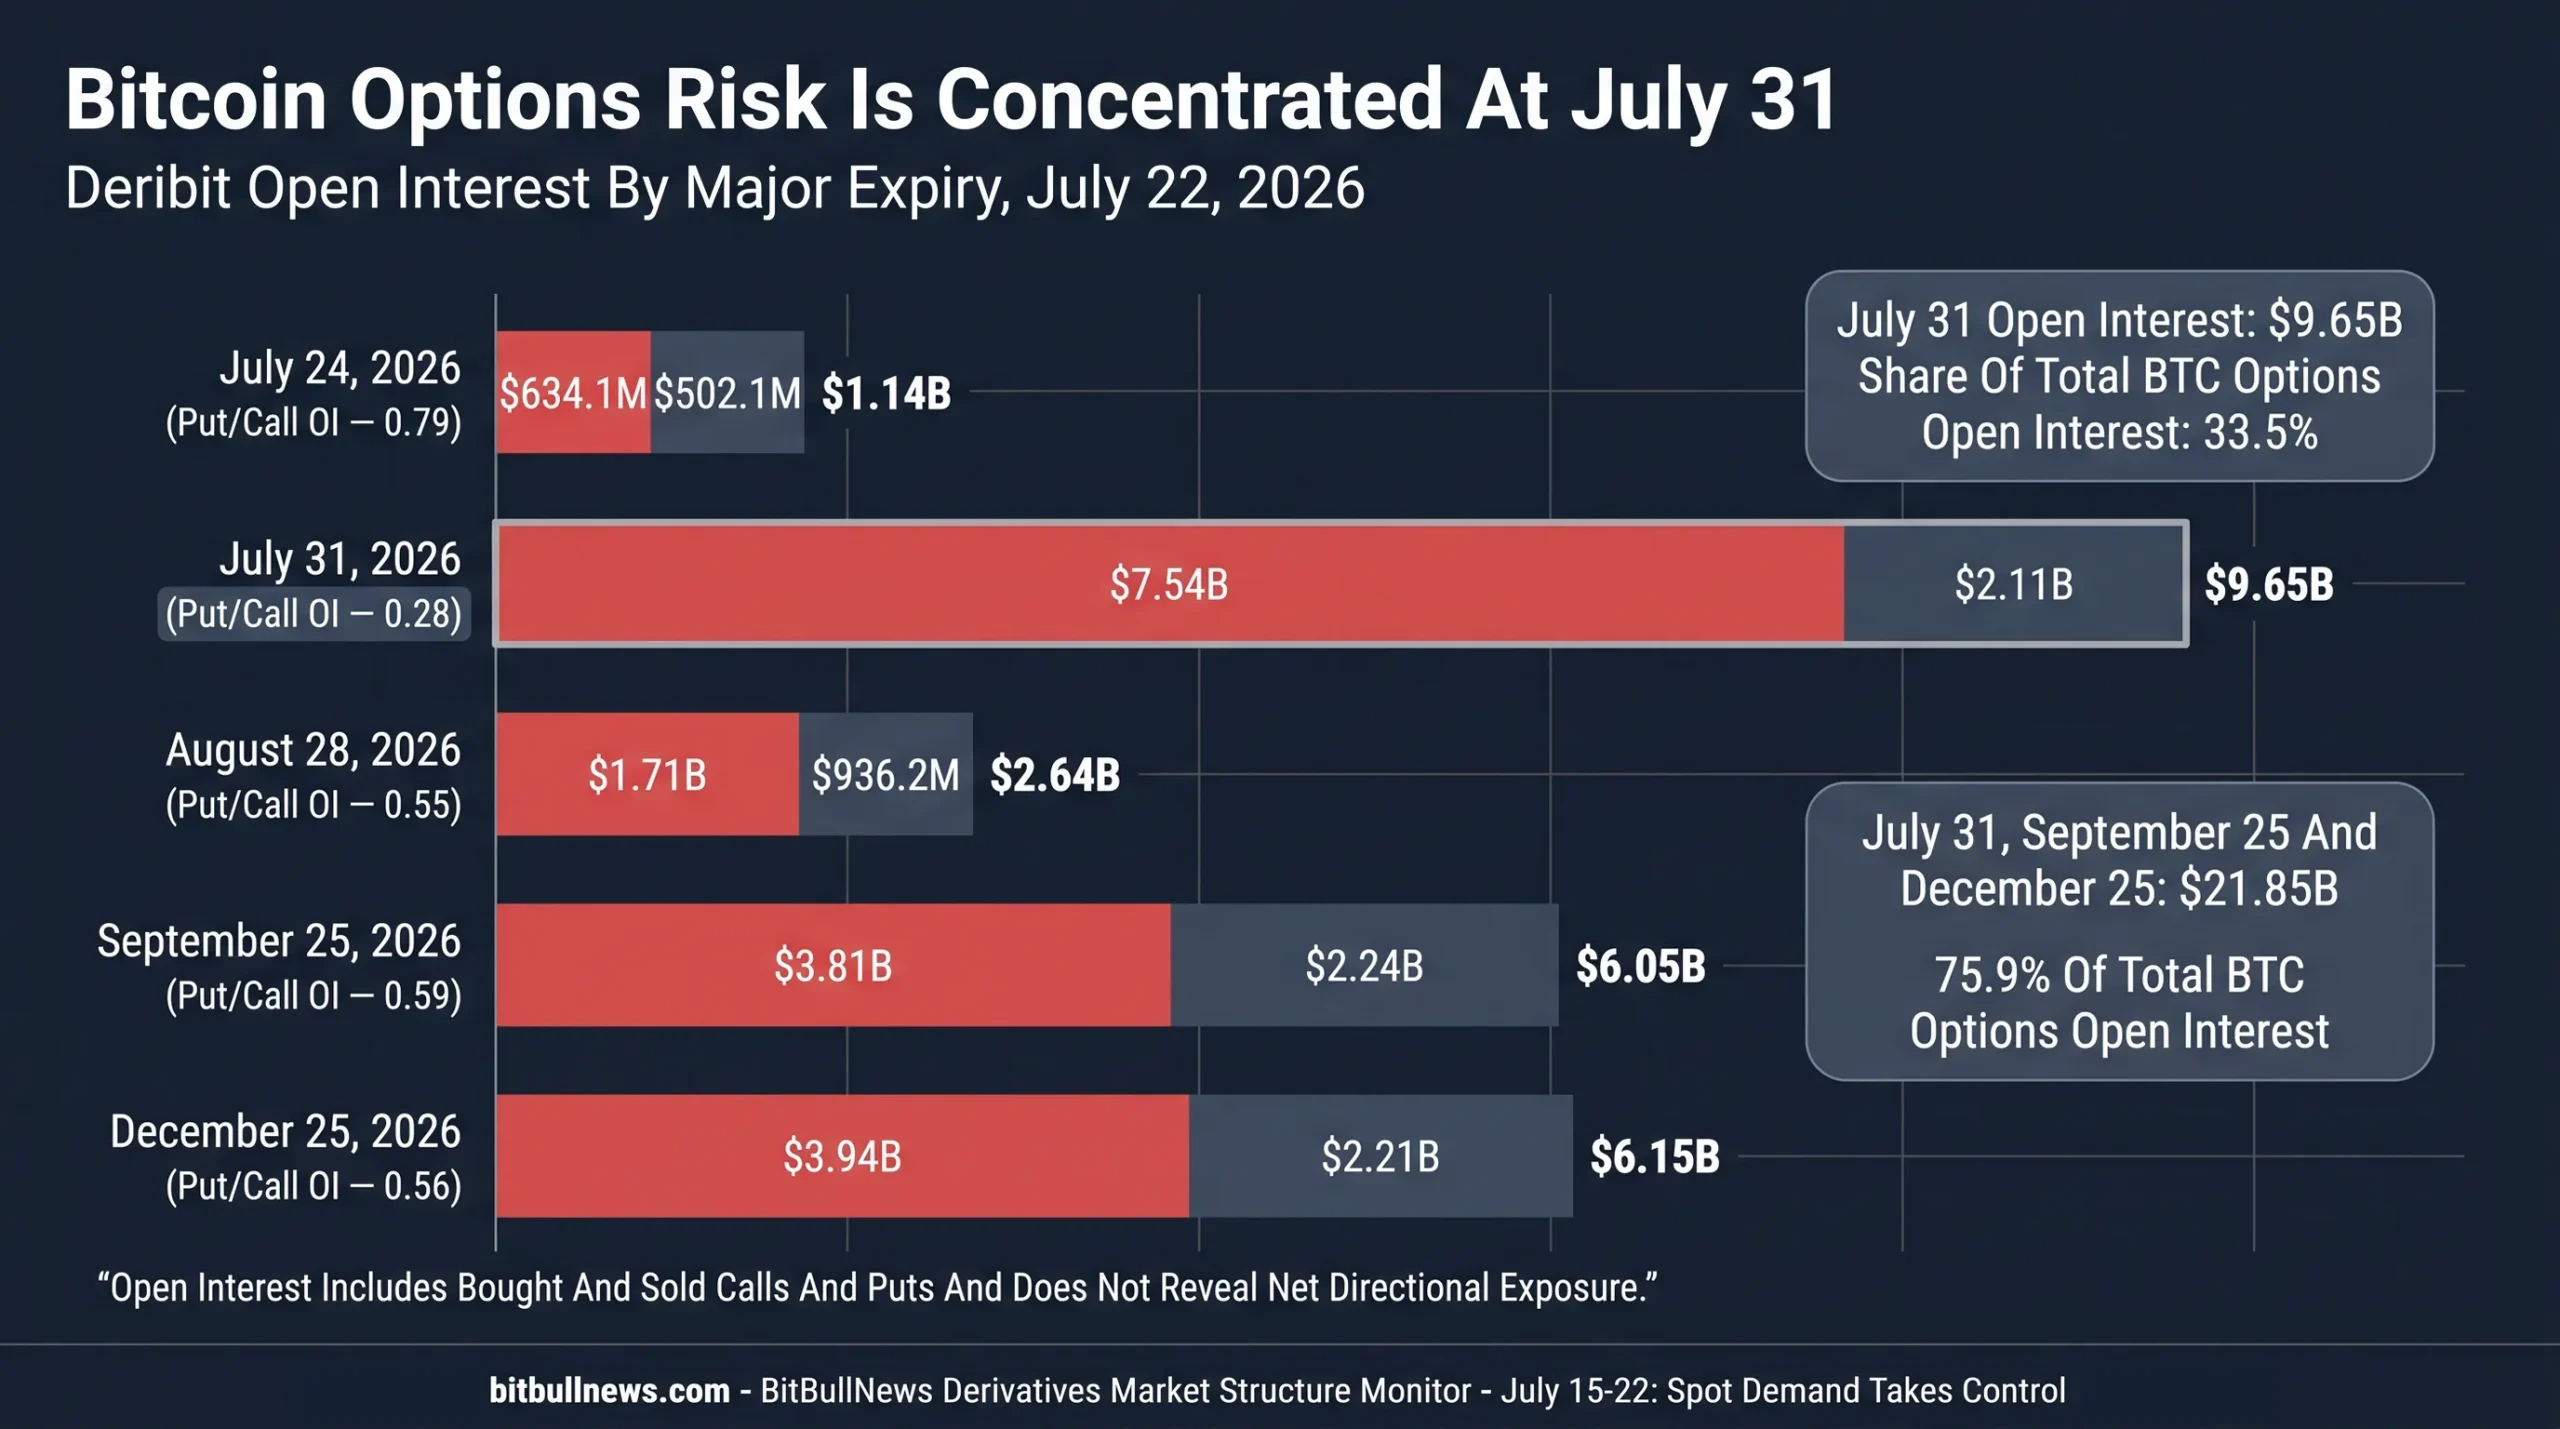
Horizontal Bar Chart Showing Bitcoin Options Open Interest By Expiry. Highlight July 31 At $9.65B And Add A Callout Showing That July 31, September 25 And December 25 Hold 75.9% Of Total BTC Options Open Interest.
Ether’s Near-Term Options Book Was More Defensive
Ether’s overall options structure remained call-heavy, but its nearest meaningful expiry showed a different signal.
The July 24 ETH expiry carried $215.6 million in open interest. Puts accounted for $123.9 million, exceeding the $91.8 million held in calls. Its put-to-call open-interest ratio stood at 1.35.
That was the highest put concentration among ETH’s significant listed expiries.
The July 31 ETH expiry was much more constructive, with $462.4 million in call open interest and $264.3 million in puts. September and December were also strongly call-heavy.
The split suggests investors were buying or retaining more near-term downside protection while maintaining longer-dated upside participation.
That interpretation must remain qualified. Put open interest can reflect put selling, structured products or multi-leg spreads rather than outright bearish demand. The maturity contrast is still useful because it shows that the short end of the ETH book was less relaxed than the aggregate ratio implied.
Implied Volatility Returned Toward Realized Risk
Bitcoin’s Deribit DVOL index stood at 38.09%. Coin Metrics measured its three-month realized volatility at 36.62%. BTC options therefore priced a modest volatility premium of roughly 1.5 percentage points over the recent realized rate.
Ether’s relationship was reversed.
ETH DVOL stood at 51.04%, slightly below its three-month realized volatility of 52.49%.
The comparison is imperfect because 30-day implied volatility and three-month realized volatility cover different horizons. It still shows that neither market was pricing an extreme volatility premium.
Bitcoin options were charging slightly more than the asset had recently delivered. Ether options were pricing approximately the same risk that ETH had already realized.
This leaves the market vulnerable to surprise without making volatility obviously cheap or expensive across the board.
For BTC, the July 31 concentration may justify a modest premium. For ETH, the combination of higher realized volatility and near-term put demand suggests that traders continued to respect downside risk even as spot recovered.
Liquidations Stayed Contained
Coinalyze recorded $34.8 million in 24-hour Bitcoin liquidations and $17.1 million in Ether liquidations in the latest snapshot. Those totals were small relative to the two assets’ outstanding futures positions and daily trading volumes.
The broader market recorded approximately $97.5 million in liquidations across the assets tracked by the platform. BTC and ETH together accounted for slightly more than half.
This was not a disorderly deleveraging event.
The limited liquidation total supports the same conclusion as the open-interest data: leverage was being reduced without a large forced cascade. That lowers immediate systemic pressure but does not remove the risk stored in the options calendar and CME short base.
The next major liquidation event is more likely to come from a break outside the established range than from the current positioning alone.
Bitcoin now faces a dense zone between its current price, the estimated short-term-holder cost area near $68,000 and large options strikes around $70,000–$72,000. A decisive move through that region would force more aggressive position adjustments than the market has seen over the last 24 hours.
What Traders Should Watch Next
Bitcoin Funding Near Resistance
Funding remains constructive without being stretched.
The warning signal would be BTC funding rising rapidly as price approaches $68,000–$70,000. That would indicate that leveraged traders are chasing a breakout at the same time options hedging becomes more sensitive.
July 31 Call Exposure
The $9.65 billion July 31 expiry is the largest immediate derivatives event.
Traders should monitor whether open interest remains concentrated at $70,000 and $72,000, whether positions roll into August and September, and how the call-to-put balance changes as spot approaches those strikes.
Ether’s July 24 Put Concentration
ETH’s nearest significant expiry carries more put than call open interest.
A clean settlement above the short-term protection zone would remove part of that defensive positioning. A renewed drop could force put sellers and dealers to increase downside hedges.
CME Leveraged-Fund Shorts
Leveraged funds expanded net shorts in both standard BTC and ETH futures before the latest price rise.
The next CFTC report will show whether those positions were covered, maintained or increased into strength. Continued short growth alongside rising prices would raise the probability of another squeeze.
ETF Follow-Through
Bitcoin ETFs accumulated $749.1 million over five sessions, while Ether funds added $138.1 million.
If those inflows continue while futures funding stays moderate, the rally would retain a healthier structure. If ETF demand weakens and open interest begins rising rapidly, price would become more dependent on leverage.
Open Interest After The Latest Decline
The 24-hour fall in BTC and ETH open interest was constructive because prices remained firm.
A renewed increase would not automatically be bearish. The question is whether open interest grows alongside spot demand or begins expanding while ETF flows and spot volume fade.
Derivatives Risk Dashboard
| Signal | Current Reading | Interpretation | Risk Trigger |
|---|---|---|---|
| BTC Seven-Day Return | +2.88% | Bitcoin regained the relative lead | Rejection below the recent breakout area |
| ETH Seven-Day Return | +2.42% | Positive, but below BTC | Renewed underperformance with rising leverage |
| BTC Funding | +0.0078% | Positive but not crowded | Rapid increase near $68K–$70K |
| ETH Funding | +0.0030% | Long demand remains restrained | Funding accelerates while spot stalls |
| BTC Open Interest | $21.6B, -1.40% In 24 Hours | Leverage cooled without breaking price | OI surges as ETF demand weakens |
| ETH Open Interest | $12.3B, -2.21% In 24 Hours | Faster short-term deleveraging | New OI builds without spot confirmation |
| BTC ETF Flows | +$749.1M Over Five Sessions | Strong regulated spot demand | Inflows reverse into redemptions |
| ETH ETF Flows | +$138.1M Over Five Sessions | Positive but smaller allocation wave | Demand remains concentrated or turns negative |
| CME Leveraged Funds | Net Short BTC And ETH | Short base can amplify upside | Shorts persist while spot loses support |
| BTC Put/Call OI | 0.44 | Calls dominate the options book | Call exposure becomes crowded near resistance |
| July 31 BTC Expiry | $9.65B | Major hedge concentration | Sharp spot move toward large call strikes |
| ETH July 24 Put/Call OI | 1.35 | Short-term downside protection elevated | ETH breaks lower into expiry |
| BTC Implied Volatility | 38.09% | Slightly above recent realized volatility | Event risk reprices the front end |
| ETH Implied Volatility | 51.04% | Close to recent realized volatility | Volatility expands beyond the current range |
Constructive, Not Comfortable
The derivatives market improved this week because price gains did not require a funding blowout.
Bitcoin and Ether moved higher while futures open interest declined during the latest 24-hour period. Funding stayed positive but controlled. U.S. spot ETFs absorbed a combined $887.2 million over five sessions, giving the rally a stronger source of non-leveraged demand.
Bitcoin regained the relative-performance lead, but Ether remained the higher-volatility and faster-turnover futures market.
The institutional short base did not disappear. Leveraged funds expanded net shorts in both standard CME Bitcoin and Ether futures through July 14. If those positions survived the subsequent rally, they remain potential fuel for another move higher.
Options now carry the more immediate risk.
Bitcoin’s July 31 expiry holds $9.65 billion in open interest and is heavily weighted toward calls. Three maturities control almost 76% of the BTC options market. Ether’s aggregate book is also call-heavy, but its July 24 expiry contains more puts than calls, revealing a more defensive short-term setup.
The current structure is constructive, not comfortable.
A rally supported by ETF inflows and moderate funding can continue without immediately exhausting itself. The danger begins if traders chase the move with rapidly rising open interest just as Bitcoin enters the $68,000–$72,000 options zone.
Spot demand took control this week. The options calendar will determine how orderly the next move becomes.
Data Sources & References
- Coin Metrics CMBI Bitcoin Benchmark
- Coin Metrics CMBI Ethereum Benchmark
- Coinalyze Cryptocurrency Futures Market Data
- Coinalyze Bitcoin Liquidations
- CFTC Traders In Financial Futures Report
- CFTC Commitments Of Traders Reports
- PerpFinder Bitcoin Options Dashboard
- PerpFinder Ethereum Options Dashboard
- PerpFinder Crypto Options Expiry Calendar
- Deribit Bitcoin Options Metrics
- Deribit Bitcoin Volatility Index
- CoinGlass Crypto Options Data
- Farside Investors Bitcoin ETF Flows
- Farside Investors Ethereum ETF Flows
- Implied ETF Carry Rates And The Limits Of Arbitrage