


Content
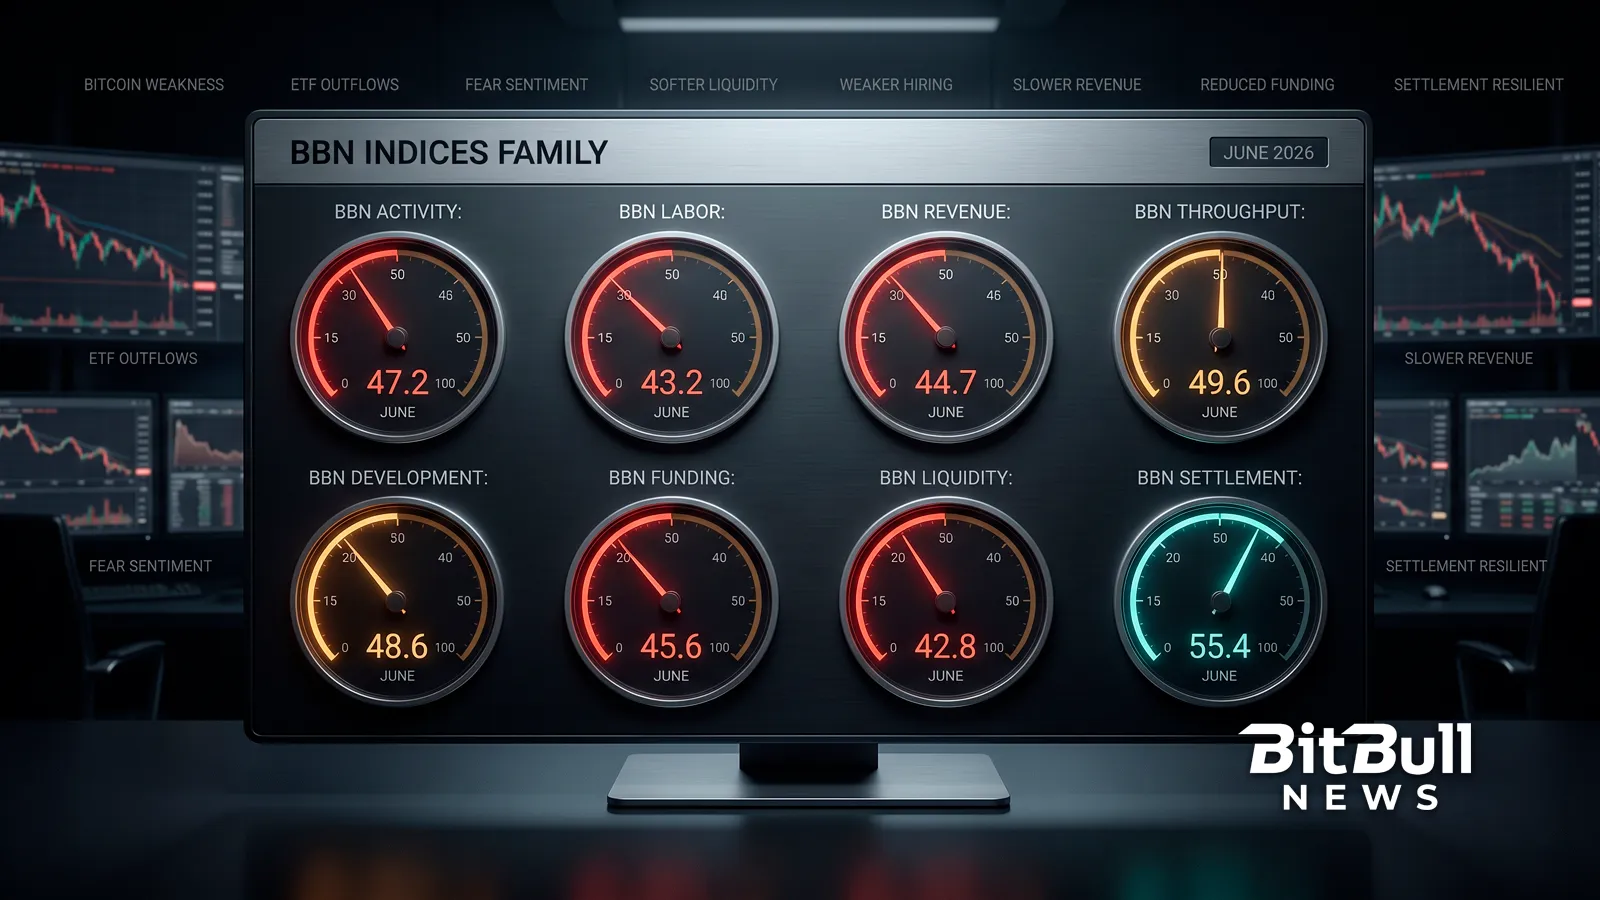
June did not spare much. Bitcoin posted its worst month in four years, roughly $4.5 billion walked out of spot ETFs, and the mood across the market collapsed into Extreme Fear. The BBN Indices, our family of eight monthly diffusion gauges that track the real health of the crypto industry, caught all of it.
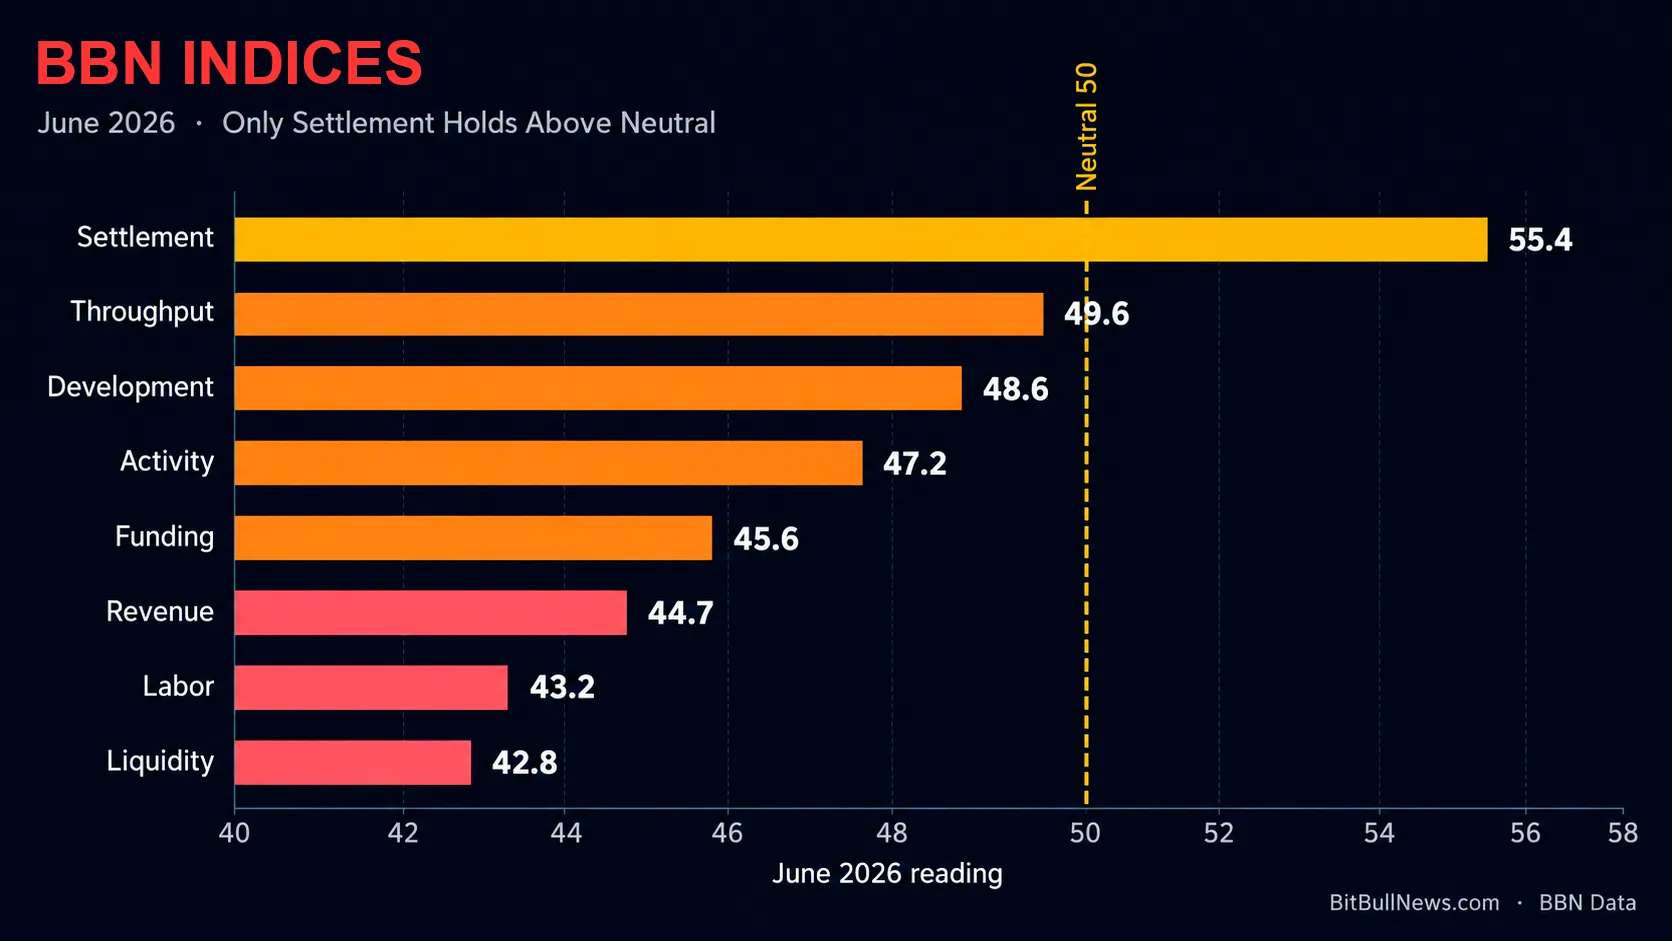
Seven of the eight readings fell versus May. Only Settlement stayed above the neutral 50 mark, and even it gave back ground. The picture is a market that stopped expanding and started contracting across almost every function that matters, from revenue and hiring to liquidity and building.
Below is what moved, why it moved, and why the plumbing kept working while the rest of the industry stalled.
The June Scoreboard
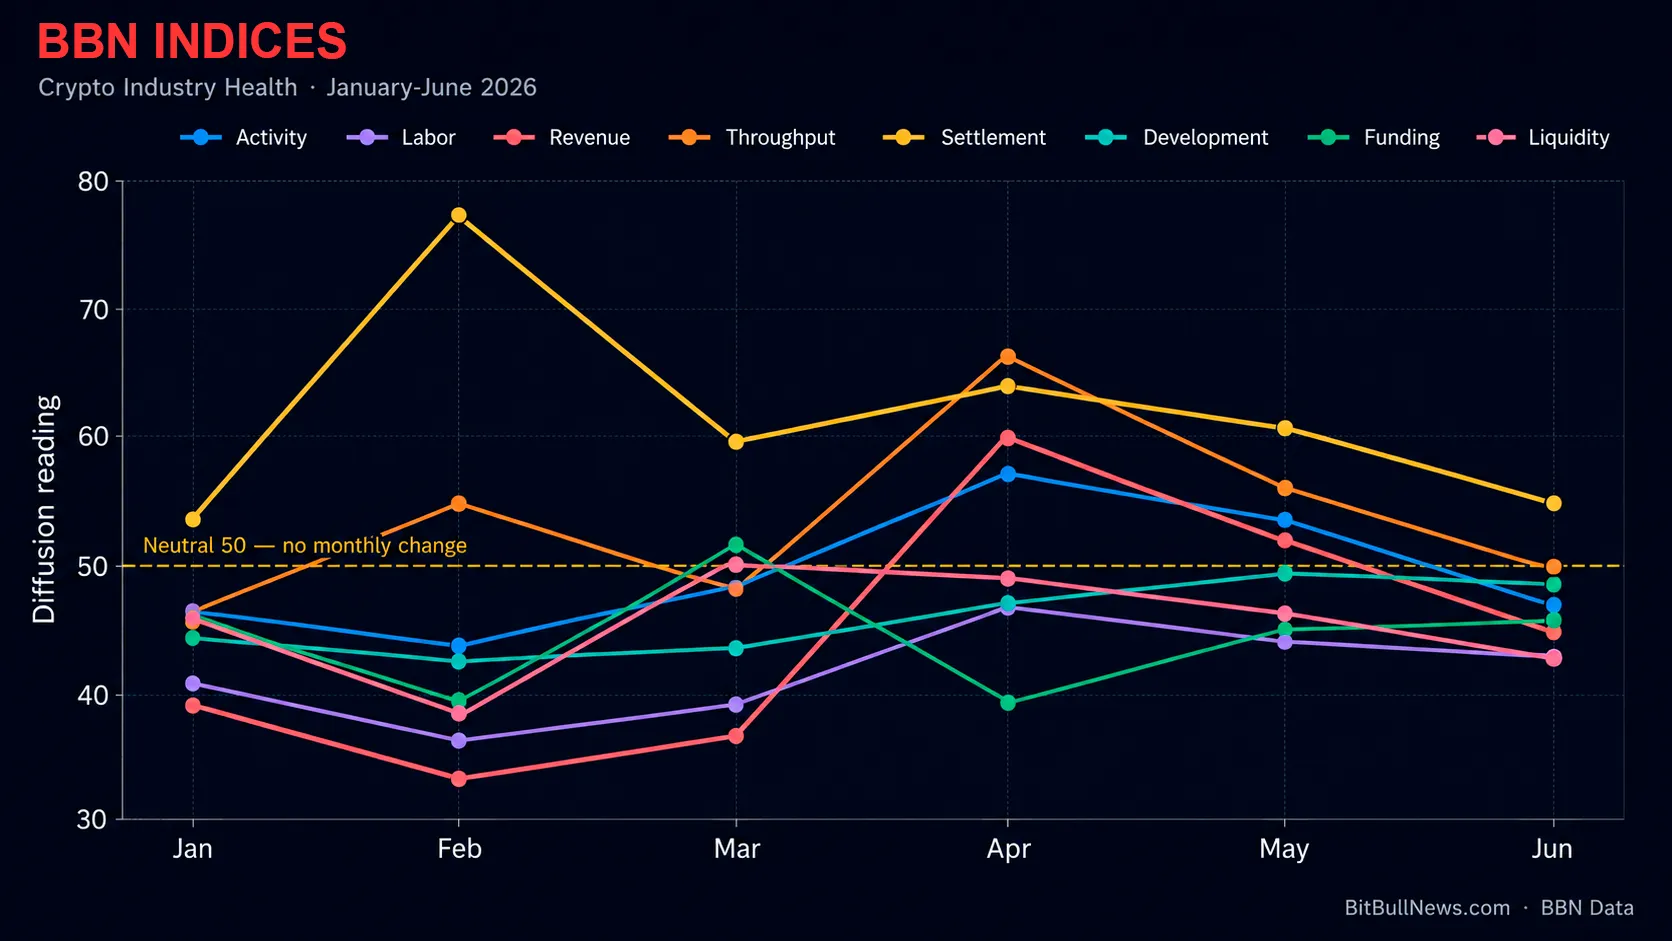
The BBN Indices are built so that 50.0 means no month-on-month change. A reading above 50 signals expansion or improvement across the panel; a reading below 50 signals contraction. That framing makes June easy to read at a glance: the whole board slid toward, or deeper into, contraction.
| BBN Index | May 2026 | June 2026 | Change | vs. Neutral 50 |
|---|---|---|---|---|
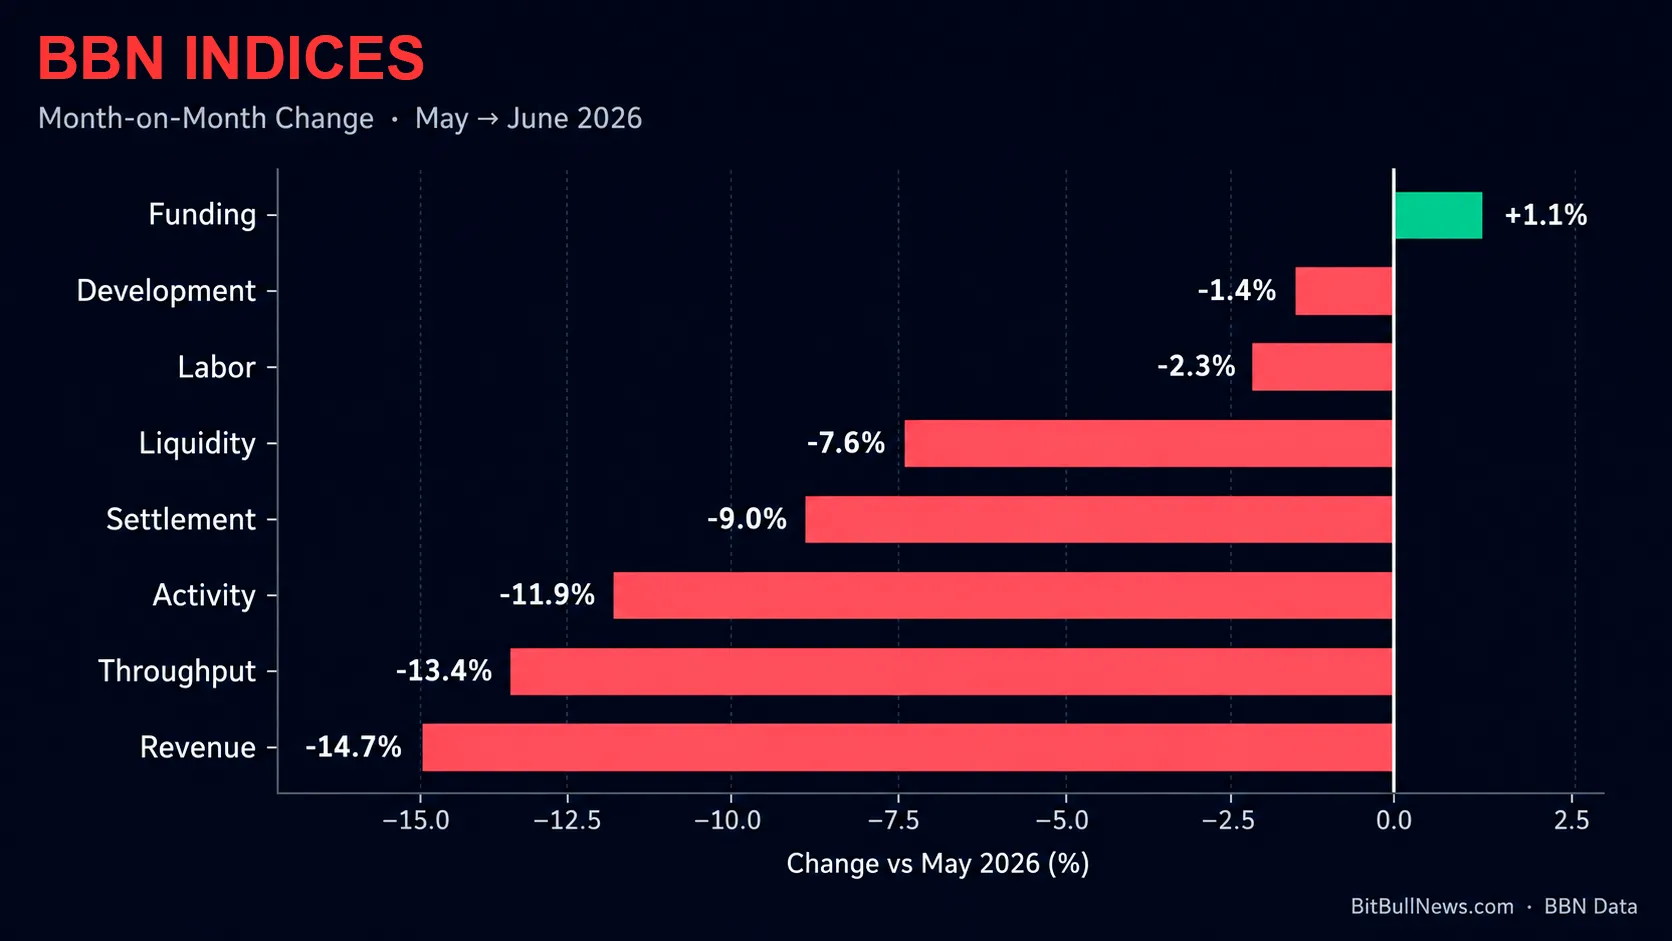
| Settlement | 60.9 | 55.4 | −9.0% | Above |
| Throughput | 57.3 | 49.6 | −13.4% | Below |
| Development | 49.3 | 48.6 | −1.4% | Below |
| Activity | 53.6 | 47.2 | −11.9% | Below |
| Funding | 45.1 | 45.6 | +1.1% | Below |
| Revenue | 52.4 | 44.7 | −14.7% | Below |
| Labor | 44.2 | 43.2 | −2.3% | Below |
| Liquidity | 46.3 | 42.8 | −7.6% | Below |
Two numbers frame the month. Revenue fell the hardest at −14.7%, and Funding was the only gauge to rise, up a marginal +1.1%. Everything in between tells the story of an industry that got repriced along with its native asset.
What Dragged the Indices Down
The proximate cause is not a mystery. Bitcoin fell about 20% in June, closing near $59,000 after opening the month above $71,000, its steepest monthly drop since 2022, as CoinDesk documented. When the benchmark asset loses a fifth of its value, the dollar-denominated health of the businesses built on top of it moves with it.
Money left in size. Spot Bitcoin ETFs bled roughly $4.5 billion in June, their worst month since launch, according to a Santiment recap carried by CryptoPotato. The Fear & Greed Index closed the month at 15 after touching a cycle low of 12, down from 28 in May.
The deeper driver is structural, and it is the same one showing up in every desk note this quarter: capital is rotating out of crypto and into artificial intelligence. Santiment named AI equities as the biggest competitor for investor attention in June, and Consensys founder Joe Lubin put it plainly to CoinDesk, saying crypto is “not front and center right now in terms of capital inflows.”
Macro did the rest. A hawkish tilt from incoming Fed chair Kevin Warsh, sticky inflation, a stronger dollar, and an early-June risk-off tied to U.S.–Iran tensions kept the bid away. The result was an orderly grind lower rather than a single violent crash, which matters for how the eight gauges behaved.
Why Some Indices Sit Below 50 and One Stays Above
This is the part worth slowing down on. The neutral 50 line is not arbitrary. It separates two very different states of the industry, and June split the board cleanly along that line.
The Contraction Cluster
Seven indices measure whether genuine economic activity is expanding or shrinking: business demand, protocol revenue, hiring, capital formation, trading depth, on-chain flow, and code output. In June, most of those shrank month-on-month, so they printed below 50.
Falling prices compressed dollar revenue. Risk-off froze hiring and thinned order books. Deal breadth narrowed. None of that is a survey artifact; it is what a contraction looks like when it lands on a real industry. The readings differ in depth because the shock hit each function with different force, but the direction was shared.
Settlement: The Counter-Cyclical Exception
Settlement is the one gauge that tends to work harder when the market falls apart, and June proved the point again. When leverage unwinds and traders flee to safety, they move value — off exchanges, into stablecoins, across chains, and back again. That is settlement, and stress accelerates it.
The stablecoin base gives the reading its floor. Total stablecoin market cap sat near $314.68 billion on June 21, per CoinLaw’s on-chain aggregation, and USDC’s on-chain transaction volume ran up 263% year-on-year into 2026, as Circle’s numbers show. Regulated rails under the GENIUS Act keep institutional settlement flowing regardless of price. So Settlement fell with the tape, down 9.0%, but stayed the last gauge above neutral at 55.4. The pipes never stopped moving; they just moved fear instead of greed.
Index by Index
Revenue — Down 14.7%
Revenue took the hardest hit, and the mechanism is direct. Protocol fees, exchange take rates, and application income are largely denominated in crypto, so a 20% price drop guts the dollar value even when raw usage holds. Active trading through the sell-off cushioned fee income, but not enough to offset the repricing. Bright spots existed — Hyperliquid’s perpetuals and Pump.fun’s fee machine kept earning — yet the breadth was too narrow to lift the panel.
Throughput — Down 13.4%
Throughput slipped just below neutral to 49.6, and the shape of the month explains why. Early June brought a liquidation cascade that pushed Bitcoin from roughly $67,000 to $59,000 in about 48 hours and cleared more than $3 billion in forced positions, CoinStats data shows. That spiked volume up front. Then leverage got flushed: open interest fell close to 19%, and the back half of June cooled into a low-conviction consolidation. High volume on the way down is not the same as healthy flow, and the gauge reflects that.
Activity — Down 11.9%
Activity measures operating conditions across the business: demand, order pipelines, and staffing posture. All three turned defensive as capital chased AI and sentiment cratered. The month reads as a clean contraction in day-to-day business health, not a panic, but a steady drain of momentum from the April–May recovery.
Settlement — Down 9.0%, Still Leading
Settlement remains the anchor of the board. The counter-cyclical demand described above kept it elevated, though rising USDC concentration and a slower, grind-style decline meant it never spiked the way it did during February’s violent crash, when the same gauge hit 77.1. Elevated, resilient, and clearly ahead of everything else.
Liquidity — Down 7.6%
Liquidity thinned in the classic risk-off pattern. Spreads widened, depth fell, and breadth deteriorated as capital concentrated into Bitcoin and a handful of majors while alts bled — Dogecoin alone dropped more than 9% on the week into month-end. DeFi total value locked fell to about $71.8 billion by mid-June, down roughly 24% over 90 days, CoinLaw reported. Solana and Hyperliquid held pockets of real depth, but the tape was thin where it counted.
Labor — Down 2.3%
Labor barely moved, mostly because it was already depressed. Crypto layoffs continued — BitGo cut 85 roles via an SEC filing on June 26, as Coingabbar noted — but the pace stayed below the March peak and below May’s Coinbase reduction of roughly 700 people. Hiring is frozen and outlooks are weak, yet the reduction pressure did not accelerate, so the gauge only edged down. The H1 hiring data from CoinGecko and Tiger Research confirms a market that is lean, compliance-heavy, and consolidating around stablecoins and infrastructure.
Development — Down 1.4%
Development is the stickiest gauge, and it stayed sticky. Builders keep building through downturns, so the reading held inside its narrow historical band even as sentiment soured. The largest single drag was the Ethereum Foundation, which cut 54 positions — about 20% of staff — and 40% of its budget on June 23, per its own blog and CoinDesk. Core developer counts fell across H1 and the Glamsterdam upgrade slipped to Q3. The offset is that talent dispersed rather than disappeared, with former EF researchers launching the independent Ethlabs the same week.
Funding — Up 1.1%
Funding was the month’s lone gainer, and it is a narrow, lumpy kind of green. A few large infrastructure rounds carried the value component while deal count stayed thin — roughly $355 million into an L1 privacy project and $175 million into a DeFi lending protocol, tracked by crypto-fundraising.info, anchored by tier-one names like a16z, Paradigm, and Apollo. Early-stage capital remained scarce and AI kept pulling attention, but the biggest checks still cleared. Concentration, not breadth, kept Funding barely in the black.
The Macro Mirror: BBN Benchmarks Confirm the Squeeze
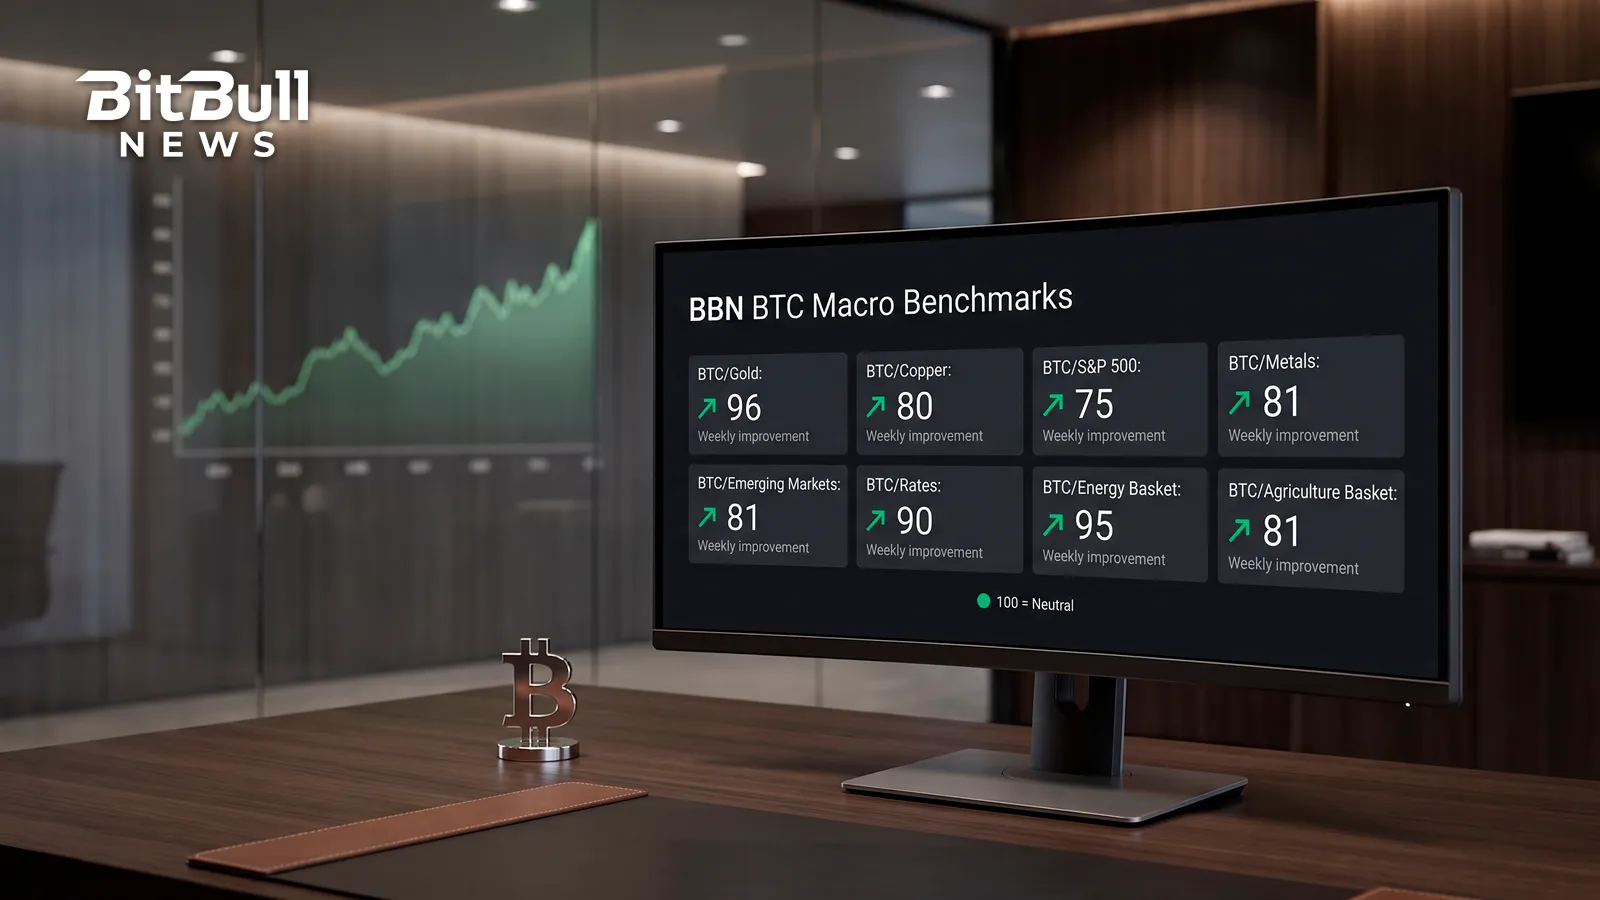
The BBN Indices measure the industry from the inside. The BBN BTC Macro Benchmarks measure Bitcoin from the outside, scoring its performance against eight macro asset classes on a scale centered at 100. In June, they told the same story.
Bitcoin fell below neutral against every single benchmark. The June trough on June 26 shows BTC underperforming the S&P 500 at a reading of just 71, with copper, base metals, emerging markets, and agriculture all clustered in the mid-to-high 70s. Only gold held Bitcoin close to par.
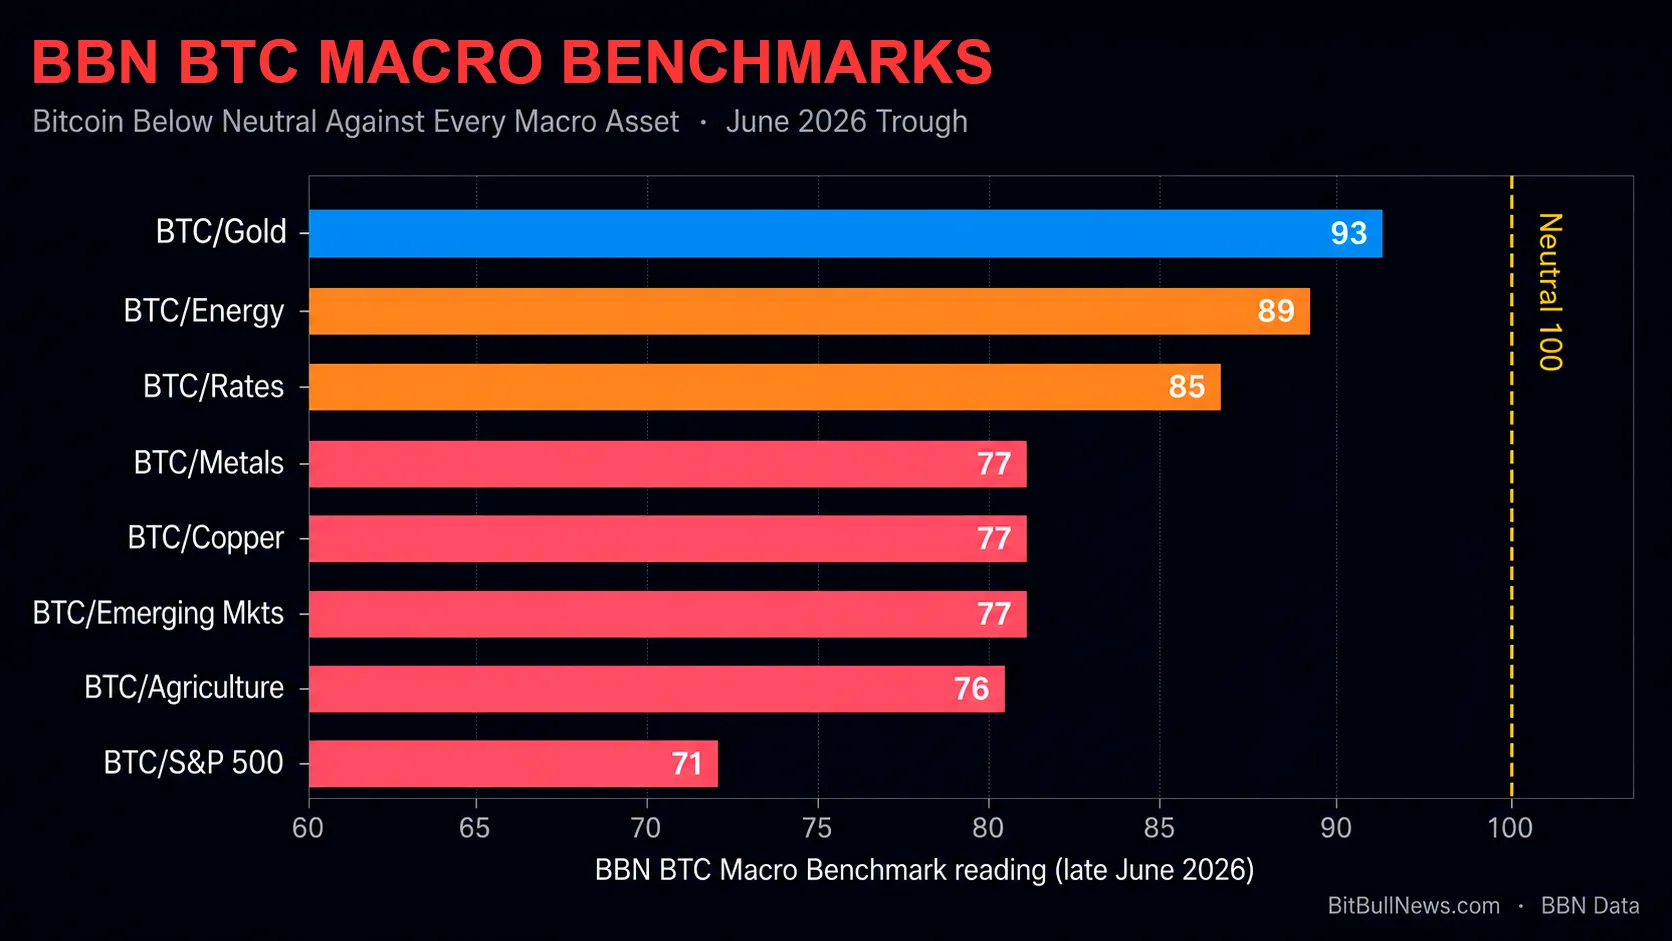
The S&P reading is the tell. As we covered in Bitcoin Beats Every Macro Benchmark This Week, the same AI-driven equity strength that carried stocks to a historic first half is exactly what pulled capital out of crypto. Bitcoin was not losing to fear in June. It was losing to Nvidia. The internal gauges contracted because the external competition won the capital.
What It Means for July and Beyond
June was a cleansing month more than a structural break. Leverage is flushed, weak hands are out, and the counter-cyclical read from Settlement says the core rails are not just intact but busy. That is the setup markets tend to build from, not the setup they die from.
The gauges will not turn until demand turns, and demand will not turn until one of two things happens: the AI capital rotation cools, or crypto delivers a catalyst strong enough to pull money back on its own merits. Watch two dates. The GENIUS Act implementation rules land on July 18, which could firm up the institutional settlement story that is already holding Settlement above 50. And the end-of-July Fed meeting will set the tone for whether risk appetite gets any relief.
For now, the BBN Indices read what the tape read: an industry that stopped growing in June, cut costs, moved value to safety, and waited for a reason to expand again. The plumbing is ready. The demand is not — yet.
FAQ
- What Are The BBN Indices?
The BBN Indices are a family of eight monthly diffusion gauges published by BitBullNews that track the health of the crypto industry across Activity, Labor, Revenue, Throughput, Settlement, Development, Funding, and Liquidity. Each is centered on a neutral reading of 50, where above 50 means expansion and below 50 means contraction. They are designed to show the direction and breadth of change from one month to the next. - Why Did Most BBN Indices Fall In June 2026?
The main driver was a roughly 20% drop in Bitcoin, paired with record ETF outflows and a broad rotation of capital into AI equities. Falling prices compressed dollar revenue, risk-off froze hiring, and liquidity thinned across the market. The decline was orderly rather than a single crash, which is why the contraction was broad but not extreme. - Why Is Settlement The Only Index Above 50?
Settlement tracks the movement of value across exchanges, stablecoins, and chains, and that activity rises during stress. When traders deleverage and flee to safety, settlement flow accelerates even as everything else slows. A stablecoin base near $315 billion and regulated rails under the GENIUS Act kept the reading above neutral at 55.4. - Which BBN Index Fell The Most?
Revenue fell the hardest, down 14.7% month-on-month to 44.7. Most crypto revenue is denominated in crypto, so a sharp price decline cuts the dollar value of fees and take rates even when raw usage holds up. Throughput and Activity followed with double-digit declines. - Did Any BBN Index Rise In June 2026?
Funding was the only gauge to rise, up 1.1% to 45.6. A handful of large infrastructure rounds backed by top-tier investors carried the value component, even as overall deal count stayed thin and early-stage capital remained scarce. The gain reflects concentration at the top rather than a broad recovery. - How Do The BBN Benchmarks Relate To The BBN Indices?
The BBN Indices measure the crypto industry from the inside, while the BBN BTC Macro Benchmarks measure Bitcoin’s performance against eight macro asset classes from the outside. In June, both pointed the same way: Bitcoin fell below its neutral 100 line against every benchmark, and the industry gauges contracted, driven by the same rotation of capital toward AI.
Disclaimer
The BBN Indices and BBN BTC Macro Benchmarks are proprietary analytical series produced by BitBullNews.com. This article is for informational purposes and is not investment advice.