


Content
The stablecoin market is still large, liquid, and institutionally relevant. It is also no longer in a clean expansion phase.

As of June 30, 2026, DefiLlama showed total stablecoin market capitalization at $312.3 billion, down $3.1 billion over seven days and 2.3% over 30 days. USDT remained the dominant asset with 59.1% market share, while USDC held the clear second position at $73.9 billion in market cap.
That short-term contraction matters. Stablecoins are the cash rail of crypto markets. When supply expands, it usually means fresh collateral is entering exchanges, DeFi, payment networks, or treasury workflows. When supply contracts, the signal is more defensive: redemptions, lower leverage appetite, slower exchange funding, or rotation into off-chain cash and tokenized yield instruments.
The bigger picture is more nuanced. Stablecoin Beat’s historical tracker shows the market grew from $229.2 billion in April 2025 to $304.9 billion by June 2026, a gain of 33.1%, even though the latest 90-day reading was slightly negative.
The market is not collapsing. It is consolidating after a long expansion.
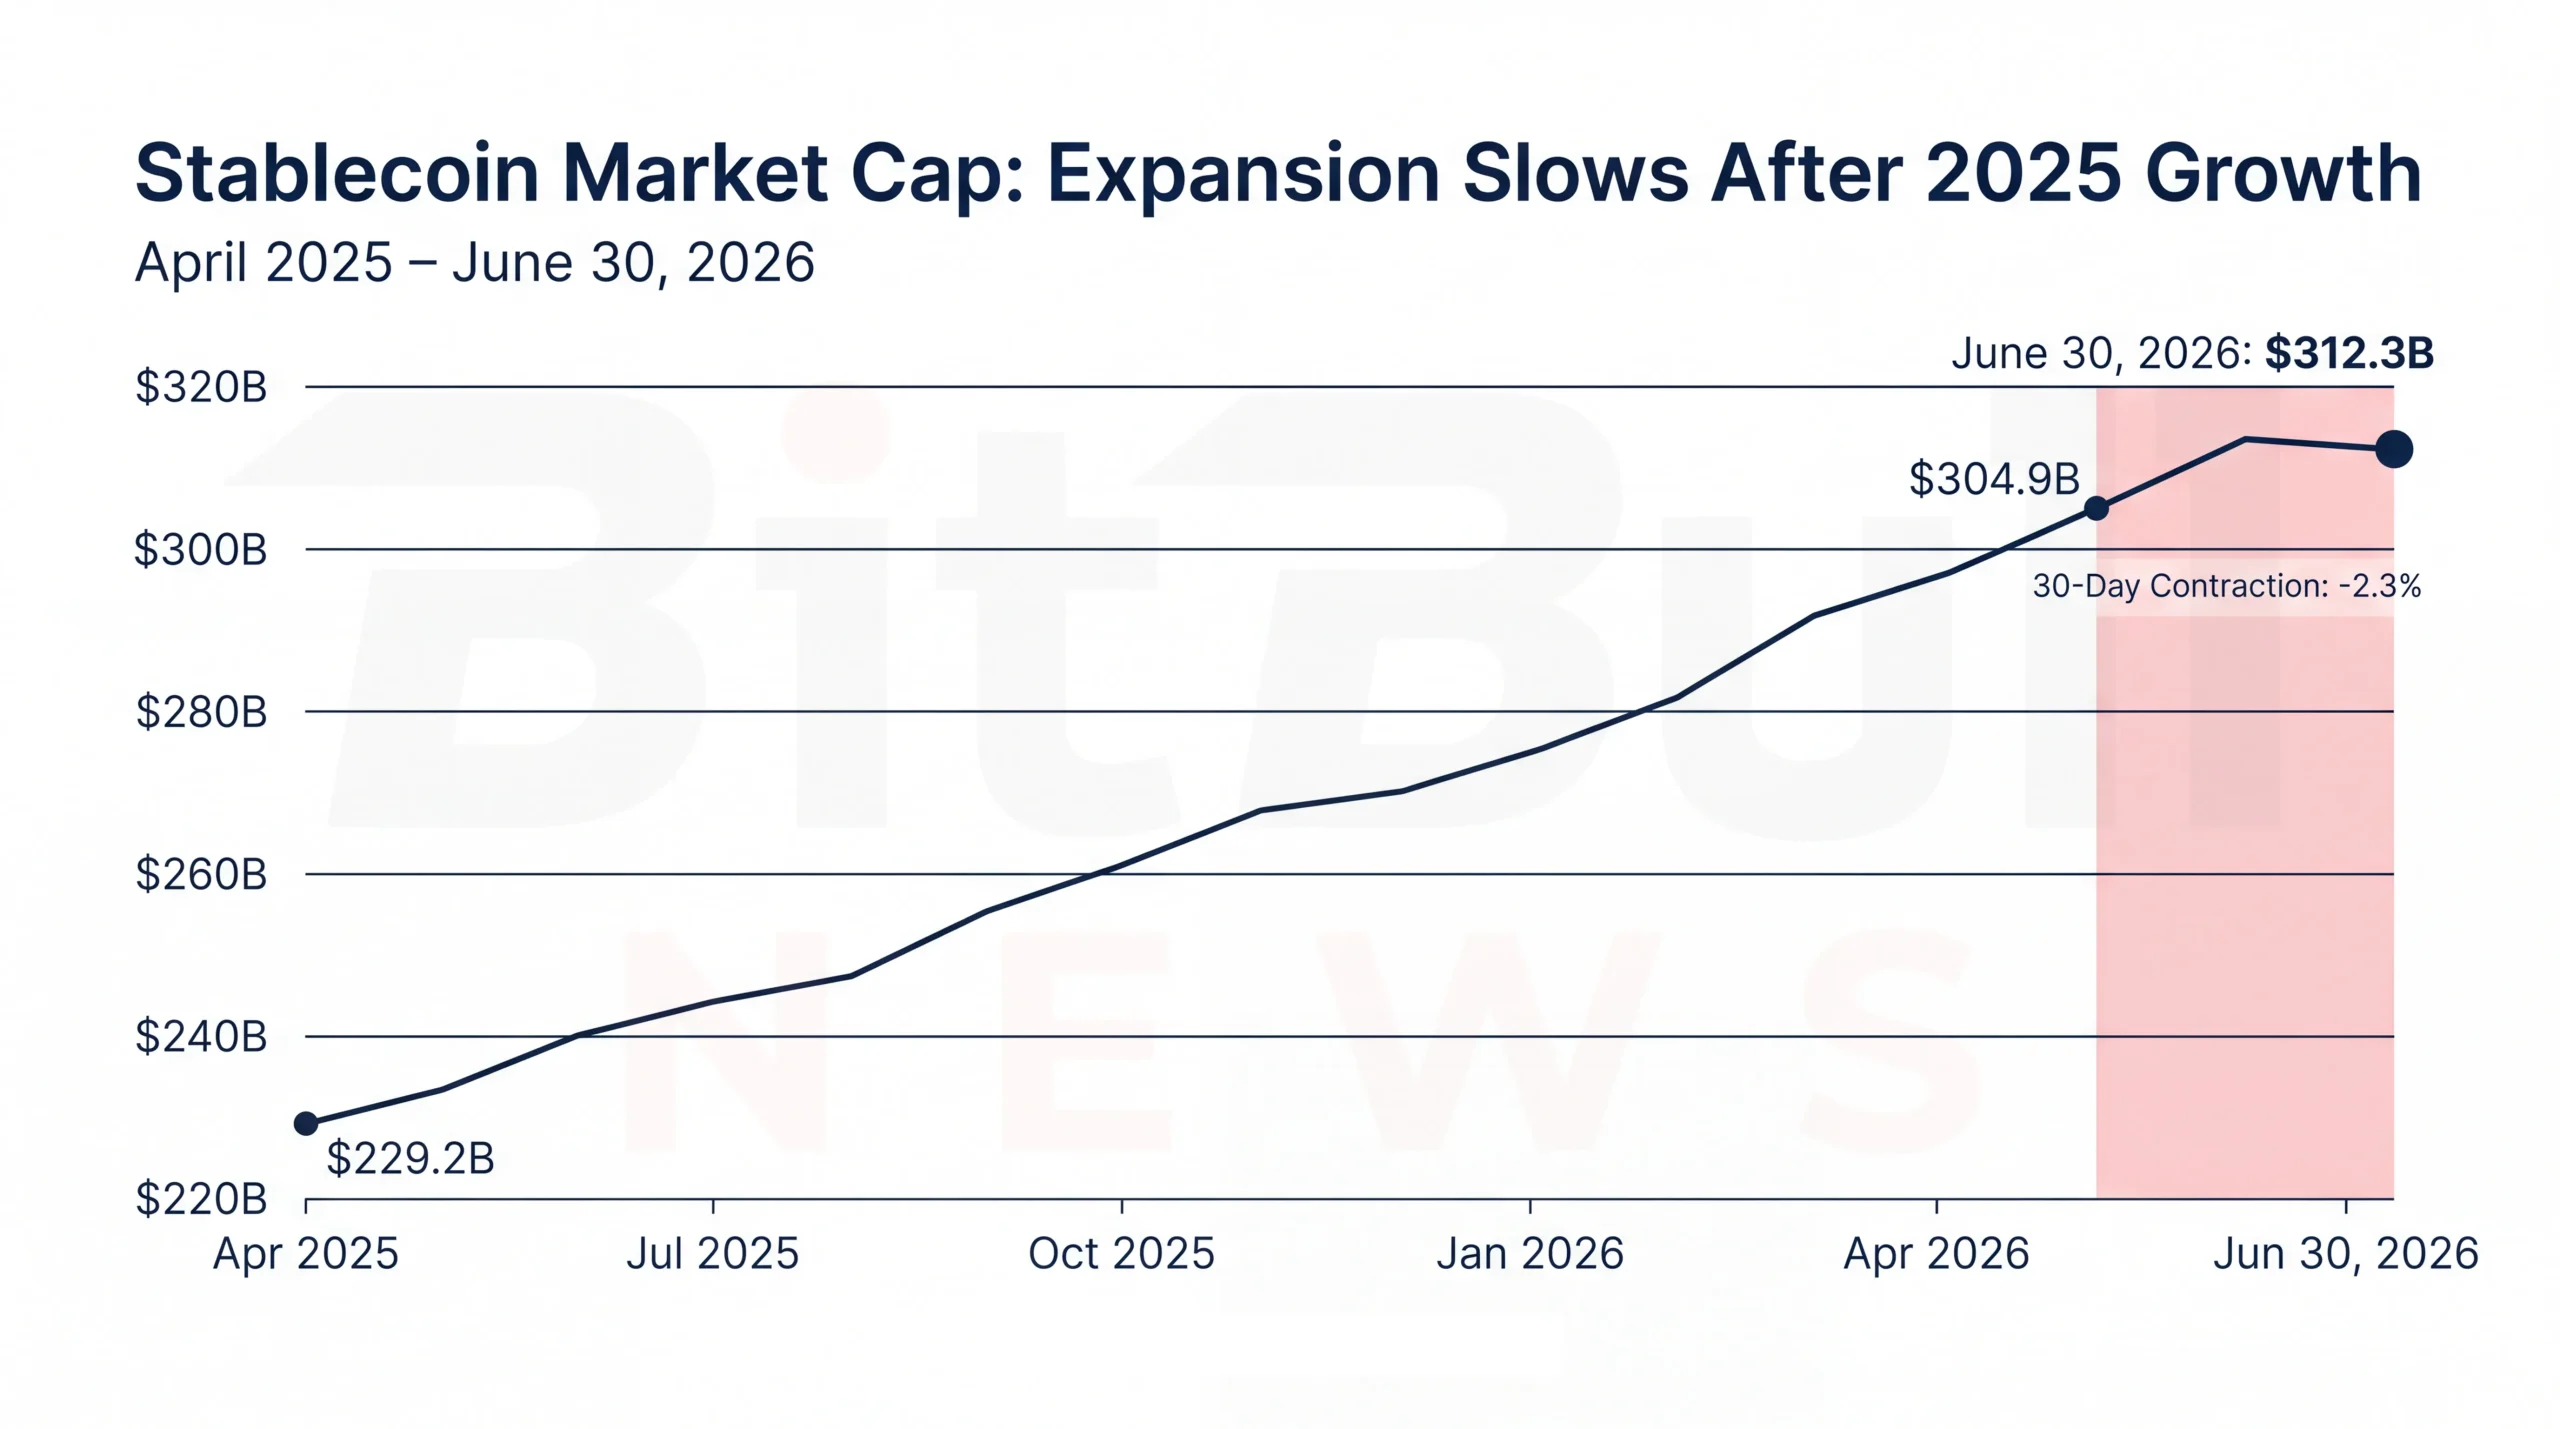
Chart: Line Graph Showing Total Stablecoin Market Cap From April 2025 To June 2026, With A Highlight On The Latest 30-Day Decline And A Marker At The June 2026 Reading
Market Structure Snapshot
DefiLlama and Artemis both show the same broad message: stablecoin supply has softened over the last month, but the asset class remains above the $300 billion mark. Artemis tracked $315.2 billion in stablecoin supply across 138 tokens, down 2.1% over 30 days, which closely matches DefiLlama’s 30-day contraction signal despite a slightly different coverage universe.
| Metric | Latest Reading | Short-Term Change | Market Read |
|---|---|---|---|
| Total Stablecoin Market Cap | $312.3B | -0.98% Over 7D / -2.30% Over 30D | Supply Is Contracting |
| USDT Dominance | 59.13% | N/A | Tether Remains The Liquidity Anchor |
| USDT Market Cap | $184.7B | -0.77% Over 7D / -1.86% Over 30D | Mild Supply Drain |
| USDC Market Cap | $73.9B | -0.88% Over 7D / -2.65% Over 30D | Regulated-Dollar Demand Also Slipped |
| USDS Market Cap | $7.9B | -3.40% Over 7D / -10.41% Over 30D | DeFi-Native Supply Under Pressure |
| DAI Market Cap | $4.8B | -0.60% Over 7D / +5.78% Over 30D | Legacy DeFi Stablecoin Recovered |
DefiLlama data shows that USDT and USDC together account for roughly $258.5 billion, or about 82.8% of the stablecoin market by its latest snapshot. That is the key structural point: liquidity remains heavily concentrated in two issuers, even as smaller stablecoins compete for specialized use cases in DeFi, payments, tokenized funds, and exchange settlement.
Stablecoin Beat’s dominance tracker, using its own CoinGecko-based dataset, put the combined USDT and USDC share at 85.2% and classified the market as highly concentrated, with an HHI score of 4,326 as of June 2026. The exact share varies by provider, but the direction does not: this is a two-issuer market with a long tail.
Weekly Flow By Chain
The chain-level picture is even more concentrated than the issuer-level picture.
DefiLlama’s chain dashboard showed $311.9 billion in stablecoin market cap across networks, with Ethereum alone holding $154.1 billion and Tron holding $89.7 billion. Together, Ethereum and Tron accounted for roughly 78.2% of tracked stablecoin supply.
| Chain | Stablecoin Market Cap | 7D Change | Dominant Stablecoin | Market Interpretation |
|---|---|---|---|---|
| Ethereum | $154.1B | -1.64% | USDT: 51.04% | Main Institutional And DeFi Settlement Layer |
| Tron | $89.7B | +0.07% | USDT: 97.94% | USDT Transfer Rail Remains Sticky |
| Solana | $15.2B | -0.23% | USDC: 48.32% | Payment And Trading Activity Still Meaningful |
| BSC | $13.7B | -0.04% | USDT: 67.02% | Exchange-Linked Retail Liquidity Base |
| Hyperliquid L1 | $5.9B | -7.01% | USDC: 96.20% | Sharp Weekly Drain From Perp-Native Liquidity |
| Base | $4.9B | +0.53% | USDC: 86.01% | USDC-Centric L2 Liquidity Continued To Grow |
| Arbitrum | $3.7B | +0.82% | USDC: 62.54% | Moderate L2 Inflow |
| Polygon | $3.4B | +0.30% | USDC: 54.36% | Stable But Not Leading Growth |
The important split is not just Ethereum versus everything else. It is Ethereum plus Tron versus the rest of crypto.
Ethereum remains the deepest venue for institutional liquidity, DeFi collateral, tokenized cash instruments, and cross-protocol settlement. Tron remains the dominant USDT transfer chain, with nearly all of its stablecoin supply in USDT. That combination gives the market two very different settlement centers: one institutional and composable, one transfer-heavy and USDT-centric.
Base and Arbitrum were small in absolute terms but positive over the week. That matters because these networks are where lower-cost USDC settlement and application-level use can scale without relying on Ethereum mainnet fees. The flows are not yet large enough to challenge Ethereum or Tron, but they are the part of the market where user experience is improving fastest.
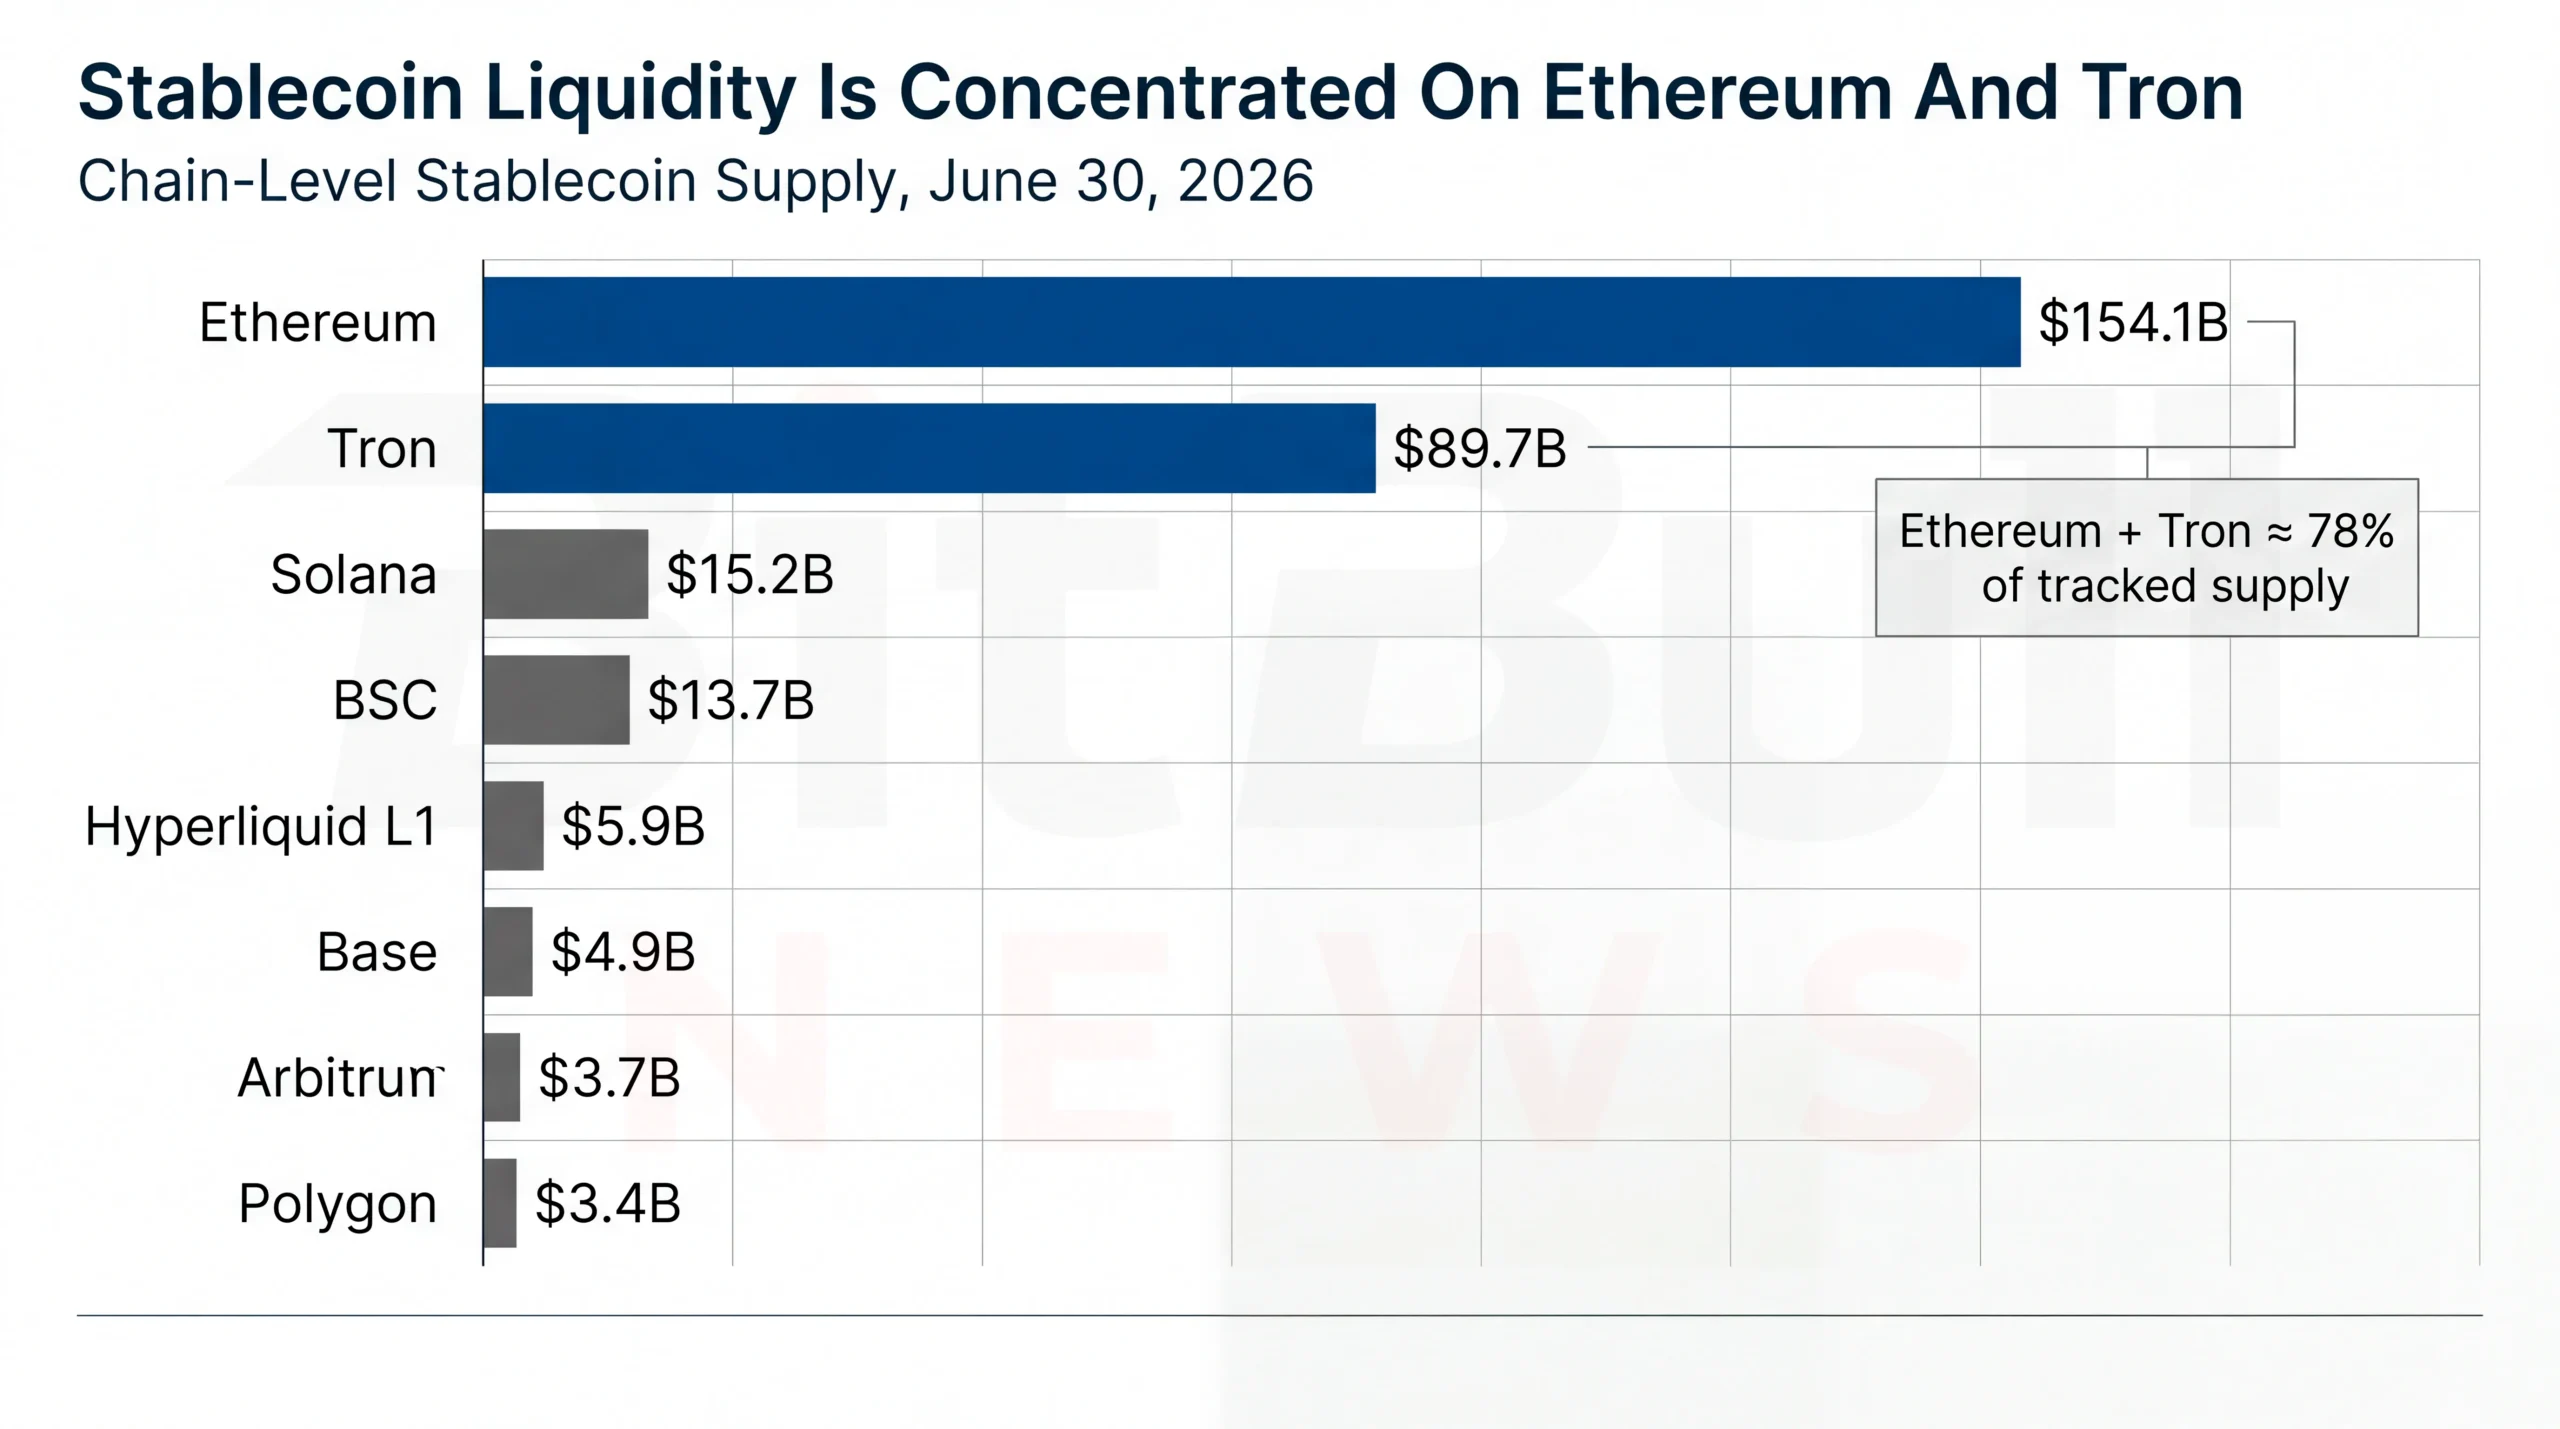
Chart: Horizontal Bar Chart Ranking Stablecoin Supply By Chain, With Ethereum And Tron Highlighted As The Two Dominant Liquidity Centers
Top Stablecoins: What Moved
The top of the table was mostly defensive. USDT and USDC both declined over seven days and 30 days. USDS fell sharply over the month. DAI was the main exception among large DeFi-linked stablecoins, rising 5.78% over 30 days despite a small weekly decline.
| Stablecoin | Market Cap | 7D Change | 30D Change | Read |
|---|---|---|---|---|
| USDT | $184.7B | -0.77% | -1.86% | Still Dominant, But Not Expanding |
| USDC | $73.9B | -0.88% | -2.65% | Institutional Rail, Also In Redemption Mode |
| USDS | $7.9B | -3.40% | -10.41% | Material DeFi-Native Contraction |
| DAI | $4.8B | -0.60% | +5.78% | Monthly Rebound Inside The Sky/Maker Complex |
| USD1 | $4.7B | -3.75% | -1.64% | Large But Losing Momentum |
| USDe | $4.5B | -0.58% | -1.05% | Synthetic-Dollar Demand Softer |
| BUIDL | $3.1B | +1.39% | +2.45% | Tokenized Cash Segment Still Growing |
| USDG | $2.9B | +3.26% | +11.95% | Smaller Issuer Gaining Share |
| PYUSD | $2.7B | -2.38% | -12.01% | Payment-Branded Supply Declined |
| USDY | $2.2B | -0.24% | +0.48% | Yield-Bearing Tokenized Dollar Stable |
The anomaly in this table is not USDT. It is the slow blending of stablecoin data with tokenized cash and yield-bearing instruments. DefiLlama’s stablecoin screen includes assets such as BUIDL, USYC, and USDY, which sit closer to tokenized money-market or yield-bearing structures than classic payment stablecoins.
That distinction is becoming more important. Payment stablecoins are about liquidity, settlement, and redemption at par. Tokenized yield products are about on-chain access to short-duration yield. The market is starting to price both as “digital dollars,” but their legal, liquidity, and holder-rights profiles are not identical.
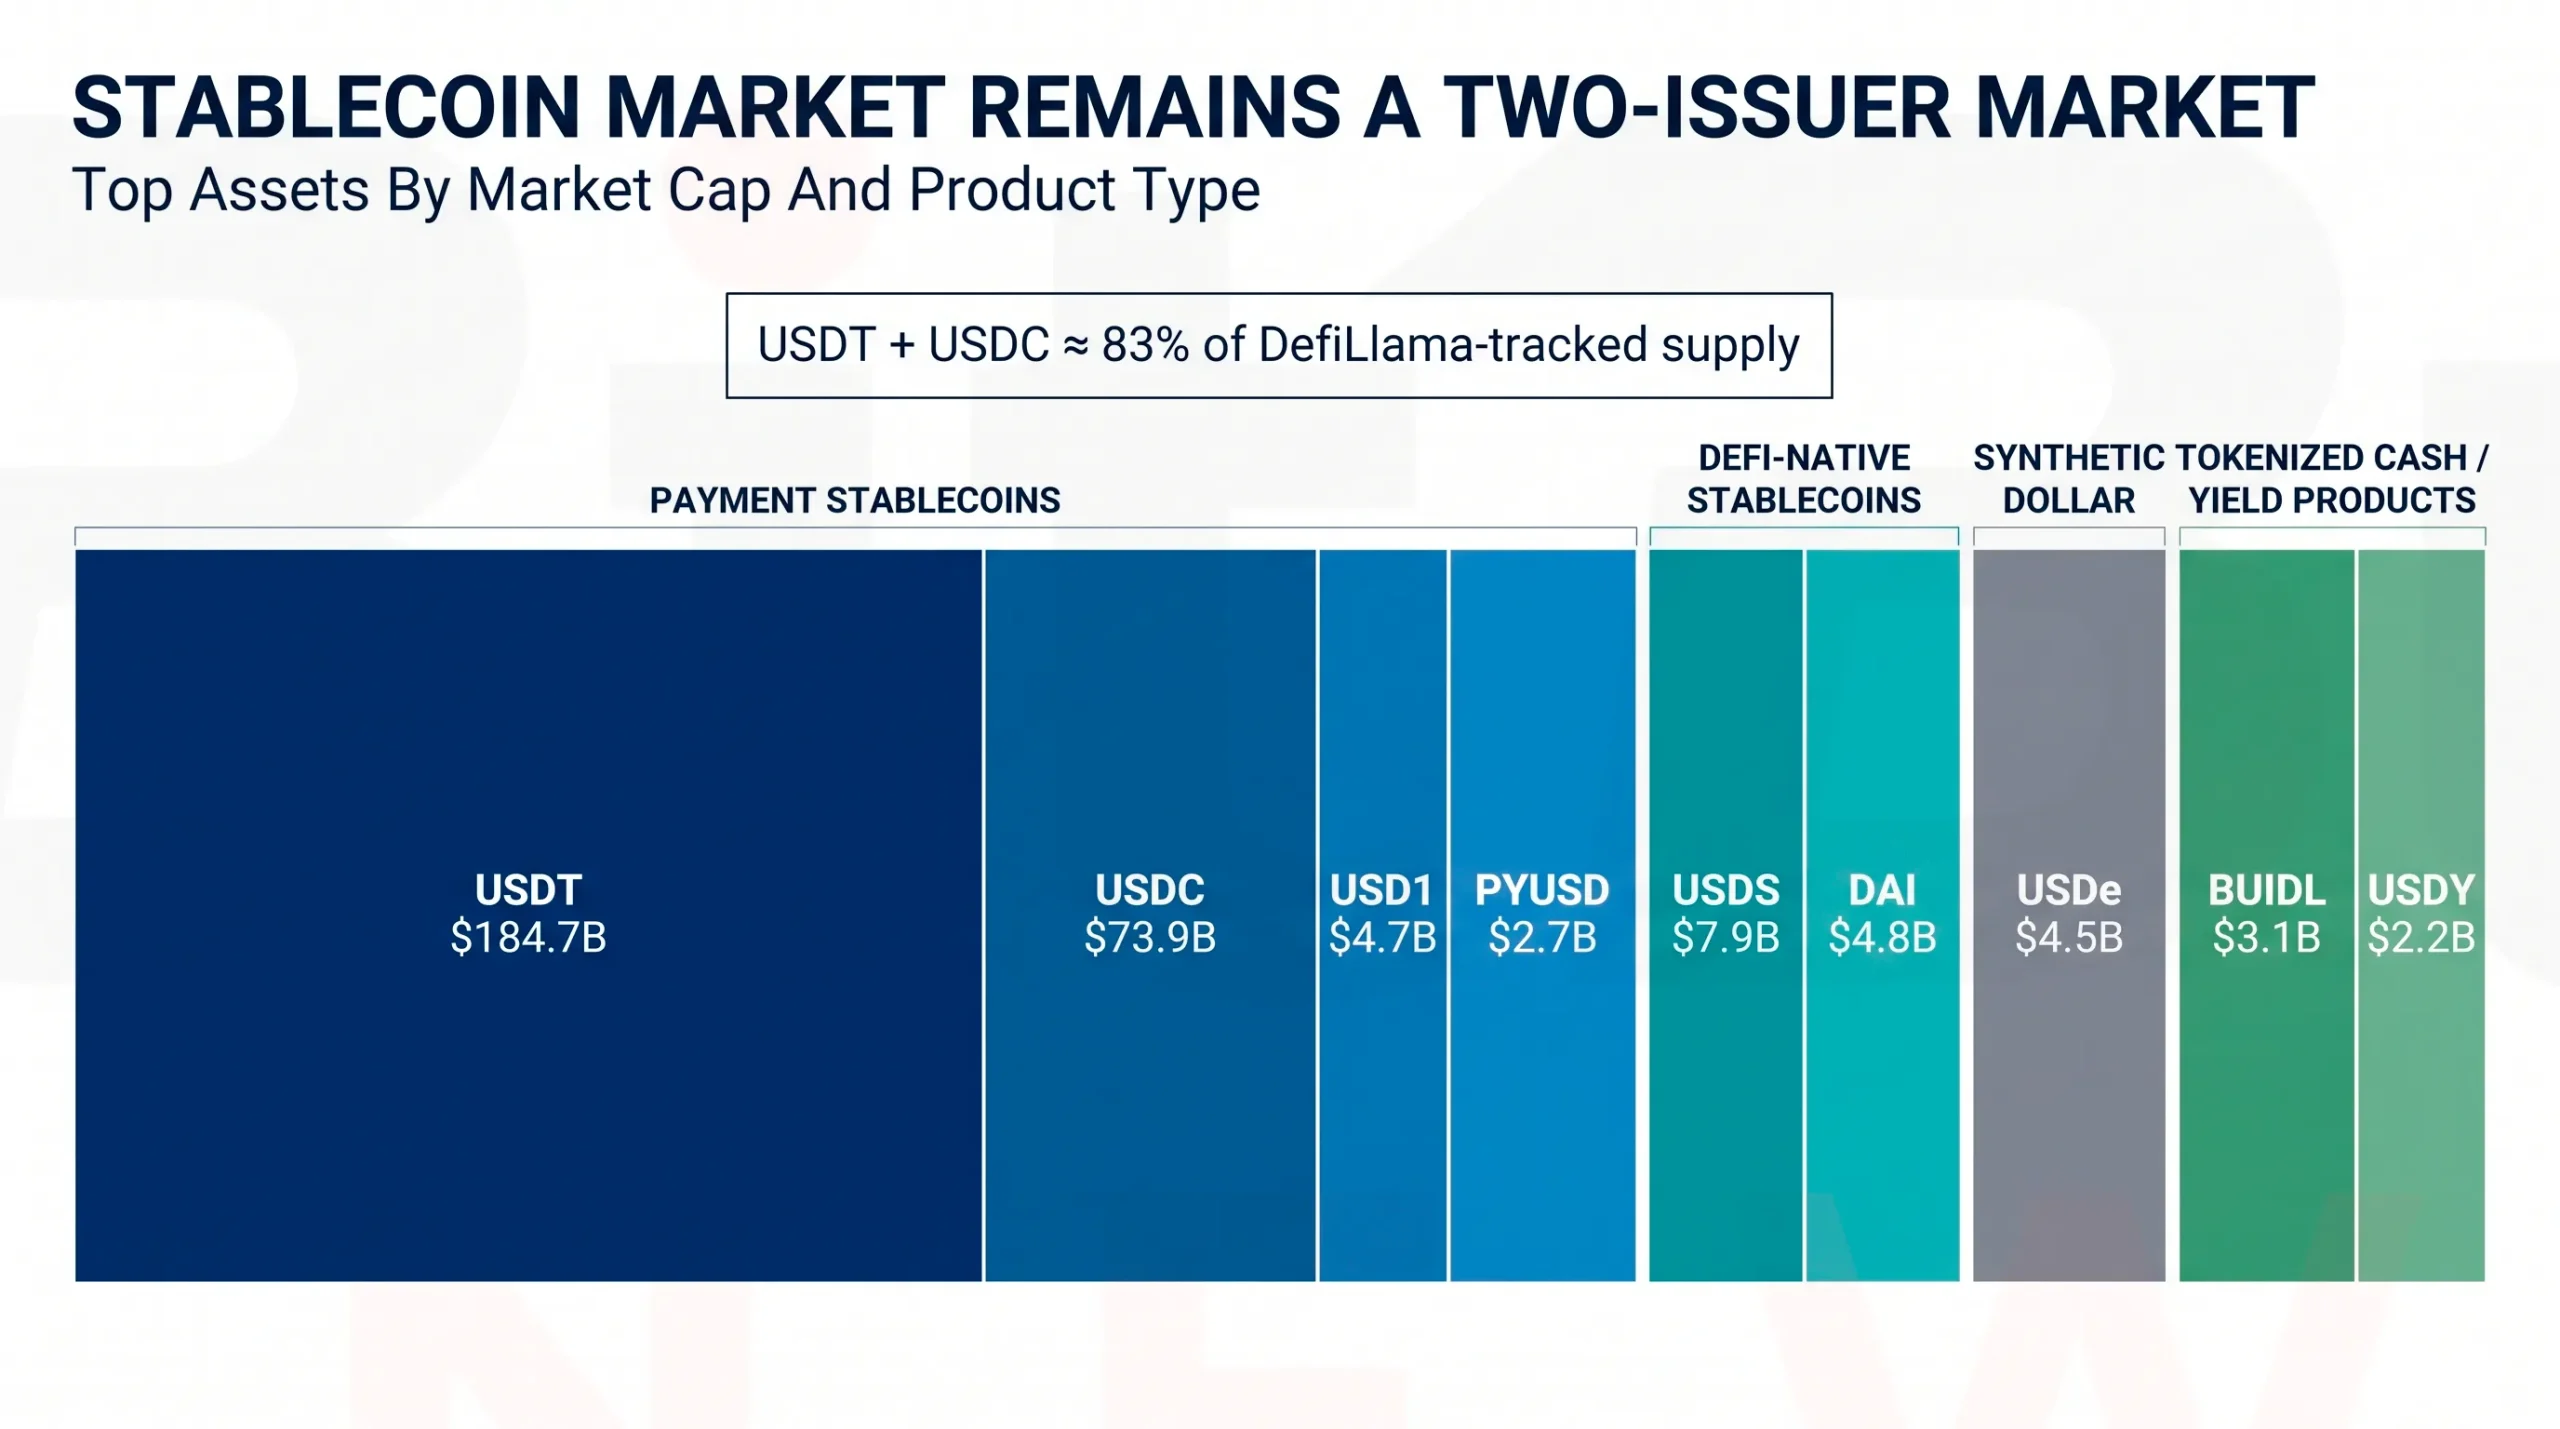
Chart: Stacked Bar Chart Showing Top Stablecoins By Market Cap, Split Into Payment Stablecoins, DeFi-Native Stablecoins, Synthetic Dollars, And Tokenized Cash/Yield Instruments
What The Flow Actually Means
The latest data does not show a broad stablecoin run. It shows a short-term liquidity drain after a strong year-long expansion.
For traders, the signal is simple: stablecoin supply is not adding fuel right now. A 30-day contraction in USDT and USDC reduces the amount of immediately deployable dollar liquidity sitting on-chain. That does not automatically mean lower crypto prices, but it does mean rallies need confirmation from spot demand, ETF flows, or leverage expansion rather than fresh stablecoin minting alone.
For exchanges and market makers, the Tron number matters. Tron’s stablecoin supply was essentially flat over seven days, while Ethereum declined. That suggests USDT transfer liquidity stayed resilient even as broader on-chain dollar supply softened.
For DeFi, the mixed USDS and DAI readings deserve attention. A falling USDS supply and rising DAI supply may reflect internal rotation, collateral preference shifts, or product-level incentives inside the Sky/Maker ecosystem. The public market-cap data shows the movement, but it does not fully explain the wallet-level cause.
Issuer Quality And Transparency
Issuer quality is no longer a side issue. At this size, reserve composition, redemption access, banking partners, audit scope, and regulatory treatment are part of market structure.
| Issuer / Asset | Public Data Point | Why It Matters |
|---|---|---|
| Tether / USDT | Tether reported Q1 2026 assets of $191.8B, liabilities of $183.5B, and an $8.23B excess reserve buffer. It also reported roughly $141B of direct and indirect U.S. Treasury bill exposure. | USDT remains the largest source of crypto-dollar liquidity, so reserve liquidity and disclosure cadence affect the whole market. |
| Circle / USDC | Circle says USDC reserve holdings are disclosed weekly, mint/burn flows are published, and a Big Four accounting firm provides monthly third-party assurance. | USDC is the main regulated-dollar stablecoin used by institutions and U.S.-aligned partners. |
| Circle / USDC In Europe | Circle says USDC and EURC are MiCA compliant, with USDC described as the only top-ten stablecoin by market cap compliant with the EU rules. | Regulatory clarity can influence exchange listings, banking access, and institutional treasury policy. |
| BNY / USDC Rail | BNY reportedly plans to let institutional clients store, transfer, mint, and burn USDC on its digital-asset platform by the end of July. | Bank-side mint and burn access makes USDC easier to use for regulated treasury workflows. |
Tether’s Q1 disclosure shows the scale of USDT’s reserve machine: $183.4 billion in token-related liabilities and $141 billion of Treasury bill exposure. That is not a niche crypto balance sheet. It is a major short-duration dollar portfolio attached to the largest settlement token in the market.
Circle’s advantage is different. It leans on reserve transparency, monthly assurance, regulated affiliates, MiCA positioning, and institutional banking links. Circle states that USDC is backed by highly liquid cash and cash-equivalent assets and is redeemable 1:1 for dollars, with the majority of the reserve invested in the Circle Reserve Fund, an SEC-registered 2a-7 government money market fund managed by BlackRock.
The market is not choosing between “safe” and “unsafe” in a simple way. It is choosing between reach, liquidity, regulatory comfort, chain availability, redemption access, and counterparty preference.
Adjusted Volume: Why Raw Numbers Can Mislead
Stablecoin transfer volume is useful, but raw volume is a noisy metric.
Visa’s Onchain Analytics framework, developed with Allium Labs, Artemis, and Castle Island Ventures, uses adjustment methods to filter out activity that can inflate raw stablecoin usage, including internal smart-contract movements and other non-organic activity.
BCG and Allium make the same point from a payments angle. Their dashboard says adjusted stablecoin activity in 2025 was led by investment and trading flows at roughly $1.5 trillion, followed by centralized exchange activity at roughly $1.1 trillion, while real-economy payments were estimated at $350 billion to $550 billion.
That is not bearish. It is just cleaner.
Stablecoins are already core crypto settlement infrastructure. They are not yet a full replacement for global card networks, bank transfers, or corporate treasury systems. The strongest current use remains capital movement, trading collateral, exchange settlement, DeFi, and cross-border dollar access.
Structural Risks To Watch
| Risk Area | Current Signal | Why It Matters |
|---|---|---|
| Issuer Concentration | USDT And USDC Control Roughly 83% Of DefiLlama-Tracked Supply | A disruption at either issuer would hit liquidity across exchanges, DeFi, and payment rails. |
| Chain Concentration | Ethereum And Tron Hold Roughly 78% Of Chain-Level Stablecoin Supply | Liquidity is deep, but operational and policy risk clusters around two networks. |
| Volume Quality | Adjusted Volume Is Far Smaller Than Raw Transfer Volume | Analysts should separate payments, trading, bot activity, and intermediary routing. |
| Reserve Disclosure Gaps | Circle And Tether Use Different Disclosure Cadences And Assurance Models | Transparency is not uniform across the largest issuers. |
| Tokenized Cash Overlap | BUIDL, USYC, USDY, And Similar Products Appear Beside Payment Stablecoins In Some Dashboards | Investors must distinguish redeemable payment tokens from yield-bearing or fund-style instruments. |
The biggest near-term risk is not a peg break. It is analytical laziness.
A stablecoin dashboard can show a bigger market, more transfers, and higher total volume while real economic usage stays much smaller. That is why this monitor treats supply, chain distribution, issuer quality, and adjusted-volume methodology as separate signals rather than one blended “adoption” number.
BitBullNews View
The June 30 reading is defensive, not distressed.
Stablecoin supply is down over seven and 30 days, and the decline hit both USDT and USDC. That weakens the dry-powder argument for crypto markets in the very short term. At the same time, the market remains far larger than it was in early 2025, institutional rails around USDC are improving, and tokenized cash products continue to blur the boundary between stablecoins and on-chain money-market exposure.
The market is moving into a more mature phase. Growth is no longer just about minting more tokens. It is about who controls redemption, which chains hold usable liquidity, which issuers have credible reserves, and whether activity reflects real settlement or circular on-chain traffic.
Key Findings
- Stablecoin market cap stood at $312.3 billion, down 2.3% over 30 days.
- USDT remained dominant at $184.7 billion and 59.1% market share.
- USDC stood at $73.9 billion, down 2.65% over 30 days.
- Ethereum and Tron together held roughly 78% of chain-level stablecoin liquidity.
- Base and Arbitrum posted positive weekly stablecoin growth, but their absolute supply remained small compared with Ethereum and Tron.
- Adjusted stablecoin usage remains far below raw transfer volume, with BCG and Allium estimating real-economy payments at $350 billion to $550 billion in 2025.
What To Watch Next
The next clean bullish signal would be renewed 30-day expansion in both USDT and USDC supply, not just growth in one issuer. A USDT-only rebound would help trading liquidity, but a joint USDT and USDC rebound would say more about broad-based dollar demand.
The second watch item is Ethereum versus Tron. If Tron keeps holding steady while Ethereum keeps draining, the market is leaning toward transfer liquidity over DeFi and institutional settlement. If Ethereum rebounds first, that would be a stronger signal for on-chain capital deployment.
The third watch item is tokenized cash. BUIDL, USYC, USDY, and similar products are no longer peripheral. They are starting to sit beside payment stablecoins in market dashboards, and that forces analysts to separate “stable dollar liquidity” from “yield-bearing tokenized cash exposure.”
Final Verdict
Stablecoin liquidity is still the deepest cash layer in crypto, but the latest flow data is not expansionary.
The market has moved from broad growth to selective consolidation. USDT still dominates. USDC remains the main regulated institutional rail. Ethereum and Tron still absorb most stablecoin liquidity. L2s are growing, but from a much smaller base.
- For traders, the message is caution: stablecoin supply is not currently adding fresh fuel.
- For investors, the message is selectivity: issuer quality and redemption access matter more than headline market cap.
- For policymakers, the message is concentration: the dollar-on-chain market is already large enough that reserve rules, banking links, and disclosure standards are market-structure issues, not niche crypto details.
Data Sources & References
- DefiLlama Stablecoins Market Cap, Supply, Peg Data, And Issuer Rankings.
- DefiLlama Stablecoins By Chain Dashboard.
- Artemis Stablecoins Overview.
- Stablecoin Beat Market Cap Charts.
- Stablecoin Beat Dominance And HHI Charts.
- Circle Transparency And USDC Reserve Disclosure.
- Circle USDC Reserve And Redemption Information.
- Circle MiCA Compliance Statement.
- Tether Q1 2026 Attestation And Reserve Disclosure.
- Visa Onchain Analytics And Adjusted Stablecoin Methodology.
- BCG And Allium Stablecoin Payments Dashboard.
- CoinGecko Global Crypto Market Data.
- BNY And Circle USDC Institutional Services Report.