


Content
The stablecoin market contracted this week. The capital that remained became more active inside DeFi.
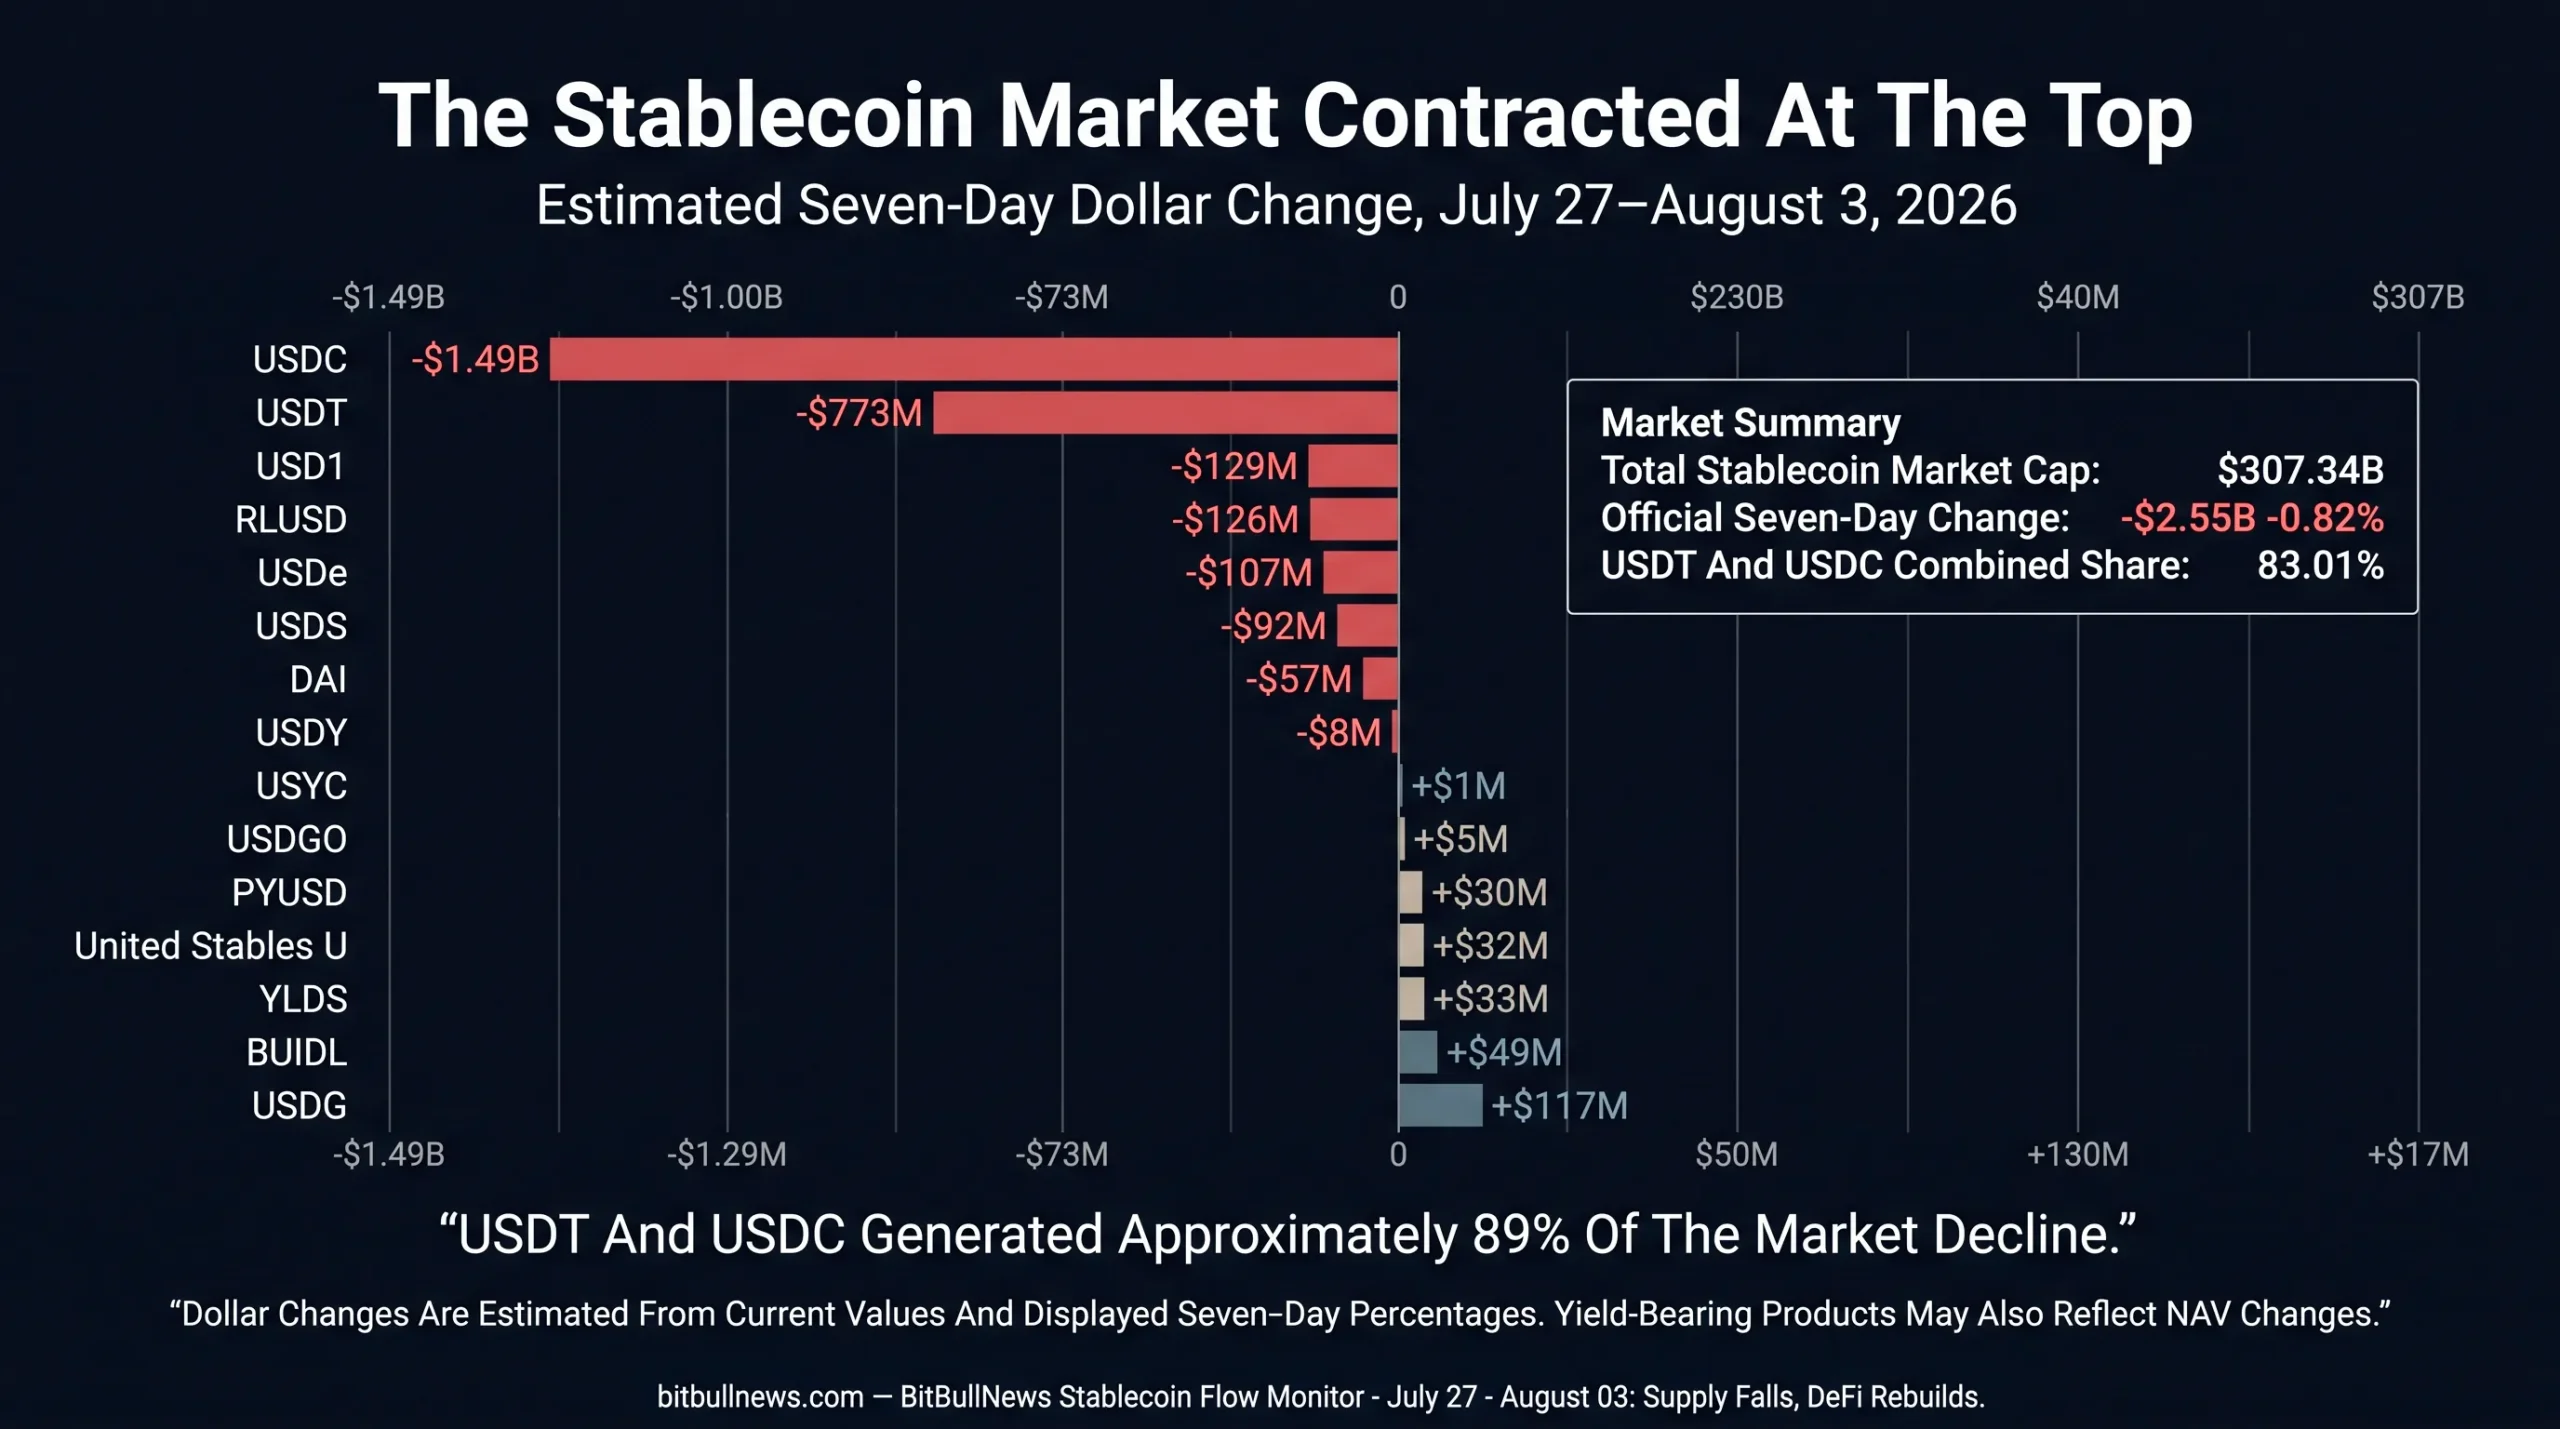
DefiLlama recorded total stablecoin market capitalization of $307.34 billion, down approximately $2.55 billion, or 0.82%, over seven days. USDC generated the largest product-level decline, losing an estimated $1.49 billion. USDT contracted by roughly $773 million. Together, the two market leaders explained almost 89% of the entire market decline.
The network distribution changed just as sharply.
Ethereum lost an estimated $1.67 billion of stablecoins. Solana gave back approximately $687 million after gaining $1.16 billion in the previous BitBullNews monitoring period. XRP Ledger lost around $146 million, primarily through a contraction in RLUSD. Arbitrum, X Layer, Monad, Plasma, Mantle and Robinhood Chain expanded against the broader decline.
DeFi deployment moved in the opposite direction.
Stableflows’ tracked stablecoin supply fell from $255.58 billion to $253.32 billion, but stablecoins deposited in selected DeFi protocols increased from $9.11 billion to $9.76 billion. Utilization recovered from 3.6% to 3.9%.
This was not a simple liquidity exit.
Available stablecoin supply declined. DeFi positioning strengthened. USDC reversed on Ethereum and Solana, while smaller regulated and tokenized-cash products continued expanding.
Data Scope And Methodology
Market and network figures use live DefiLlama snapshots captured on August 3. Stableflows displayed a dashboard timestamp of August 3, 2026, at 8:47 AM.
DefiLlama’s market overview reported $307.34 billion of stablecoin capitalization. Its chain-level dashboard reported $306.94 billion. The difference reflects variations in chain coverage, asset classification and refresh timing. The totals should not be mechanically reconciled.
Estimated dollar changes are calculated from current value and the seven-day percentage displayed by the data provider. Values are rounded.
Stableflows tracks USDC, USDT, USDT0 and PYUSD inside selected DeFi protocols. It does not cover every stablecoin, treasury wallet, centralized exchange balance, payment account or DeFi application.
Stablecoin Market Scorecard
| Metric | August 3 Reading | Previous BBN Snapshot | Weekly Change | Market Read |
|---|---|---|---|---|
| Total Stablecoin Market Cap | $307.34B | $309.85B | Approximately -$2.51B Between BBN Snapshots | The market contracted after the previous flat week |
| Official DefiLlama Seven-Day Change | — | — | -$2.55B, -0.82% | Live measurement differs slightly from fixed BBN snapshot timing |
| USDT Market Cap | $183.16B | $183.90B | -0.42%, Approximately -$773M | Tether remained dominant despite net contraction |
| USDC Market Cap | $71.97B | $73.46B | -2.03%, Approximately -$1.49B | Largest major stablecoin decline |
| USDT And USDC Combined Share | 83.01% | 83.06% | -0.05 Percentage Points | Concentration remained almost unchanged |
| Ethereum Stablecoin Supply | $147.31B | $148.69B | -1.12%, Approximately -$1.67B | Largest absolute network decline |
| Solana Stablecoin Supply | $15.64B | $16.32B | -4.21%, Approximately -$687M | Reversed most of the previous week’s expansion |
| Tracked Stablecoin Supply | $253.32B | $255.58B | -$2.26B, -0.88% | Stableflows’ measurement base contracted |
| Stablecoins In Tracked DeFi | $9.76B | $9.11B | +$650M, +7.1% | Deployment rebuilt despite lower supply |
| DeFi Utilization Rate | 3.9% | 3.6% | +0.3 Percentage Points | More of the tracked supply entered DeFi |
| Stablecoins As Share Of DeFi TVL | 7.9% | 7.1% | +0.8 Percentage Points | Stablecoins regained importance inside total DeFi TVL |
The Market Decline Was Concentrated At The Top
USDC and USDT remained dominant. They also generated almost the entire contraction.
USDC fell 2.03% to $71.97 billion, removing an estimated $1.49 billion. USDT declined by 0.42% to $183.16 billion, removing approximately $773 million.
Their combined estimated decline of $2.26 billion represented 88.9% of DefiLlama’s reported $2.55 billion market contraction.
Major Stablecoin Supply Changes
| Stablecoin Or Tokenized Cash Product | Current Value | Seven-Day Change | Estimated Dollar Change |
|---|---|---|---|
| USDC | $71.97B | -2.03% | -$1.49B |
| USDT | $183.16B | -0.42% | -$773M |
| USD1 | $4.01B | -3.12% | -$129M |
| RLUSD | $1.46B | -7.94% | -$126M |
| USDe | $3.87B | -2.69% | -$107M |
| USDS | $6.56B | -1.38% | -$92M |
| DAI | $4.80B | -1.17% | -$57M |
| USDY | $2.15B | -0.35% | -$8M |
| USYC | $3.01B | +0.04% | +$1M |
| USDGO | $1.11B | +0.45% | +$5M |
| PYUSD | $2.70B | +1.13% | +$30M |
| United Stables U | $1.10B | +3.01% | +$32M |
| YLDS | $629.58M | +5.59% | +$33M |
| BUIDL | $2.69B | +1.85% | +$49M |
| USDG | $3.36B | +3.62% | +$117M |
Estimated dollar changes use current values and displayed seven-day percentages. Market-value changes in yield-bearing products can include net asset value movements as well as issuance.
The contraction was broad enough to matter.
USD1, RLUSD, USDe, USDS and DAI all declined. The positive side came from smaller regulated stablecoins and tokenized cash products rather than from the two market leaders.
That created a market with almost unchanged concentration but a more fragmented growth edge.
USDC Reversed On Ethereum And Solana
USDC produced the week’s defining move.
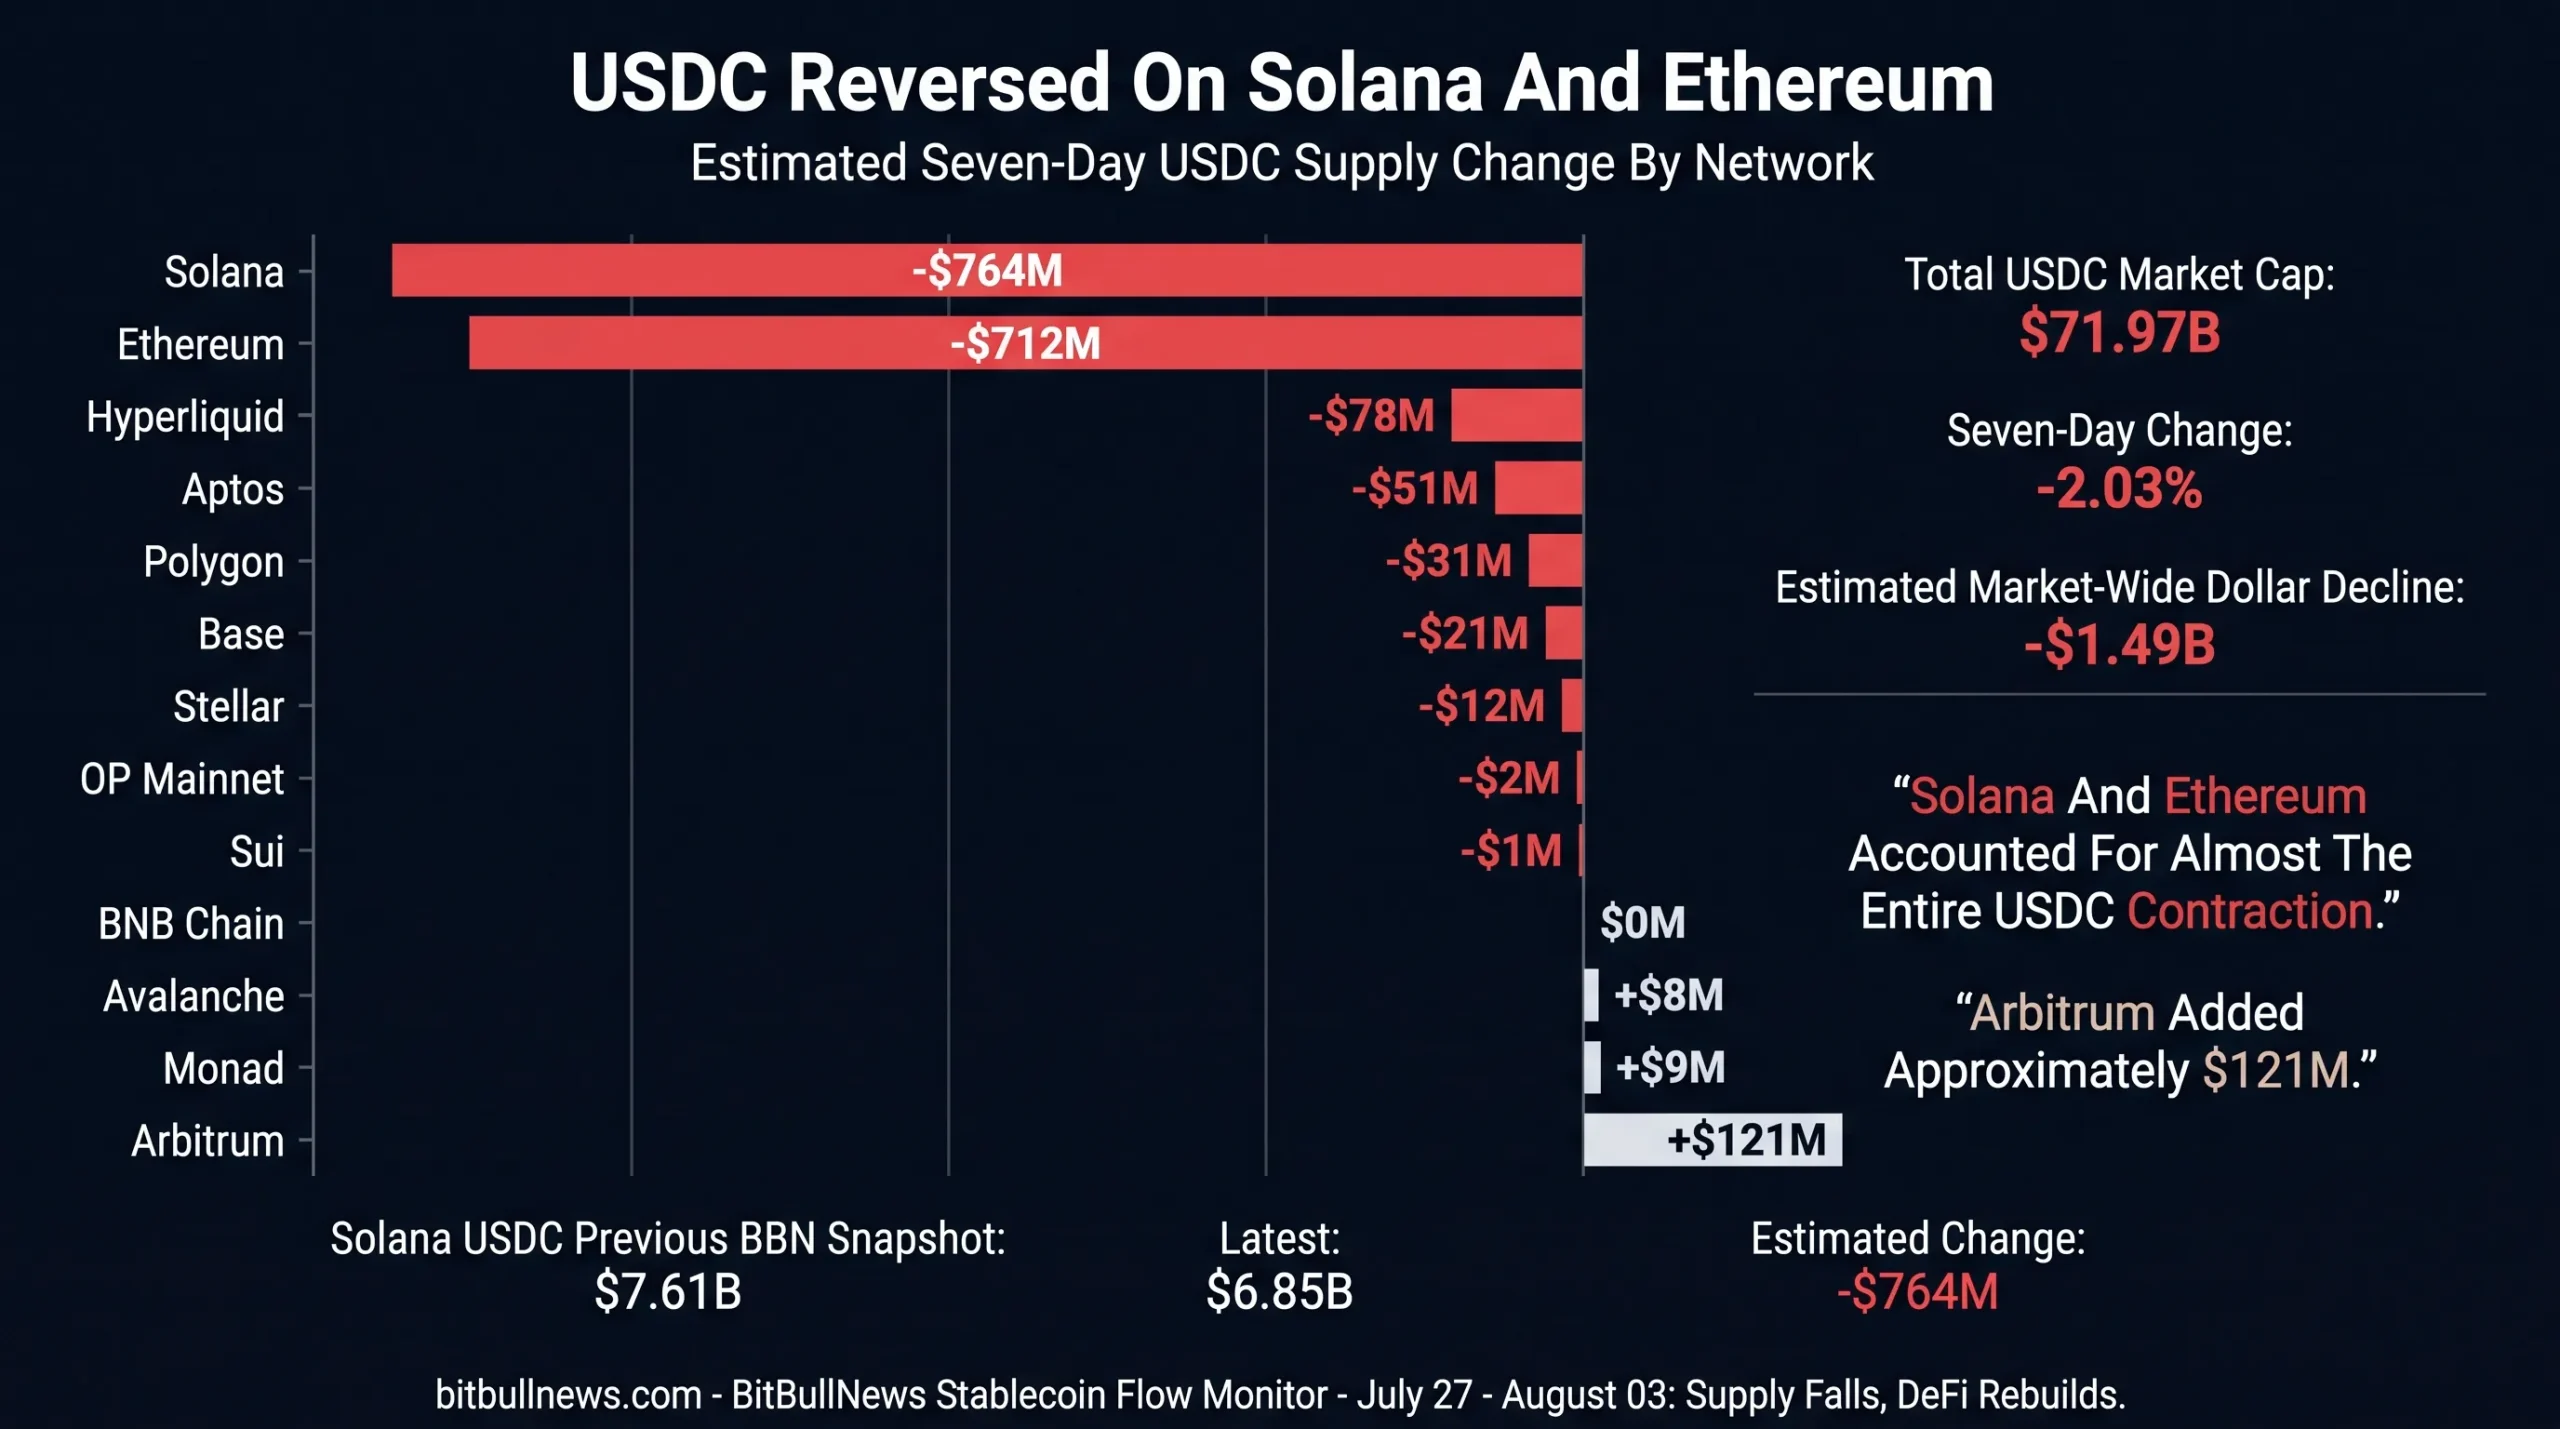
Its $1.49 billion estimated contraction was concentrated on Ethereum and Solana. Ethereum USDC lost approximately $712 million. Solana USDC lost roughly $764 million. Those two networks alone accounted for almost the full market-wide decline.
Arbitrum provided the major offset, adding an estimated $121 million of USDC.
USDC Supply By Network
| Network | Current USDC Supply | Seven-Day Change | Estimated Dollar Change |
|---|---|---|---|
| Ethereum | $46.16B | -1.52% | -$712M |
| Solana | $6.85B | -10.04% | -$764M |
| Hyperliquid | $6.09B | -1.27% | -$78M |
| Base | $4.18B | -0.49% | -$21M |
| Arbitrum | $2.23B | +5.73% | +$121M |
| Polygon | $1.65B | -1.82% | -$31M |
| BNB Chain | $1.58B | Approximately Flat | Approximately Flat |
| Avalanche | $422.92M | +1.85% | +$8M |
| Stellar | $318.34M | -3.54% | -$12M |
| Sui | $270.66M | -0.35% | -$1M |
| Aptos | $256.90M | -16.62% | -$51M |
| Monad | $243.95M | +3.80% | +$9M |
| OP Mainnet | $174.73M | -1.01% | -$2M |
The Solana move was the more dramatic reversal.
One week earlier, Solana added approximately $521 million of USDC as part of a $1.16 billion network-wide stablecoin inflow. This week, its USDC balance fell by approximately $764 million.
Solana therefore gave back the previous USDC gain and more.
That does not prove the same tokens or investors reversed course. The public dashboard does not identify direct wallet-level migration between reporting snapshots. It does show that last week’s network expansion was not durable.
Solana Gave Back Most Of Its Previous Gain
Solana’s total stablecoin supply fell 4.21% to $15.64 billion, an estimated decline of $687 million.
USDC explained more than the entire net loss. Other major Solana assets moved in the opposite direction:
- USDT increased approximately $30 million.
- BUIDL increased around $21 million.
- USDG added roughly $16 million.
- USDGO added approximately $5 million.
- PYUSD increased around $4 million.
Solana did not suffer a broad stablecoin withdrawal. It suffered a large USDC reversal.
That distinction matters because the network retained or expanded several other forms of dollar liquidity. General-purpose USDT, institutional BUIDL, regulated USDG and enterprise-focused USDGO did not follow USDC lower.
The week weakened Solana’s aggregate liquidity position without reversing every underlying product trend.
Ethereum Lost Both USDT And USDC
Ethereum’s stablecoin supply fell by approximately $1.67 billion to $147.31 billion.
The two largest products explained most of the move:
- Ethereum USDT declined approximately $809 million.
- Ethereum USDC declined around $712 million.
- Ethereum USDe lost roughly $106 million.
- Ethereum USD1 lost approximately $52 million.
Positive movements in BUIDL, PYUSD, USDG and RLUSD provided partial offsets.
Ethereum’s dominance declined from the previous BitBullNews reading of 48.31% to 47.99%.
The change was small, but the composition was broad. Unlike Solana, where USDC dominated the decline, Ethereum lost meaningful balances across several major products.
Stablecoin Liquidity Shifted Across Networks
The market contraction was not evenly distributed.
Arbitrum gained approximately $103 million, driven primarily by USDC. X Layer gained around $60 million as USDG expanded. Monad, Plasma, Mantle and Robinhood Chain each added roughly $48 million to $56 million.
XRP Ledger moved sharply in the other direction.
Stablecoin Supply By Network
| Network | Current Stablecoin Supply | Seven-Day Change | Estimated Dollar Change | Dominant Stablecoin |
|---|---|---|---|---|
| Ethereum | $147.31B | -1.12% | -$1.67B | USDT |
| Tron | $91.58B | -0.11% | -$101M | USDT |
| Solana | $15.64B | -4.21% | -$687M | USDC |
| BNB Chain | $13.36B | -0.64% | -$86M | USDT |
| Hyperliquid | $6.24B | -1.26% | -$80M | USDC |
| Base | $4.83B | -0.30% | -$15M | USDC |
| Arbitrum | $3.50B | +3.04% | +$103M | USDC |
| Polygon | $3.10B | -1.86% | -$59M | USDC |
| X Layer | $2.04B | +3.05% | +$60M | USDG |
| Avalanche | $1.42B | -1.14% | -$16M | BUIDL |
| Aptos | $1.18B | -4.19% | -$52M | USDT |
| Plasma | $944.89M | +5.72% | +$51M | USDT |
| Stellar | $904.06M | -1.07% | -$10M | USDY |
| XRP Ledger | $853.37M | -14.61% | -$146M | RLUSD |
| Monad | $617.44M | +9.92% | +$56M | USDC |
| Mantle | $577.95M | +9.02% | +$48M | USDT |
| Robinhood Chain | $534.62M | +10.59% | +$51M | USDG |
| Sui | $427.84M | -4.37% | -$20M | USDC |
| OP Mainnet | $423.51M | +1.14% | +$5M | USDT |
Dollar changes are estimates derived from current values and displayed seven-day percentages.
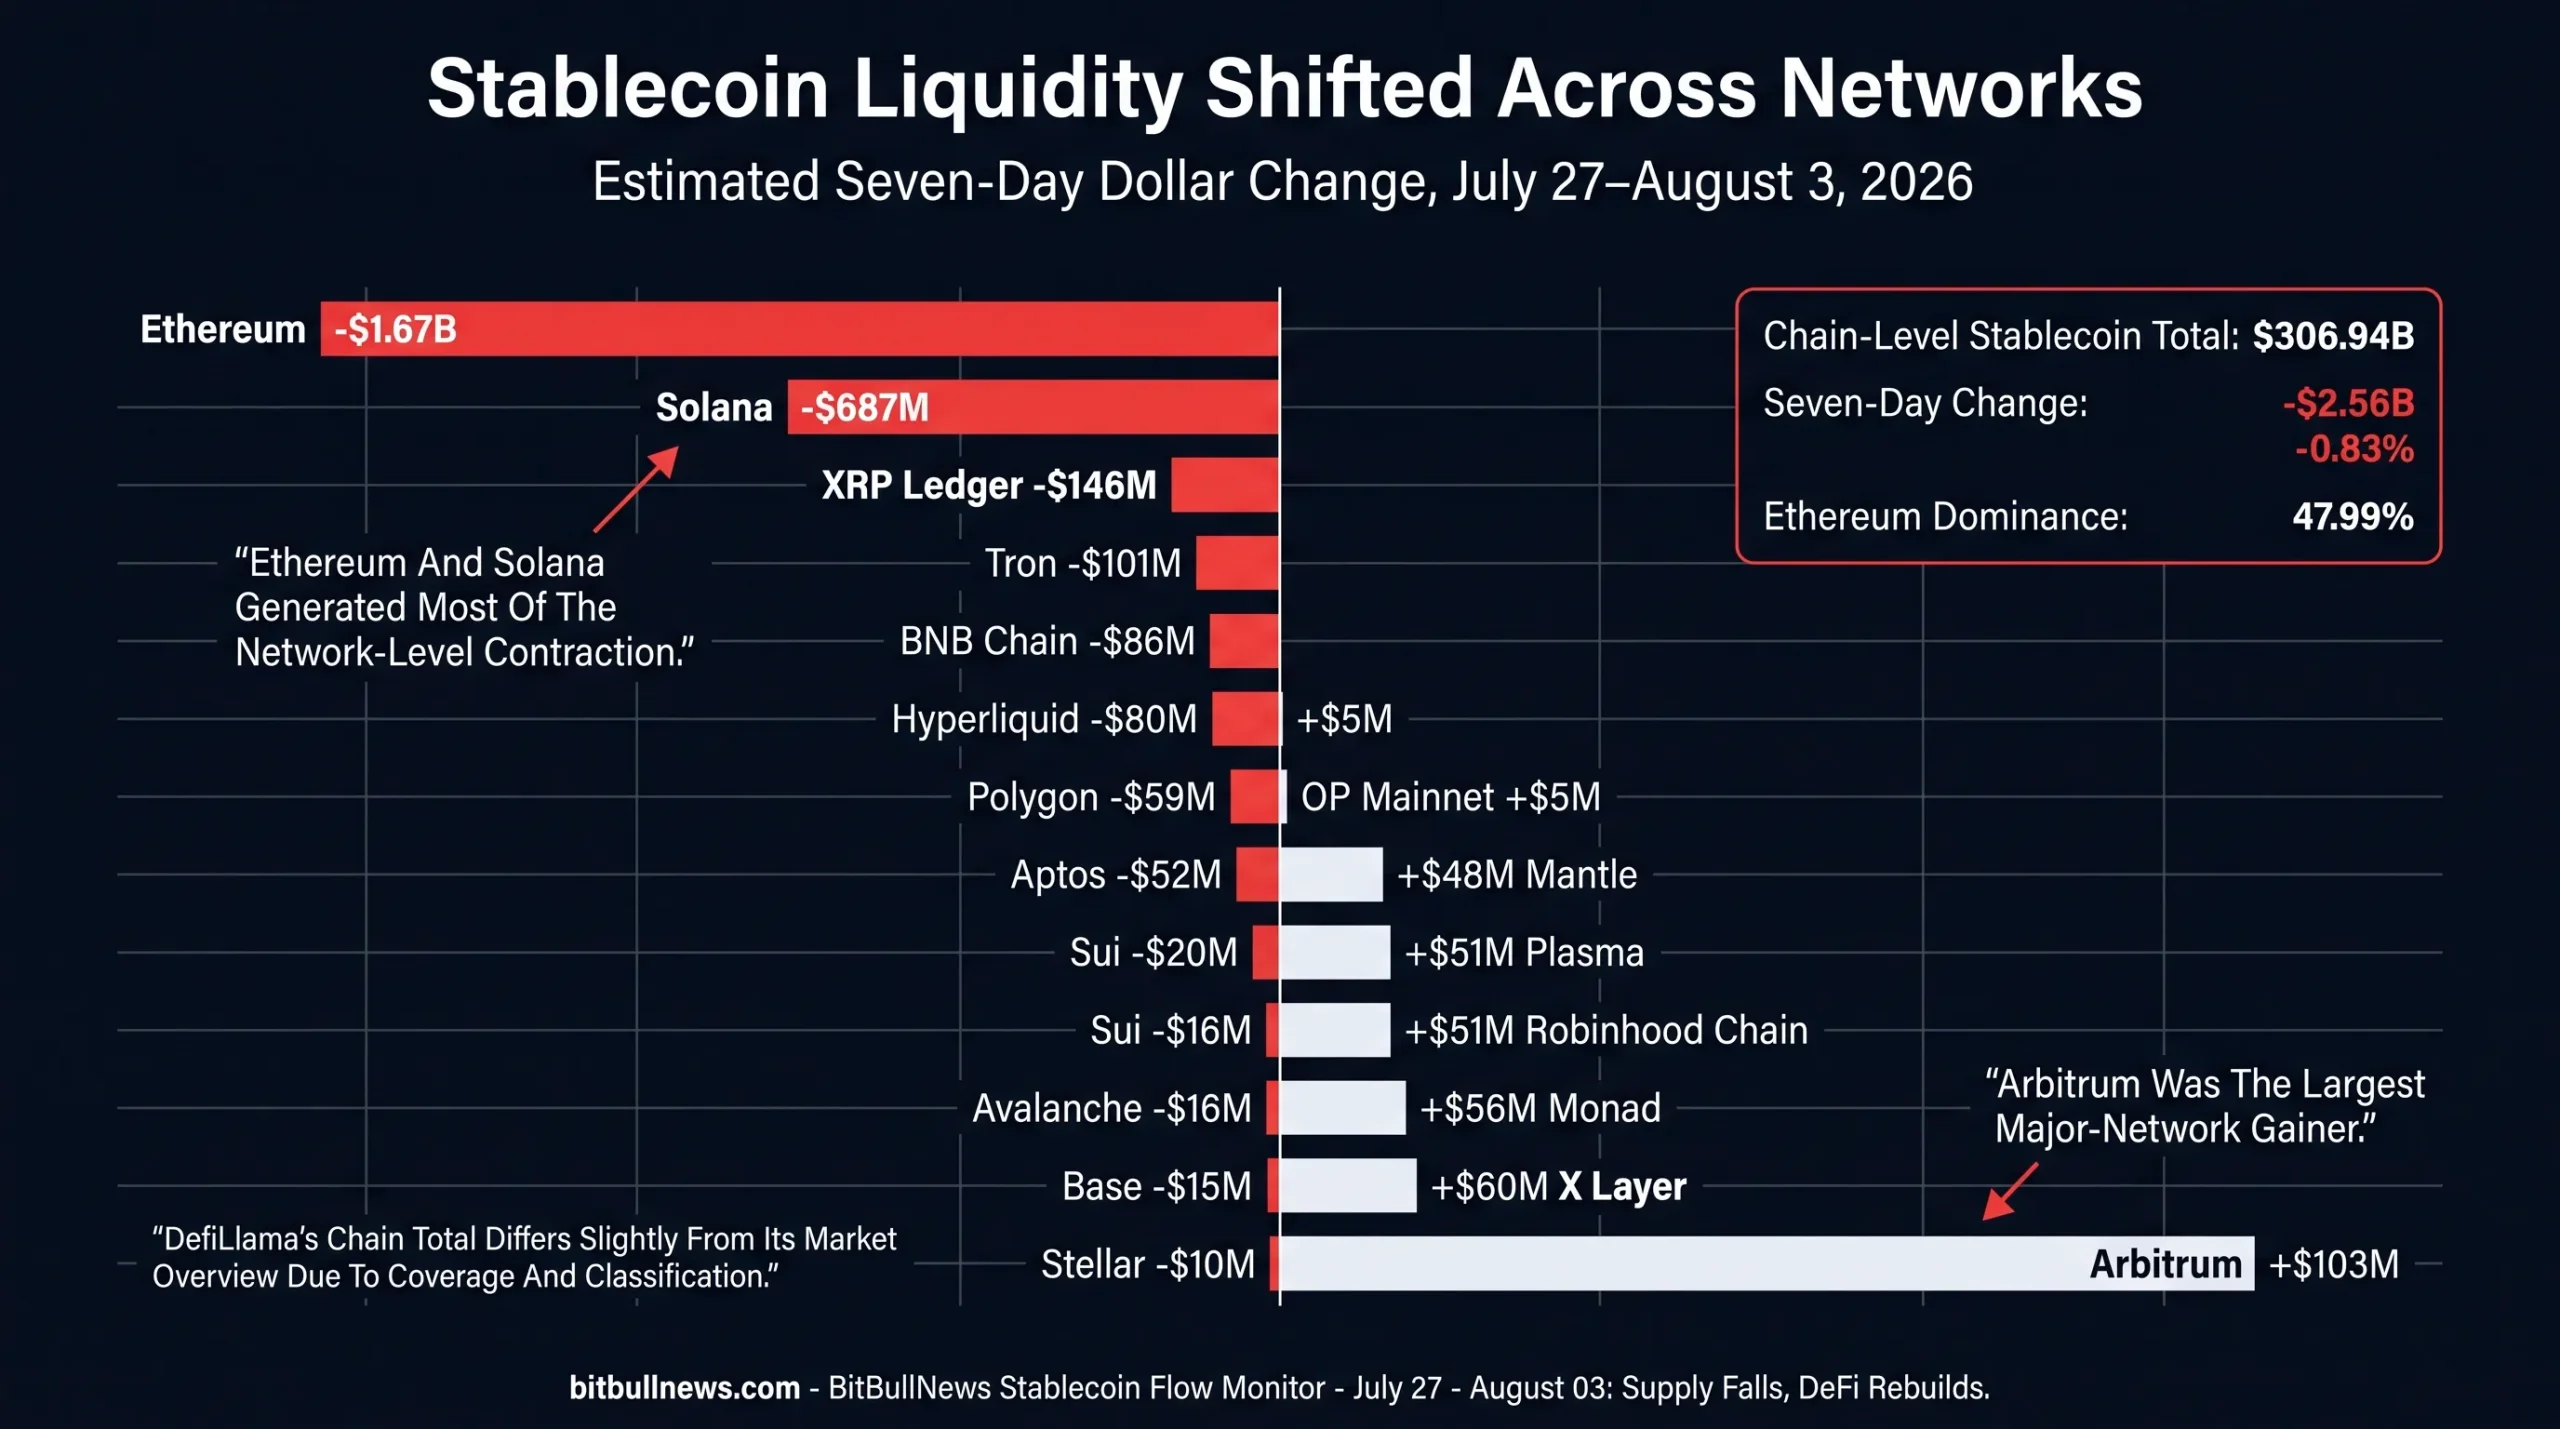
Several network moves were directly connected to one product:
- Arbitrum’s gain was led by approximately $121 million of USDC.
- X Layer’s gain closely matched approximately $61 million of USDG expansion.
- XRP Ledger’s decline was dominated by approximately $135 million of RLUSD contraction.
- Plasma combined around $101 million of additional USDT with roughly $49 million of USDe reduction.
- Mantle’s growth was driven largely by USDT.
Network totals can therefore move sharply without indicating broad adoption or rejection of every stablecoin on that chain.
RLUSD Contracted On XRP Ledger, Not Ethereum
RLUSD fell 7.94% to approximately $1.46 billion, producing the largest percentage decline among major regulated dollar stablecoins.
The entire market-wide contraction was concentrated on XRP Ledger.
RLUSD supply on XRP Ledger fell 15.08% to $759.67 million, an estimated decline of roughly $135 million. Ethereum RLUSD increased 1.33% to $704.02 million, adding about $9 million.
The result followed Ripple’s July 23 launch of Ripple Mint, which gave institutional customers new interfaces and APIs for minting, redeeming and managing RLUSD. The new infrastructure did not prevent a sharp XRP Ledger supply contraction during the following week. Public data does not identify the institutions responsible or explain whether the decline reflected redemption, treasury reallocation or migration into other assets.
The correct interpretation is narrow: RLUSD’s total supply fell, but its Ethereum balance grew.
This was a network-specific contraction, not an equal withdrawal from both native environments.
USD1 And USDe Continued Contracting
USD1 declined 3.12% to approximately $4.01 billion, extending its 30-day contraction to almost 13%.
The decline came from Ethereum and BNB Chain. Solana’s approximately $1.02 billion USD1 balance was unchanged.
USDe fell 2.69% to $3.87 billion. Ethereum lost around $106 million of USDe, while Base and Robinhood Chain added an estimated $18 million and $28 million. Plasma lost roughly $49 million.
Both products illustrate the difference between market-wide supply and network distribution.
A stablecoin can contract overall while expanding into selected ecosystems. That pattern may reflect strategic liquidity placement rather than uniform demand.
USDG Led The Positive Side
USDG increased 3.62% to approximately $3.36 billion, adding an estimated $117 million.
Its growth was distributed across its three largest networks:
- X Layer added approximately $61 million.
- Solana added around $16 million.
- Ethereum added approximately $15 million.
USDG’s expansion was therefore more geographically balanced than USDGO’s single-network model.
USDGO grew only 0.45% this week, but held above $1.11 billion after its rapid expansion during July. Its supply remained entirely on Solana.
The distinction matters for operational risk.
USDG benefits from multichain distribution but requires supply reconciliation across several environments. USDGO has simpler network exposure but depends entirely on Solana for onchain settlement and liquidity.
BUIDL Expanded Against The Market Decline
BUIDL increased 1.85% to approximately $2.69 billion, adding an estimated $49 million.
Ethereum supplied around $31 million of that growth. Solana added approximately $21 million. Avalanche declined by roughly $3 million.
BUIDL’s growth while USDC and USDT contracted is a meaningful market-structure signal.
Payment stablecoins reduced outstanding supply. A yield-bearing institutional fund increased. That may indicate continued demand for tokenized cash management even as transactional dollar liquidity declined.
BUIDL should not be treated as identical to USDC or USDT. It is a regulated fund interest backed by cash, Treasury bills and repurchase agreements, and transfers are limited to approved investors.
PYUSD Recovered Modestly
PYUSD increased 1.13% to approximately $2.70 billion, adding around $30 million.
The gains were spread across Ethereum, Solana and Arbitrum:
| PYUSD Network | Current Supply | Seven-Day Change | Estimated Dollar Change |
|---|---|---|---|
| Ethereum | $1.75B | +1.25% | +$22M |
| Solana | $686.29M | +0.58% | +$4M |
| Arbitrum | $174.60M | +2.78% | +$5M |
| Flow | $69.98M | +0.36% | Below +$1M |
| Polygon | $10.15M | +0.07% | Approximately Flat |
| Sei | $3.31M | +5.43% | Below +$1M |
The move was constructive but small relative to the approximately $215 million contraction recorded in the previous report.
PYUSD recovered around 14% of that prior estimated decline. It did not return to its earlier supply level.
DeFi Deployment Rebuilt As Supply Fell
Stableflows recorded a reversal of the previous week’s DeFi contraction.
Tracked stablecoin supply fell by $2.26 billion, but stablecoin TVL inside selected DeFi protocols increased by $650 million. Utilization rose by 0.3 percentage points.
DeFi Stablecoin Deployment
| DeFi Deployment Metric | July 27 Snapshot | August 3 Snapshot | Change |
|---|---|---|---|
| Tracked Stablecoin Supply | $255.58B | $253.32B | -$2.26B, -0.88% |
| Stablecoins In Tracked DeFi | $9.11B | $9.76B | +$650M, +7.1% |
| Utilization Rate | 3.6% | 3.9% | +0.3 Percentage Points |
| Stablecoins As Share Of DeFi TVL | 7.1% | 7.9% | +0.8 Percentage Points |
| Total Tracked DeFi TVL | Not Used In Prior Table | $124.30B | Current Snapshot Only |
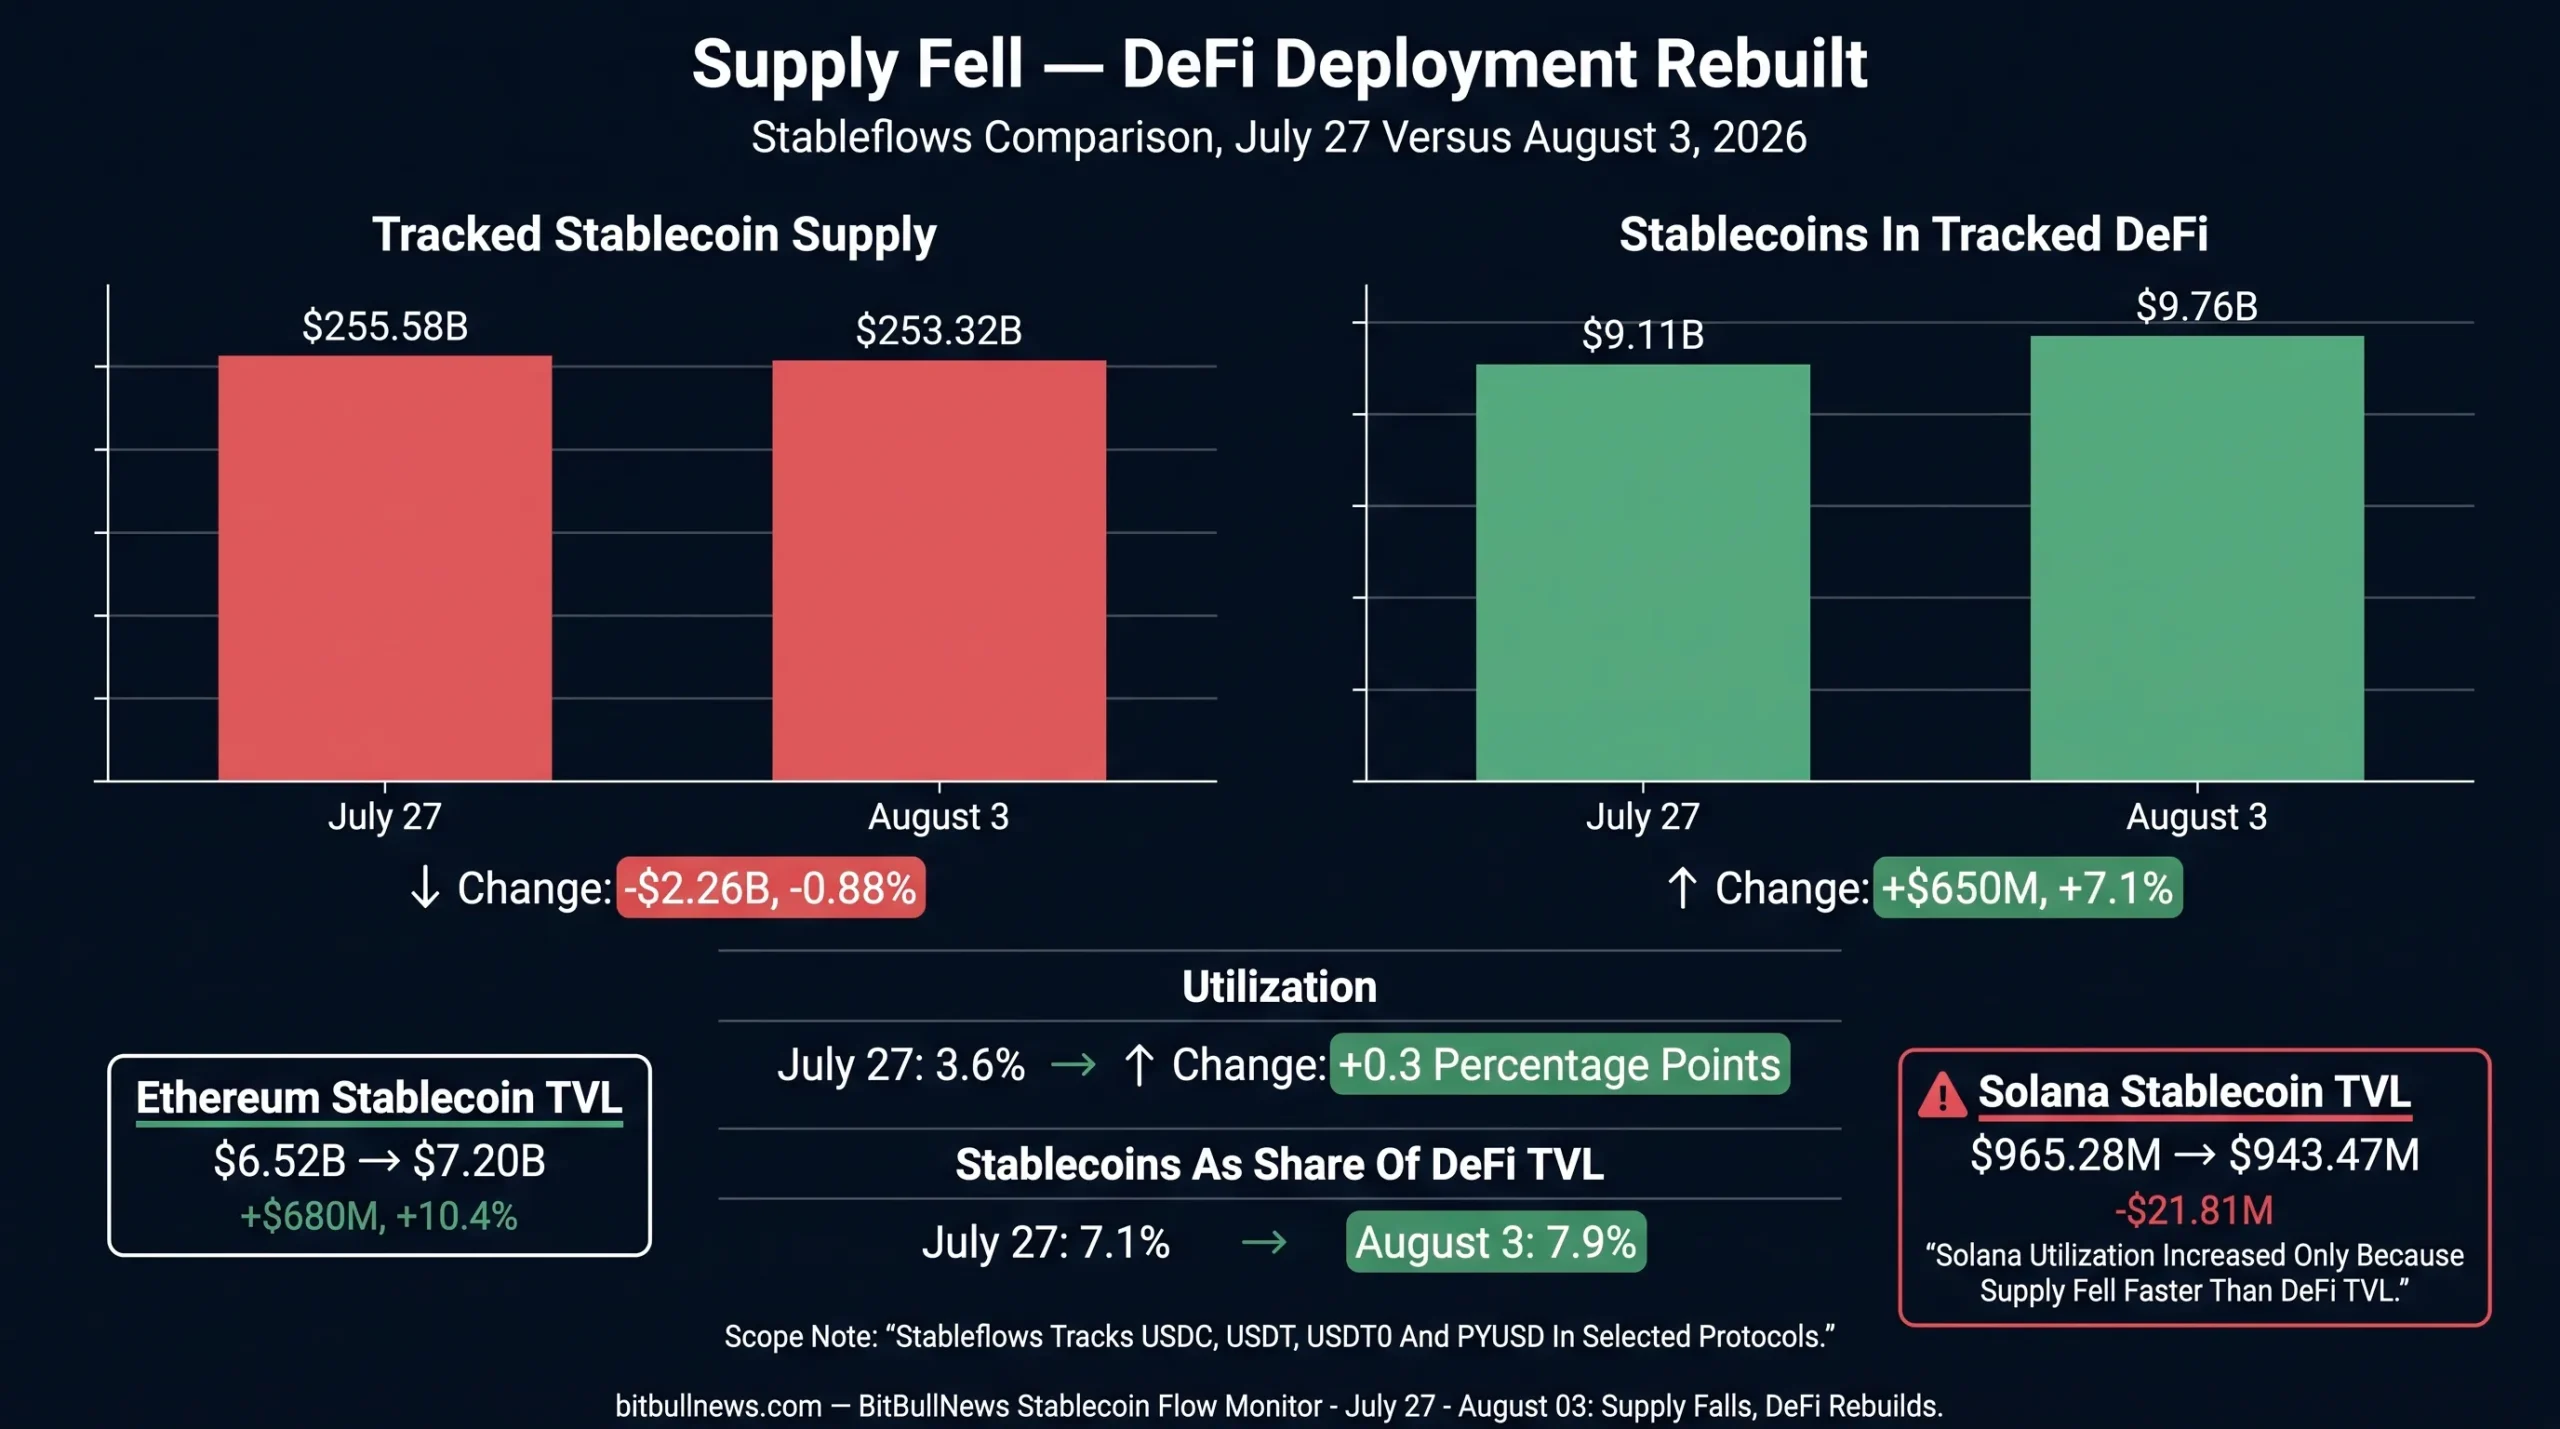
The increase recovered roughly 52% of the $1.26 billion in DeFi stablecoin TVL lost during the previous monitoring period.
The market did not simply return to its earlier position. Deployment remained below the July 20 reading of $10.37 billion.
The direction nevertheless changed.
Stablecoin supply contracted while users placed more of the remaining capital inside lending, liquidity and other tracked DeFi applications.
Ethereum Drove The DeFi Recovery
Ethereum’s tracked stablecoin TVL increased from $6.52 billion to $7.20 billion, a gain of $680 million, or 10.4%.
At the same time, the four-token Ethereum supply measured by Stableflows fell by approximately $1.40 billion. Utilization increased from 5.3% to 5.9%.
Ethereum therefore produced the strongest deployment signal of the week:
- Less tracked stablecoin supply.
- More stablecoin value deposited in DeFi.
- Higher utilization.
- A larger share of total DeFi TVL represented by stablecoins.
The $680 million increase exceeded the market-wide $650 million gain because several other networks experienced DeFi outflows.
DeFi Utilization By Network
| Network | Stablecoins In DeFi | Weekly TVL Change | Weekly Percentage Change | Tracked Stablecoin Supply | Utilization Rate | Previous Utilization |
|---|---|---|---|---|---|---|
| Ethereum | $7.20B | +$680M | +10.4% | $122.62B | 5.9% | 5.3% |
| Solana | $943.47M | -$21.81M | -2.3% | $10.91B | 8.6% | 8.3% |
| Base | $331.61M | -$8.30M | -2.4% | $4.18B | 7.9% | 8.1% |
| Arbitrum | $314.71M | Approximately Flat | 0.0% | $3.23B | 9.7% | 9.9% |
| Avalanche | $308.75M | +$7.42M | +2.5% | $743.99M | 41.5% | 40.2% |
| BNB Chain | $191.40M | +$6.40M | +3.5% | $10.75B | 1.8% | 1.7% |
| Plasma | $166.74M | +$38.40M | +29.9% | $837.56M | 19.9% | 17.5% |
| Tron | $101.25M | +$68.81M | +212.1% | $89.64B | 0.1% | Below 0.1% |
| Hyperliquid | $63.83M | -$35.52M | -35.8% | $6.19B | 1.0% | 1.6% |
| Sui | $58.65M | -$47.00M | -44.5% | $271.72M | 21.6% | 37.5% |
| Polygon | $58.63M | -$1.43M | -2.4% | $2.49B | 2.4% | 2.3% |
| Stellar | $12.94M | -$32.20M | -71.3% | $322.10M | 4.0% | 13.3% |
| Aptos | $12.01M | -$1.72M | -12.5% | $1.14B | 1.1% | 1.1% |
Weekly changes compare the August 3 Stableflows snapshot with BitBullNews’ July 27 capture of the same dashboard.
Solana’s utilization increased from 8.3% to 8.6%, but that was not caused by DeFi growth.
Its tracked DeFi balance fell by approximately $22 million. Utilization rose because tracked supply fell by around $710 million — much faster than deposited value.
That is weaker than Ethereum’s pattern.
Ethereum increased both deployed capital and utilization. Solana increased utilization through denominator compression.
Plasma And Tron Added Deployment
Plasma increased its tracked stablecoin TVL by approximately $38 million to $166.74 million. Utilization rose from 17.5% to 19.9%.
Tron’s tracked stablecoin TVL increased from $32.44 million to $101.25 million. The percentage increase was large, but utilization remained close to 0.1% because Tron held almost $90 billion of stablecoins in Stableflows’ tracked universe.
The Tron result should not be overstated.
A tripling of measured DeFi stablecoin TVL sounds significant. Against the network’s total stablecoin base, it remains negligible.
Sui, Hyperliquid And Stellar Lost Deployment
The strongest negative DeFi shifts occurred on Sui, Hyperliquid and Stellar.
Sui’s tracked stablecoin TVL fell by $47 million, reducing utilization from 37.5% to 21.6%.
Hyperliquid lost approximately $35.5 million and saw utilization decline from 1.6% to 1.0%.
Stellar lost around $32.2 million, with utilization falling from 13.3% to 4.0%.
These declines were too large to be explained by supply changes alone. Capital left the selected DeFi positions faster than stablecoin balances contracted.
Tether Disclosed A $4.11 Billion Reserve Buffer
Tether published its second-quarter attestation on July 31.
The issuer reported $187.75 billion of assets, $183.64 billion of liabilities and $4.11 billion of excess reserves as of June 30. Digital-token liabilities accounted for $183.62 billion. Tether also reported $1.50 billion of net operating profit for the quarter and a $2.38 billion reduction in secured lending exposure.
Tether Q2 Reserve Snapshot
| Tether Metric | June 30, 2026 Reading | Interpretation |
|---|---|---|
| Total Assets | $187.75B | Reported assets backing liabilities and the company’s excess reserve position |
| Total Liabilities | $183.64B | Includes issued digital-token obligations |
| Digital-Token Liabilities | $183.62B | Dominant component of total liabilities |
| Assets Above Liabilities | $4.11B | Reported reserve buffer |
| Q2 Net Operating Profit | $1.50B | Led by Treasury and repo income |
| End-Q2 USDT Issuance | Approximately $184.6B | Around $446M above the end of Q1 |
| Secured Lending Reduction | $2.38B, 15% | Lowered exposure to secured loans |
| Physical Gold Added | 14 Metric Tons | Increased reserve diversification |
| Users Added During Quarter | More Than 30M | Issuer-reported expansion in global user base |
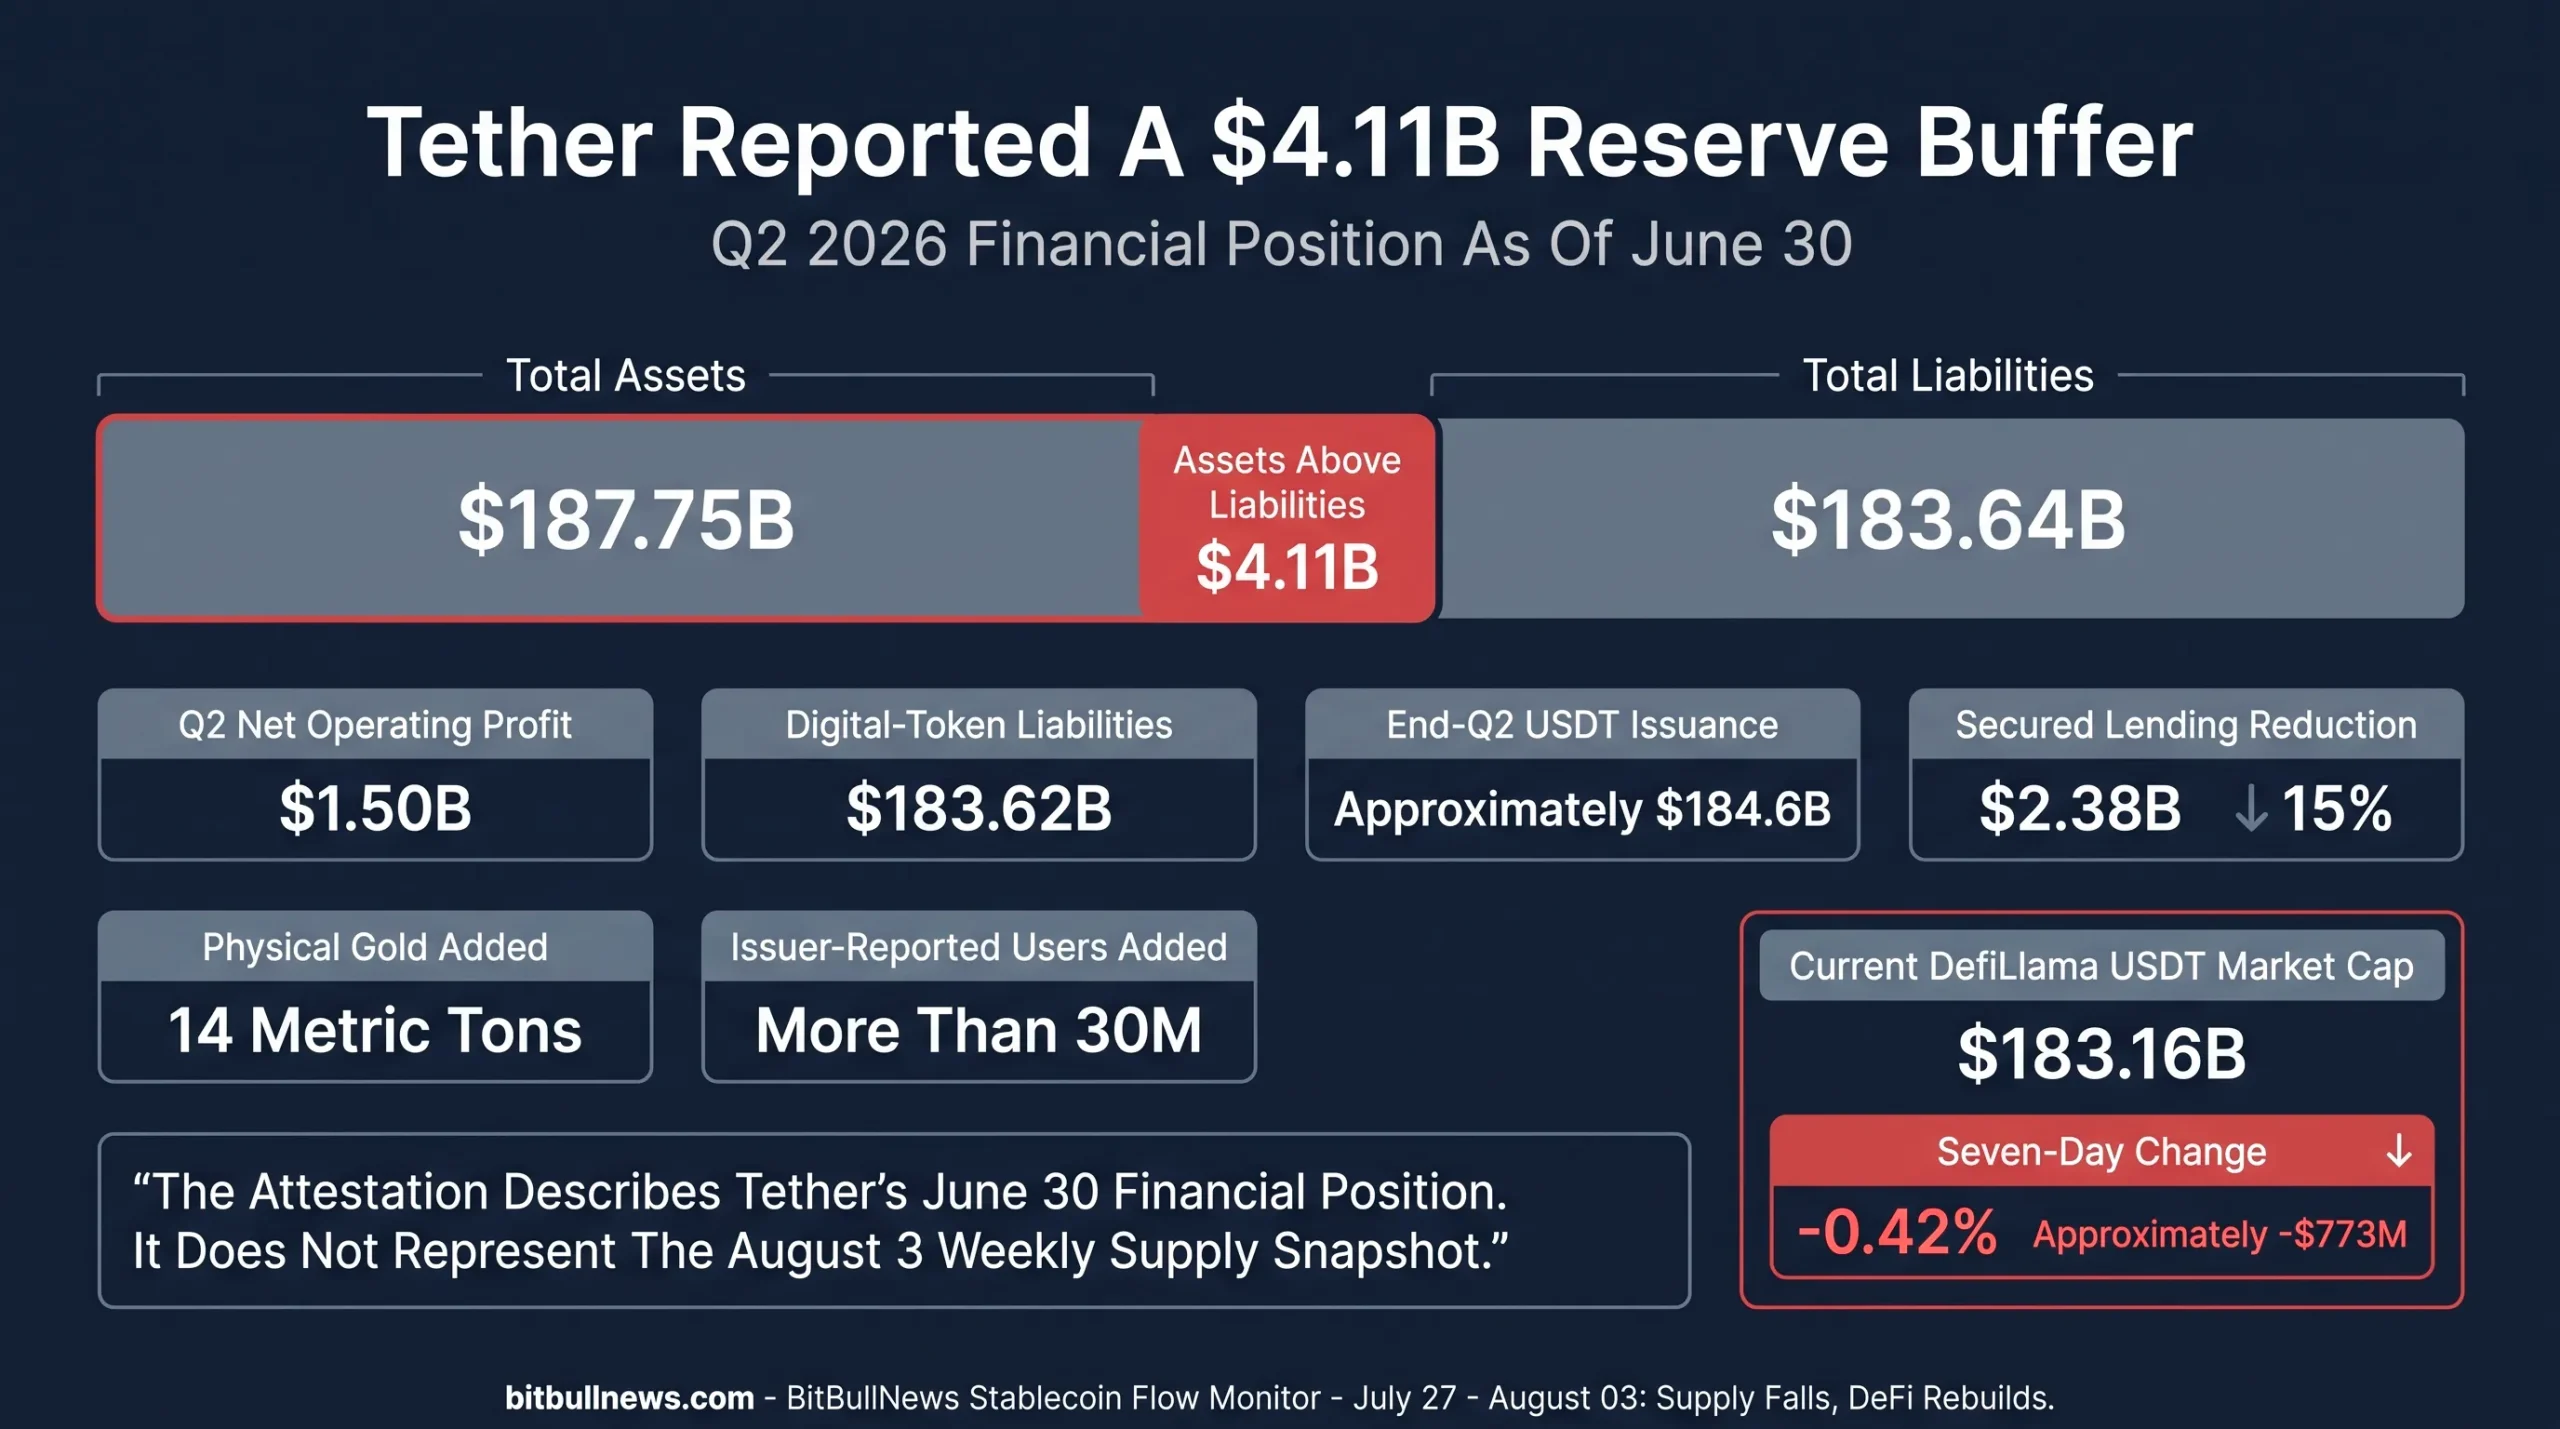
The attestation and the weekly supply contraction are not contradictory.
The attestation describes Tether’s financial position on June 30. DefiLlama’s seven-day change describes the market value and distribution of USDT at the August 3 snapshot.
USDT could contract by approximately $773 million during the week while remaining fully backed under the issuer’s reported reserve position.
The more relevant risk indicator was peg stability. USDT continued trading near $1. There was no evidence of a market-wide run or persistent depeg in the available data.
Institutional Infrastructure Advanced Despite Lower Supply
BNY launched its Digital Transfer Agency capabilities on July 29.
The platform supports digitally native funds across issuance, recordkeeping and servicing. BNY said fiat and stablecoin subscriptions and redemptions would be enabled through mint-and-burn capabilities inside its ecosystem. Initial users and planned issuers include BNY Investments Dreyfus, Baillie Gifford and BlackRock.
BlackRock is expected to use the system for BSTBL, a tokenized money-market-fund share class designed to meet stablecoin reserve requirements. BNY is also launching BLIQUID, while Baillie Gifford has already introduced BAGEY as a fully native UK-regulated tokenized fund.
This matters for the stablecoin market even though these products are securities rather than payment stablecoins.
Reserve frameworks increasingly require issuers to hold cash, Treasury instruments and other high-quality liquid assets. Tokenized money-market funds can become operational components of that reserve and treasury infrastructure.
Supply fell this week. Institutional settlement and reserve-management rails continued expanding.
Peg Stability Held
The largest payment stablecoins remained at or close to $1.
The week’s contraction therefore reflected reduced outstanding value and network reallocation, not a broad loss of price confidence.
Yield-bearing products require a different interpretation.
USYC traded near $1.13 and USDY near $1.14 because their net asset values accrue income. Those prices do not represent depegs from a fixed $1 redemption target.
BUIDL targets a stable $1 value while distributing accrued income through additional tokens. It is also restricted to approved investors.
Stablecoin monitoring must separate:
- Fixed-price payment stablecoins.
- Yield-bearing tokenized funds.
- Crypto-backed synthetic dollars.
- Restricted institutional cash products.
- Tokens whose market value changes with accrued income.
Grouping every product under one “stablecoin supply” number is useful for market sizing. It is not sufficient for risk analysis.
What Treasury Managers Should Watch Next
Whether USDC Stabilizes On Solana
Solana USDC lost approximately $764 million after adding about $521 million during the previous monitoring period.
A second large decline would suggest the earlier inflow was temporary. Stabilization would support the interpretation that this was a discrete treasury or exchange-liquidity adjustment.
Whether Ethereum DeFi Growth Persists
Ethereum added $680 million of tracked stablecoin TVL while its tracked supply fell by $1.40 billion.
That is the strongest constructive signal in the report. Another week of higher utilization would indicate genuine rebuilding rather than a short-lived repositioning.
Whether USDT Returns To Net Issuance
Tether’s Q2 attestation showed a substantial reserve buffer and profitable reserve portfolio. Current USDT supply still declined by an estimated $773 million.
Renewed issuance would show that reserve strength is translating back into market demand.
Whether RLUSD Rebuilds On XRP Ledger
RLUSD expanded on Ethereum but contracted sharply on XRP Ledger.
The next report should determine whether this was a one-off redemption event, a change in network allocation or the beginning of a more persistent reduction in XRPL-based supply.
Whether USDG Maintains Multichain Growth
USDG produced the largest positive dollar change among the major products and expanded across X Layer, Solana and Ethereum.
Continued growth across several networks would be stronger than expansion concentrated in one venue.
Whether Solana’s DeFi Balance Recovers
Solana utilization increased only because stablecoin supply fell faster than its DeFi balance.
The stronger signal would be growth in both outstanding supply and capital deposited into lending and liquidity protocols.
Whether BUIDL Continues Expanding During Payment-Stablecoin Contraction
BUIDL added approximately $49 million as USDC and USDT contracted.
Continued divergence would indicate that institutional demand is favoring yield-bearing tokenized cash over non-yielding transactional balances.
Whether BNY’s New Infrastructure Produces Live Stablecoin Activity
The platform can support stablecoin subscriptions, redemptions and digitally native fund servicing.
The next evidence should be measurable: fund assets, stablecoin settlement volume, number of institutional users and onchain mint-and-burn activity.
Stablecoin Risk Dashboard
| Signal | Current Reading | Interpretation | Confirmation Needed |
|---|---|---|---|
| Total Stablecoin Market Cap | $307.34B, -0.82% Over Seven Days | Market returned to net contraction | Supply stabilizes or resumes growth |
| USDT Market Cap | $183.16B, -0.42% | Largest stablecoin contracted moderately | Renewed issuance without weaker reserve quality |
| USDC Market Cap | $71.97B, -2.03% | Main source of market contraction | Stabilization on Ethereum and Solana |
| USDT And USDC Share | 83.01% | Market concentration remained extreme | Credible smaller products gain durable share |
| Ethereum Stablecoin Supply | $147.31B, -1.12% | Broad decline across USDT, USDC and USDe | Supply stabilizes while DeFi utilization remains higher |
| Solana Stablecoin Supply | $15.64B, -4.21% | Reversed most of the prior week’s inflow | USDC stabilizes and network deployment grows |
| Solana USDC | $6.85B, -10.04% | Largest single network-product contraction | Rebuilding without dependence on incentives |
| XRP Ledger Supply | $853.37M, -14.61% | RLUSD redemptions dominated the decline | RLUSD returns to net issuance |
| RLUSD Supply | $1.46B, -7.94% | Ethereum growth did not offset XRPL contraction | Balanced expansion across both networks |
| USDG Supply | $3.36B, +3.62% | Strongest major positive dollar move | Continued multichain adoption and usage |
| BUIDL Supply | $2.69B, +1.85% | Institutional tokenized cash expanded | Growth persists across approved-investor channels |
| Tracked Stablecoin Supply | $253.32B, -0.88% | Stableflows’ available-liquidity base declined | Supply stabilizes |
| Tracked DeFi Stablecoin TVL | $9.76B, +7.1% | Productive deployment rebuilt | Growth continues beyond Ethereum |
| DeFi Utilization | 3.9% | Higher share of remaining liquidity entered DeFi | Utilization improves without excessive leverage |
| Ethereum DeFi Stablecoin TVL | $7.20B, +10.4% | Drove the market-wide recovery | Deposits remain after short-term incentives change |
| Solana DeFi Stablecoin TVL | $943.47M, -2.3% | Utilization rose through supply contraction | Absolute deployed capital returns to growth |
| Tether Reserve Buffer | $4.11B At June 30 | Issuer reported assets above liabilities | Future attestations confirm liquidity and asset quality |
| Peg Stability | Major Payment Stablecoins Near $1 | No broad confidence event | Redemption liquidity remains reliable under stress |
The Utilization Divergence
Stablecoin supply fell this week. DeFi deployment recovered.
Total stablecoin market capitalization declined by approximately $2.55 billion to $307.34 billion. USDC generated an estimated $1.49 billion of the loss. USDT contributed another $773 million. Together, the two leaders explained almost 89% of the market contraction.
USDC’s network reversal was the central event.
Solana USDC lost approximately $764 million after helping drive the network’s $1.16 billion expansion one week earlier. Ethereum USDC lost another $712 million. Arbitrum absorbed around $121 million, but the gain was too small to change the category-level result.
Solana’s total stablecoin supply fell by $687 million. The decline was narrower than the headline suggested because USDT, BUIDL, USDG, USDGO and PYUSD all expanded. Solana did not lose every type of dollar liquidity. It lost a large USDC position.
Ethereum experienced the broader withdrawal. USDT, USDC, USDe and USD1 all contracted.
RLUSD produced another concentrated network move. XRP Ledger lost approximately $135 million of RLUSD while Ethereum added around $9 million.
The positive side belonged to smaller and more specialized products. USDG added an estimated $117 million across several networks. BUIDL gained around $49 million. PYUSD, United Stables U and YLDS also expanded.
The deployment data was more constructive.
Stableflows’ tracked supply fell by $2.26 billion, but stablecoin TVL inside selected DeFi protocols increased by $650 million. Utilization rose from 3.6% to 3.9%. Ethereum drove the recovery with a $680 million increase.
Solana did not share that strength. Its utilization rose only because supply contracted faster than DeFi TVL.
Tether’s Q2 attestation added a separate balance-sheet signal. The issuer reported $187.75 billion of assets, $183.64 billion of liabilities and a $4.11 billion reserve buffer. That financial position coexisted with a modest weekly USDT contraction and a stable market price.
BNY’s new digital transfer-agency platform showed that institutional infrastructure continued advancing even as aggregate supply declined. Stablecoin minting, redemption and tokenized reserve products are moving into traditional fund-servicing systems.
The market’s next test is not only whether total supply returns to growth.
It is whether Solana retains the liquidity accumulated during July, whether Ethereum’s DeFi recovery persists and whether expanding products such as USDG and BUIDL convert outstanding value into sustained payment, settlement and treasury activity.
Data Sources & References
- DefiLlama Stablecoin Market Dashboard
- DefiLlama Stablecoins By Chain
- DefiLlama USDT Data
- DefiLlama USDC Data
- DefiLlama PYUSD Data
- DefiLlama USDG Data
- DefiLlama USDGO Data
- DefiLlama RLUSD Data
- DefiLlama USD1 Data
- DefiLlama USDe Data
- DefiLlama BUIDL Data
- Stableflows DeFi Utilization Dashboard
- Tether Q2 2026 Attestation Announcement
- Ripple Mint
- BNY Digital Transfer Agency Launch
- BNY Stablecoin Enablement And USDC Support