



Content
Bitcoin’s July options expiry removed a large block of outstanding exposure. It did not leave the market underleveraged.

Aggregate Bitcoin options open interest fell from $34.13 billion on July 29 to $26.74 billion at the August 5 reporting cutoff, a snapshot decline of $7.39 billion, or 21.65%. The contracts that had dominated the July 31 expiry — particularly the $70,000 and $72,000 calls — disappeared from the largest open-interest rankings after expiring out of the money.
Futures exposure rebuilt quickly. CoinGlass showed $49.23 billion of Bitcoin futures open interest, up 2.43% over 24 hours, against $48.34 billion of futures volume and only $3.07 billion of spot volume. Ether carried another $26.26 billion of futures open interest. Funding remained modest and mixed across major venues rather than showing a one-sided leveraged-long rush.
The spot market did not confirm a decisive breakout.
Bitcoin’s Coin Metrics New York close fell 0.76% from July 29 to August 4, ending at $64,263.45. Ether lost 2.42% to $1,875.87 and underperformed Bitcoin by approximately 1.66 percentage points. ETH also retained the higher three-month realized volatility at 52.10%, compared with 36.37% for BTC.
Institutional wrapper demand improved. U.S. spot Bitcoin ETFs attracted $381.4 million across the five completed sessions from July 29 through August 4. Ether products added $30.1 million. BlackRock supplied more than the entire net increase in both categories after outflows from several competing products.
CME positioning showed a separate adjustment. Leveraged funds reduced their net shorts in both standard Bitcoin and Ether futures, while asset managers became less constructive. The result was not a unified institutional risk-on signal. It was a rotation between investor types and trading strategies.
The market entered August with less expiry-related options exposure, rising futures open interest, positive ETF demand and no obvious funding-rate excess.
That combination can support a breakout. It can also create a sharper liquidation event if futures leverage expands without stronger spot participation.
Data Scope And Cutoff
Completed price data uses Coin Metrics New York closes from July 29 through August 4. August 5 had not completed a New York benchmark session at the BitBullNews reporting cutoff.
ETF figures include the five completed U.S. trading sessions from July 29 through August 4.
CFTC positioning reflects futures positions held on July 28, the latest report available during the monitoring period.
CoinGlass futures, funding, options and liquidation metrics are live snapshots captured during the August 5 reporting cutoff. These values update continuously and should not be treated as fixed daily closes.
Different providers cover different exchanges, collateral types and contract structures. CoinGlass futures open interest should not be mechanically combined with CME contract counts or Deribit-only options data.
Market Structure Scorecard
| Metric | Bitcoin | Ether | Market Read |
|---|---|---|---|
| Period Return | -0.76% | -2.42% | ETH underperformed BTC by approximately 1.66 percentage points |
| Latest Completed NY Close | $64,263.45 | $1,875.87 | Both assets recovered from their July 31 lows |
| Period High | $65,311.84 | $1,934.64 | Highs were reached on July 30 |
| Period Low | $62,222.27 | $1,820.79 | Both markets reached their lows around the July expiry |
| Three-Month Realized Volatility | 36.37% | 52.10% | ETH remained the higher-risk underlying |
| Live Futures Open Interest | $49.23B | $26.26B | Large outstanding linear exposure remained |
| Twenty-Four-Hour Futures Volume | $48.34B | $26.77B | Derivatives turnover remained far above spot turnover |
| Futures-To-Spot Volume Ratio | Approximately 15.75x | Approximately 23.90x | ETH price discovery was especially derivatives-heavy |
| U.S. Spot ETF Flow | +$381.4M | +$30.1M | Regulated spot-wrapper demand was positive |
| Standard CME Open Interest | 20,019 Contracts | 23,853 Contracts | BTC OI fell while ETH OI increased |
| CME Asset-Manager Net Position | +2,299 Contracts | -3,472 Contracts | Asset managers remained long BTC but short ETH |
| CME Leveraged-Fund Net Position | -6,873 Contracts | -5,396 Contracts | Leveraged funds covered shorts in both markets |
| BTC Options Open Interest | $26.74B | Not Used | BTC options exposure fell sharply after July expiry |
| BTC Options Call Share | 62.11% | Not Used | Outstanding options remained call-heavy |
| BTC Options Put Share Of Volume | 51.04% | Not Used | Current flow leaned slightly toward puts |
Bitcoin Recovered Most Of The Expiry Selloff
Bitcoin closed July 29 at $64,754.98 before falling below $63,000 on July 30. It reached a period low of $62,222.27 on July 31, when the large monthly options book expired.
BTC then recovered gradually, closing at $63,380.18 on August 1, $63,820 on August 2 and $64,241.01 on August 3. The August 4 New York close of $64,263.45 left the asset only 0.76% below its starting level.
Ether followed the same broad path but recovered less.
ETH fell from $1,922.33 on July 29 to $1,835.56 on July 31. It returned to $1,875.87 by the latest completed close but remained 2.42% lower over the period.
Daily BTC And ETH Performance
| Date | BTC Close | BTC Index | ETH Close | ETH Index |
|---|---|---|---|---|
| July 29 | $64,754.98 | 100.00 | $1,922.33 | 100.00 |
| July 30 | $62,904.77 | 97.14 | $1,865.83 | 97.06 |
| July 31 | $62,475.86 | 96.48 | $1,835.56 | 95.49 |
| August 1 | $63,380.18 | 97.88 | $1,880.06 | 97.80 |
| August 2 | $63,820.00 | 98.56 | $1,868.73 | 97.21 |
| August 3 | $64,241.01 | 99.21 | $1,875.15 | 97.55 |
| August 4 | $64,263.45 | 99.24 | $1,875.87 | 97.58 |
Each index begins at 100 at the July 29 New York close.
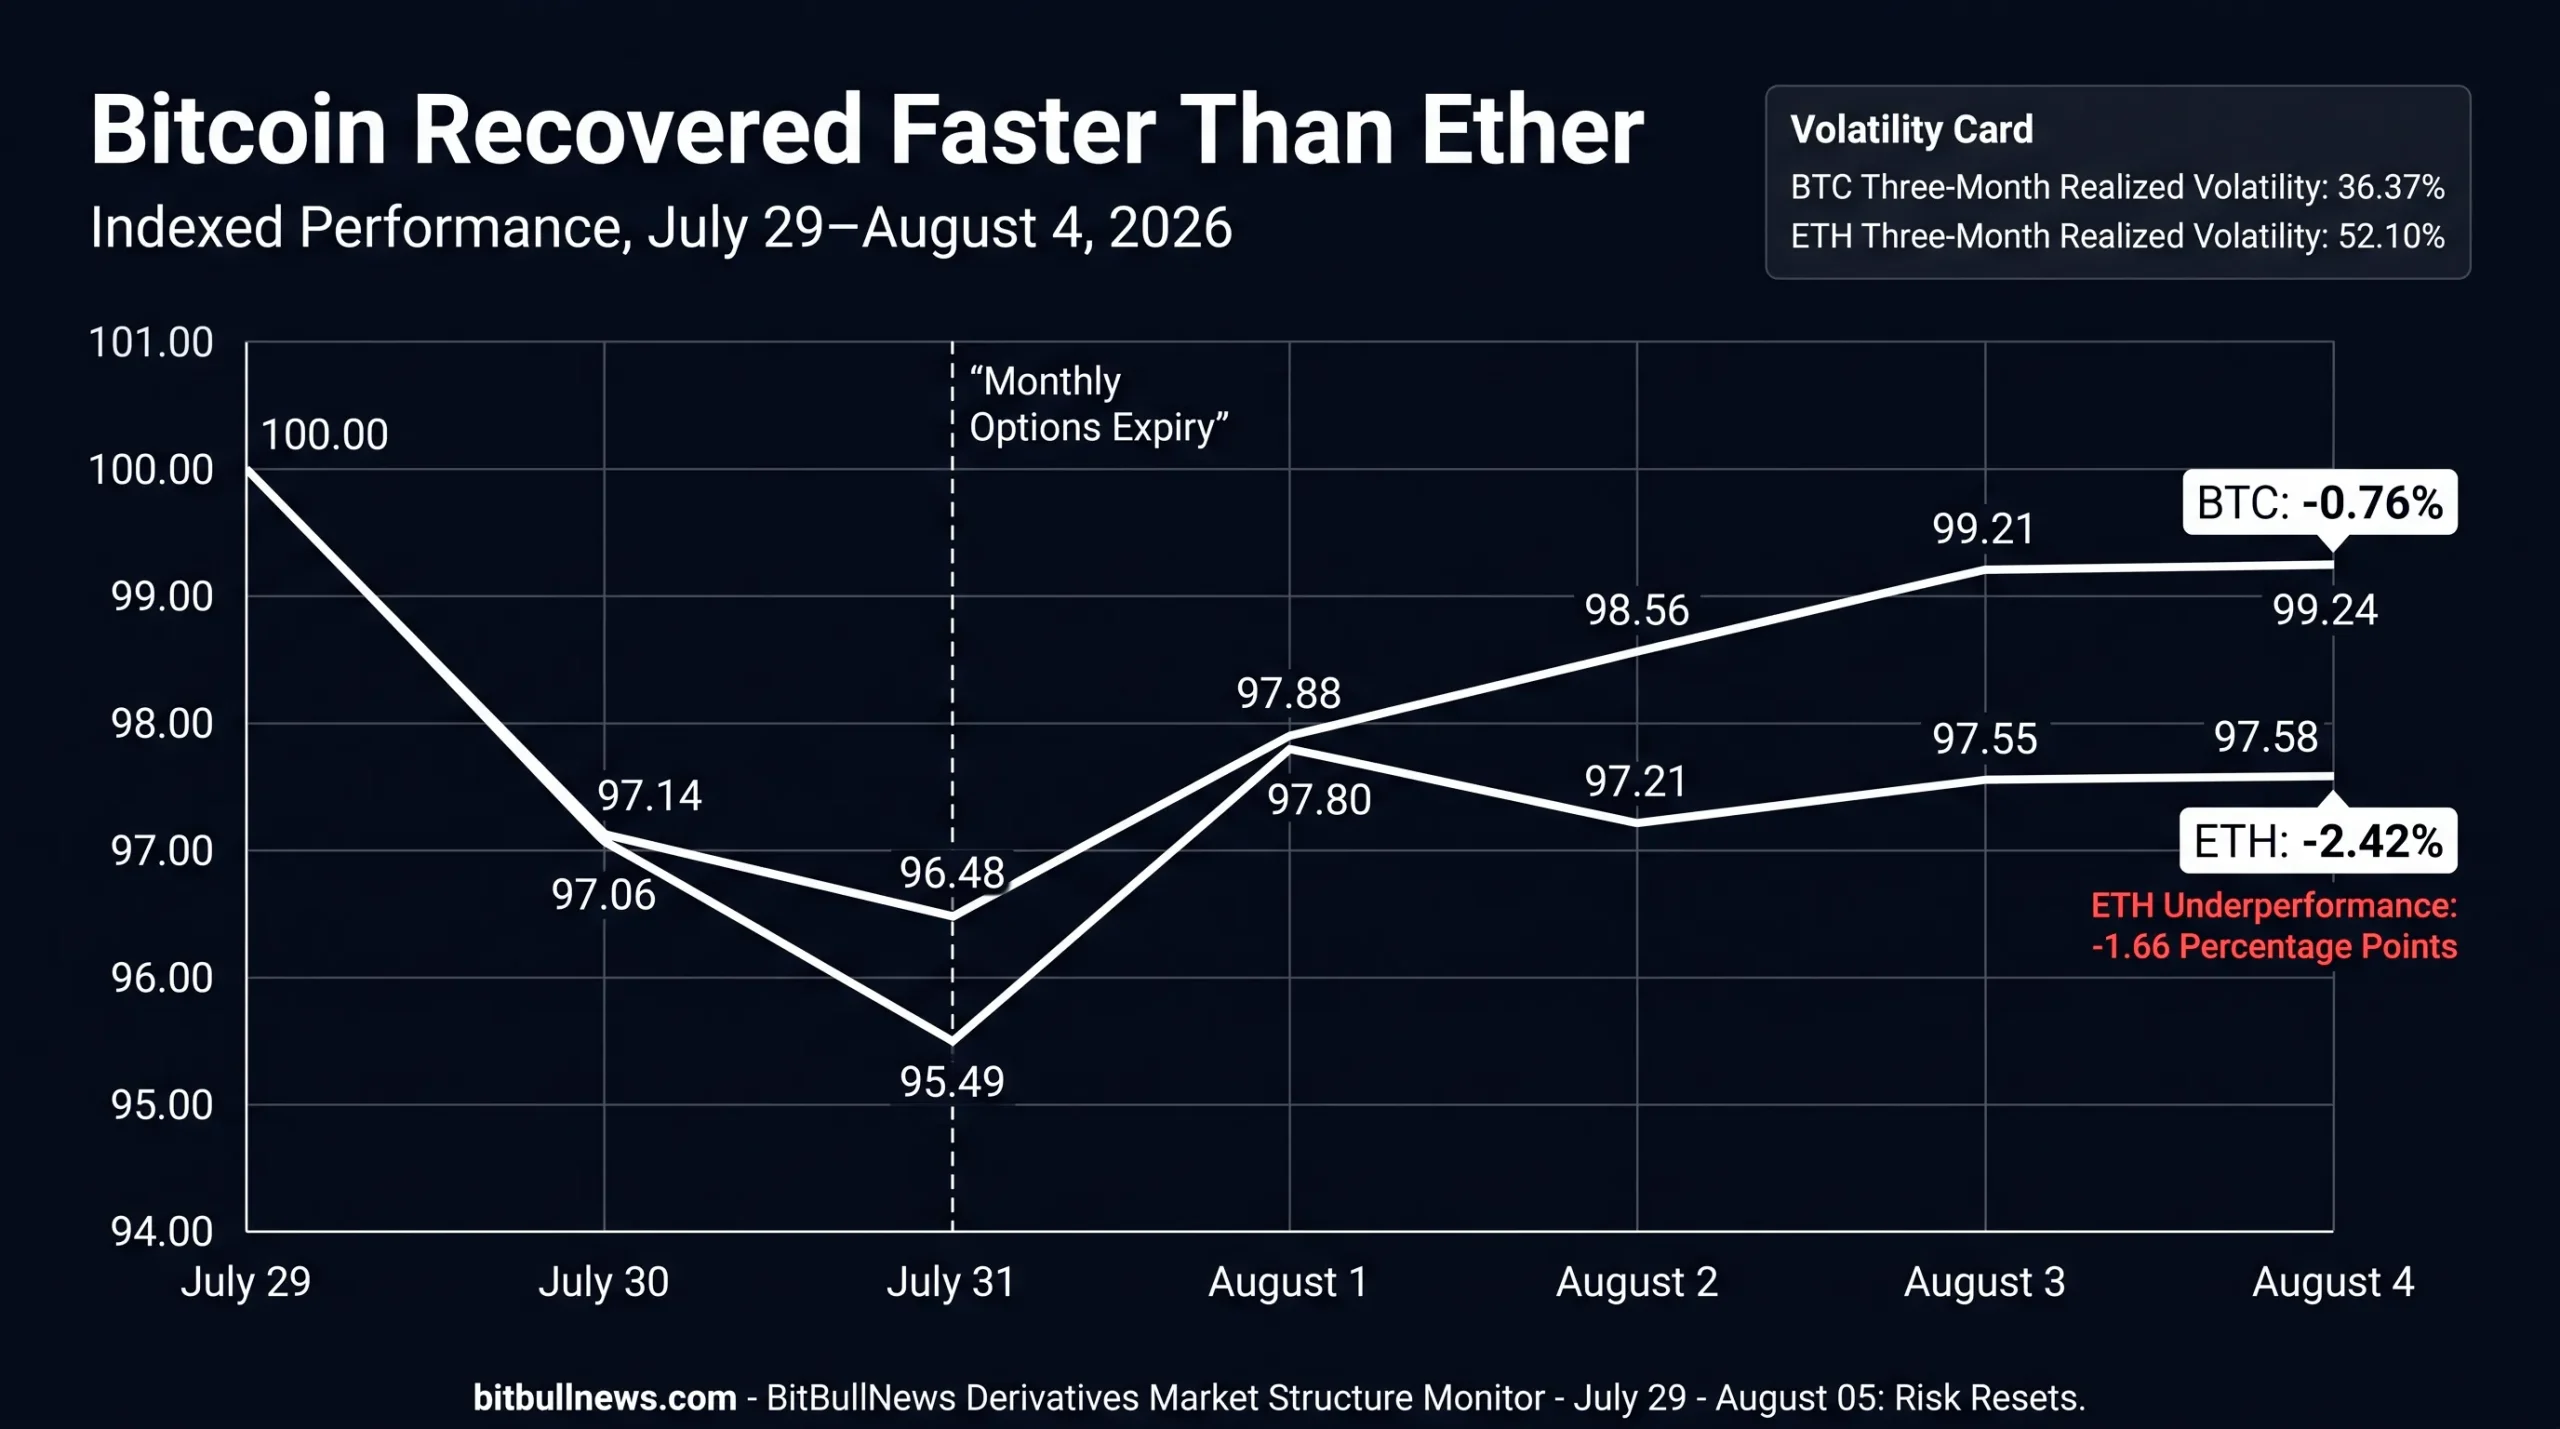
The recovery reduced the visible weekly loss. It did not erase the structural difference between the two assets.
Bitcoin’s three-month realized volatility stood at 36.37%. Ether’s was 52.10%. ETH therefore delivered the weaker return while retaining approximately 43% more realized volatility than BTC.
That matters for cross-asset positioning. A relative-value trade favoring Ether requires either stronger directional upside or compensation through staking, options premium or another source of carry. This period delivered none of those through price alone.
Futures Leverage Rebuilt Into The Recovery
CoinGlass showed $49.23 billion of Bitcoin futures open interest at the August 5 cutoff. Twenty-four-hour futures volume reached $48.34 billion, compared with $3.07 billion of spot volume.
Ether futures open interest stood at $26.26 billion. Futures volume reached $26.77 billion against $1.12 billion of spot turnover.
Live Linear Derivatives Snapshot
| Metric | Bitcoin | Ether | Interpretation |
|---|---|---|---|
| Live Price At Capture | Approximately $64,287 | Approximately $1,867 | Both assets were trading above their July 31 lows |
| Futures Open Interest | $49.23B | $26.26B | Large outstanding leverage remained |
| Twenty-Four-Hour Futures Volume | $48.34B | $26.77B | Active turnover across perpetual and dated contracts |
| Twenty-Four-Hour Spot Volume | $3.07B | $1.12B | Spot turnover remained much smaller |
| Futures-To-Spot Volume Ratio | 15.75x | 23.90x | ETH turnover was particularly derivatives-dominated |
| Three-Month Realized Volatility | 36.37% | 52.10% | ETH remained the higher-volatility market |
| Twenty-Four-Hour Liquidations | $35.52M | $17.22M | Forced closure remained contained relative to total OI |
| Dominant Liquidation Side | Shorts | Shorts | The recovery forced bearish positions to close |
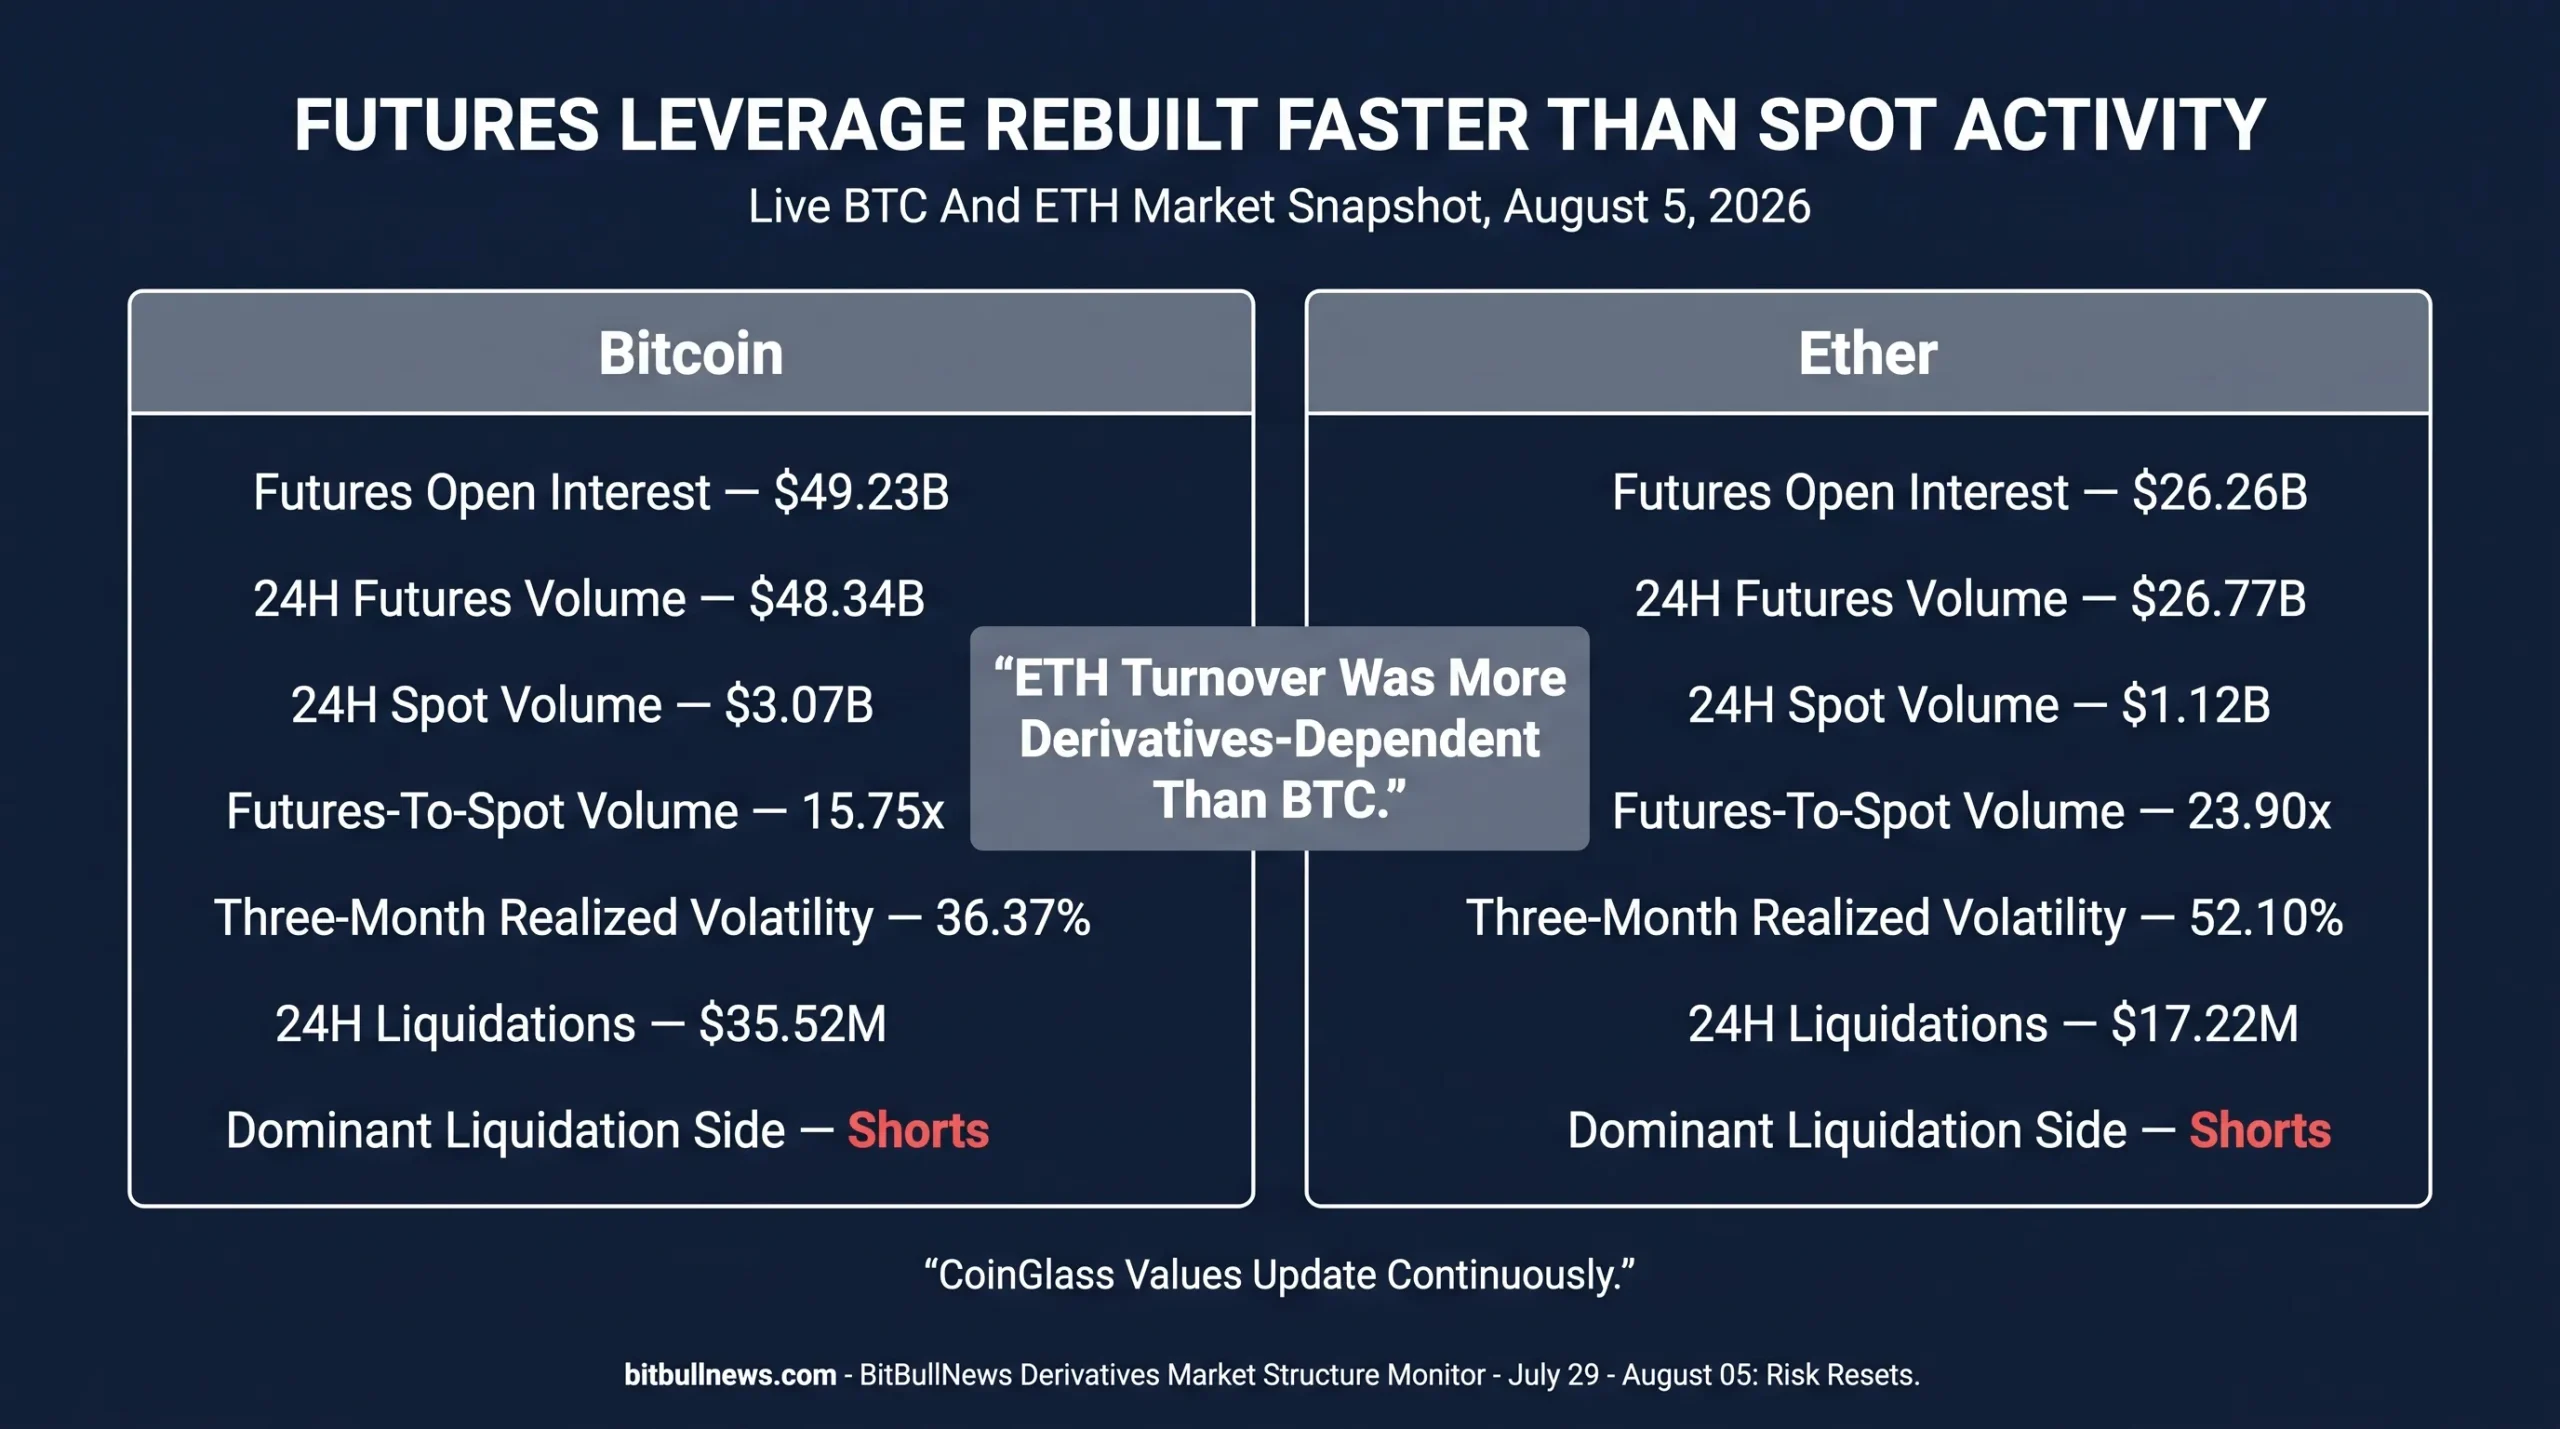
The high futures-to-spot ratios do not prove that every futures trade was speculative. Derivatives volume includes hedges, basis trades, market-making activity and rapid intraday turnover.
The ratios do show where price discovery was concentrated.
A market led by derivatives can move efficiently when liquidity is deep. It can also produce sharper price reactions when open interest rises faster than the spot market’s ability to absorb forced orders.
Funding Remained Positive But Not Crowded
Bitcoin perpetual funding was mixed across venues at the reporting cutoff.
CoinGlass showed approximately:
- Binance: +0.0013%.
- OKX: +0.0041%.
- Bybit: +0.0066%.
- Bitget: -0.0008%.
- Gate: +0.0035%.
- Deribit: 0.0000%.
Ether funding was also mixed, including +0.0027% on Binance, -0.0004% on OKX and +0.0010% on Bybit. Settlement intervals differ by exchange, so these figures should not be annualized under one assumption.
The pattern was mildly constructive rather than overheated.
Longs paid shorts on several major exchanges, but rates remained close to neutral and some venues were negative. That is different from a broad leverage chase in which positive funding expands simultaneously across nearly every large market.
The immediate risk comes from the combination of rising open interest and moderate funding.
It suggests leverage can continue building before the cost of holding longs becomes an obvious restraint.
CME Funds Covered Shorts While Asset Managers Turned Defensive
The CFTC’s latest Traders in Financial Futures report covered positions held on July 28.
Standard CME Bitcoin futures open interest fell by 508 contracts to 20,019. Standard Ether futures open interest increased by 186 contracts to 23,853.
The category-level changes were more informative than total open interest.
CME Standard Futures Positioning
| Contract | Open Interest | Weekly OI Change | Asset-Manager Net | Weekly Net Change | Leveraged-Fund Net | Weekly Net Change |
|---|---|---|---|---|---|---|
| Bitcoin Futures | 20,019 | -508 | +2,299 | -428 | -6,873 | +1,076 |
| Ether Futures | 23,853 | +186 | -3,472 | -1,052 | -5,396 | +1,657 |
Net position equals reported long contracts minus reported short contracts. A positive weekly change represents movement toward a larger net long or a smaller net short. BTC and ETH contracts have different sizes and should not be compared as equivalent notional exposure.
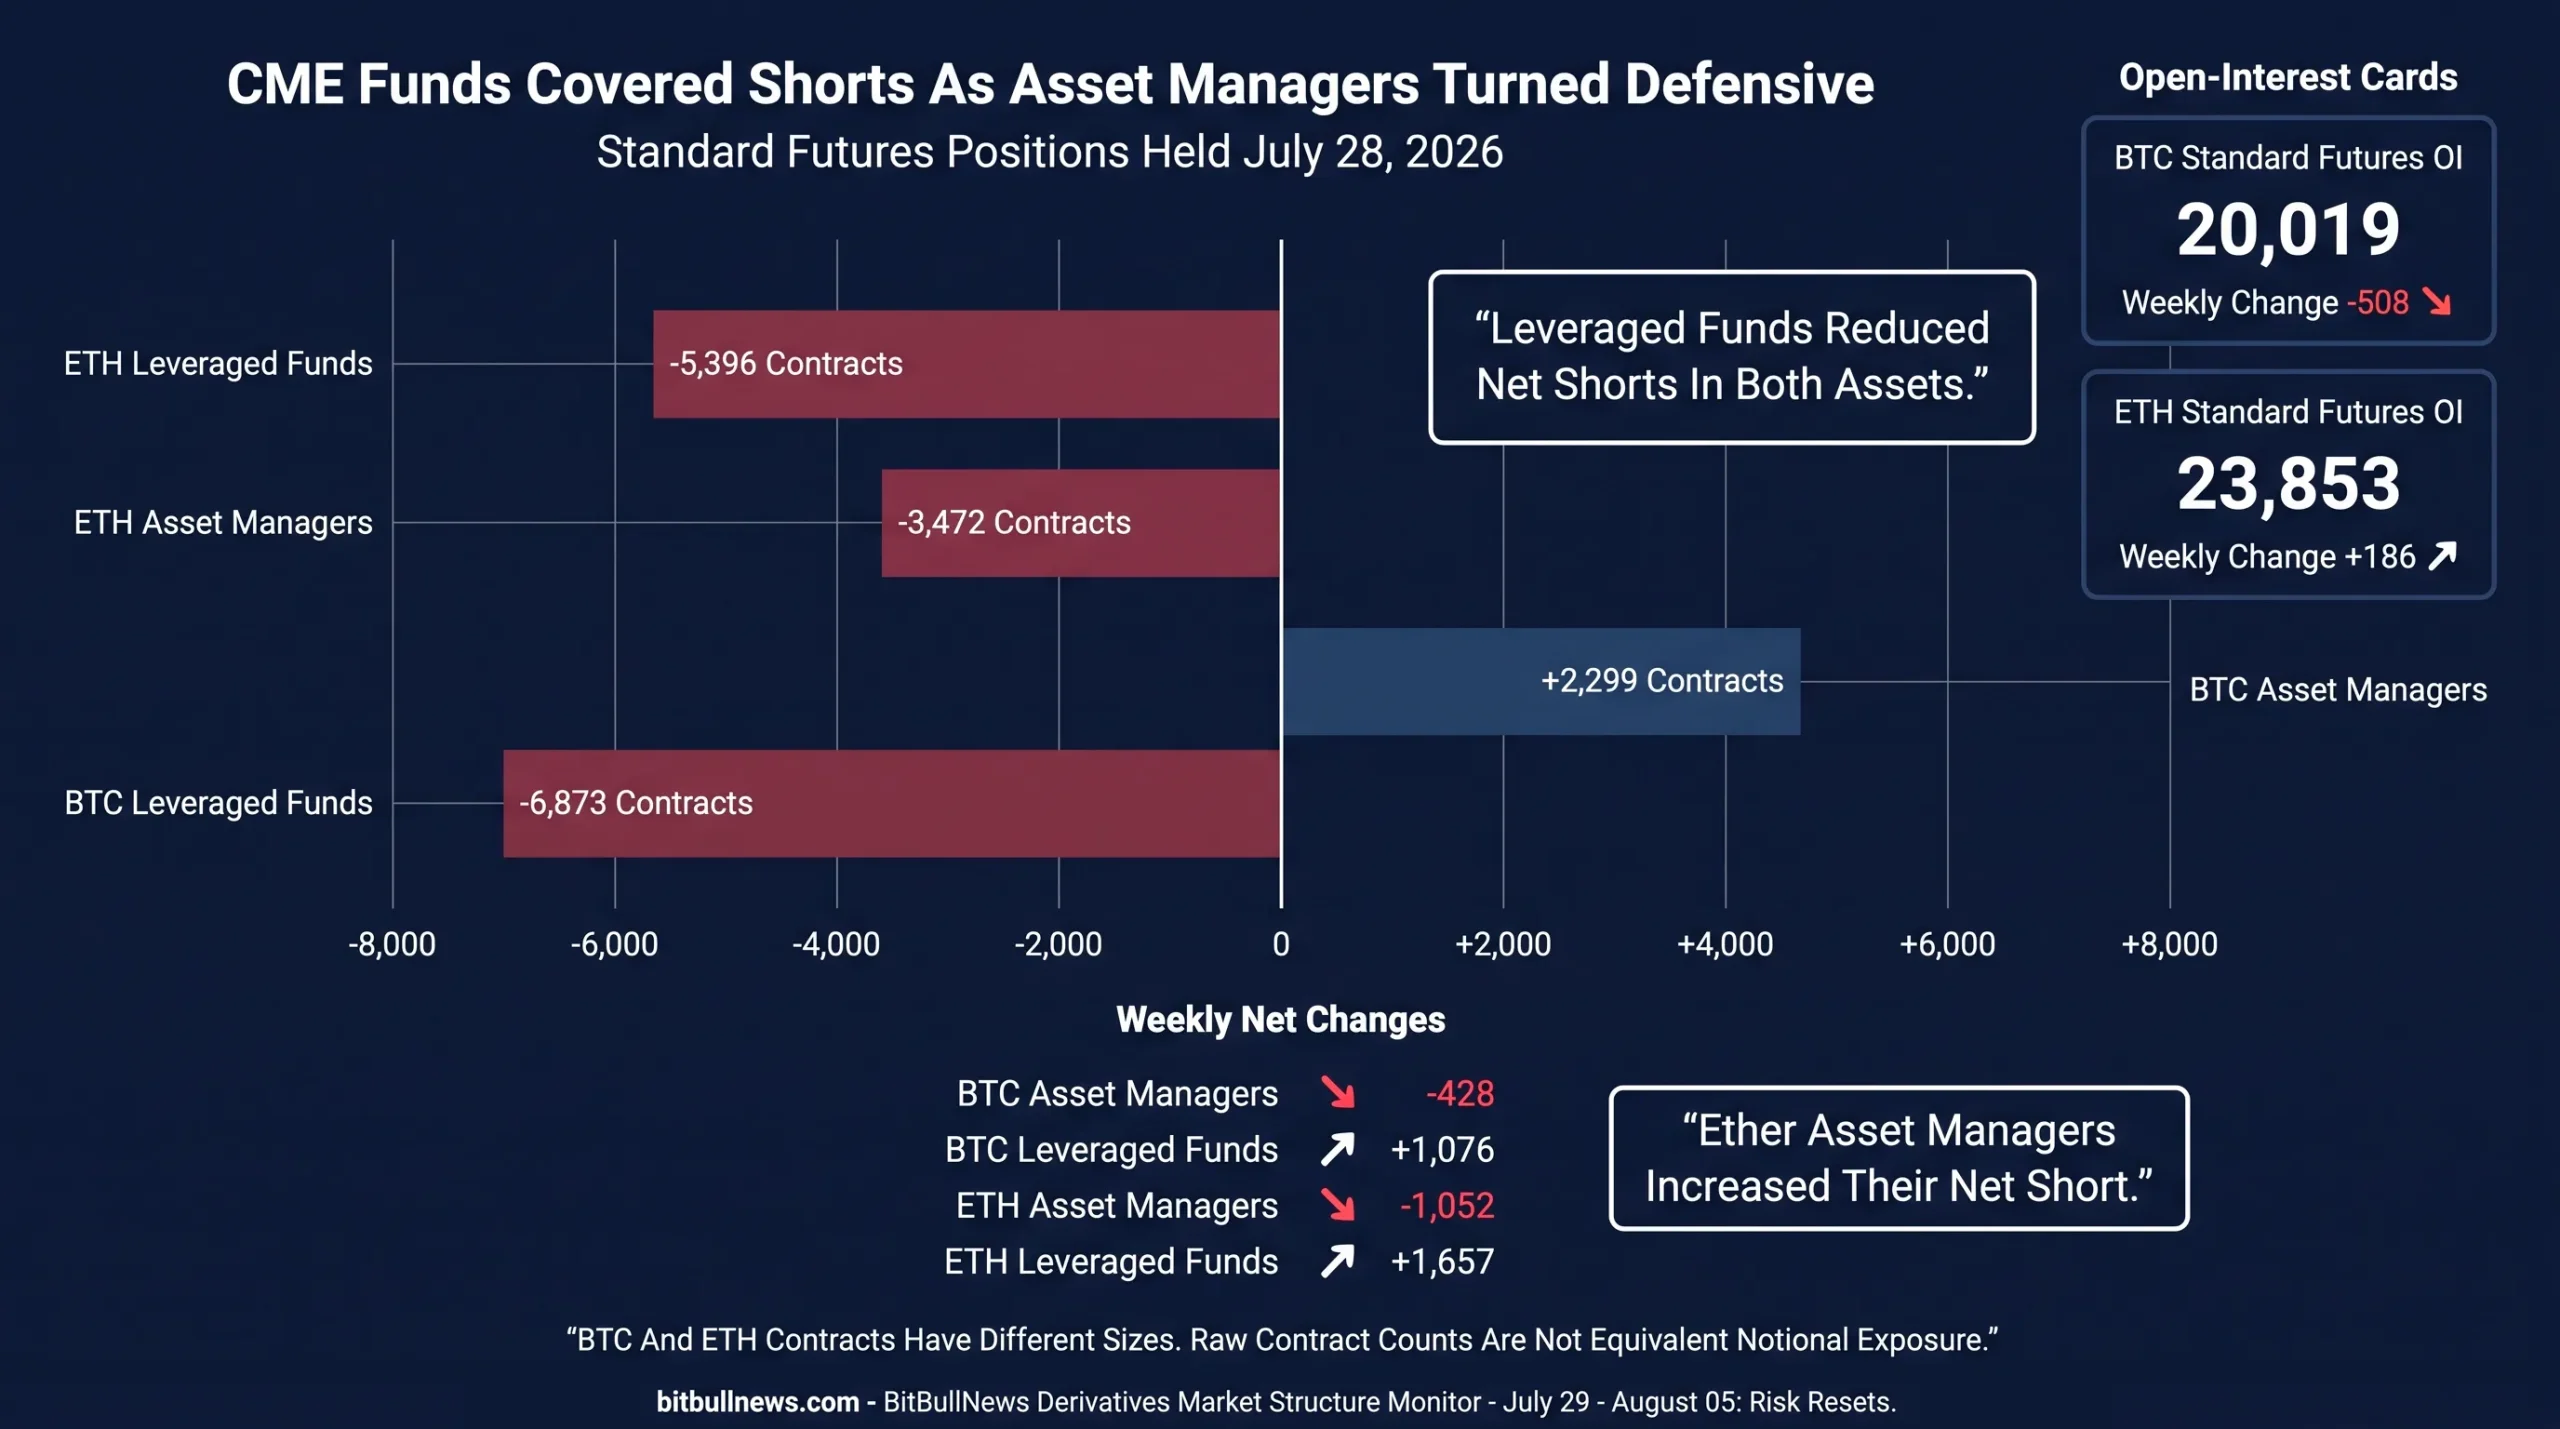
Bitcoin asset managers remained net long but reduced that exposure by 428 contracts.
Ether asset managers moved further short, increasing their negative net position by 1,052 contracts to -3,472. That change was consistent with ETH’s weaker relative performance, although the CFTC report does not reveal whether the positions were outright directional trades or hedges against other holdings.
Leveraged funds moved the other way.
Their Bitcoin net short narrowed by 1,076 contracts. Their Ether net short narrowed by 1,657 contracts.
Short covering from leveraged funds can support price even when long-only institutional positioning weakens. It is not equivalent to fresh strategic buying.
The CME data therefore showed two separate institutional behaviors:
- Asset managers reduced directional confidence.
- Leveraged funds reduced bearish exposure.
The July Expiry Removed $7.39 Billion Of Options OI
Bitcoin options open interest stood at $34.13 billion on July 29, two days before the monthly expiry.
At the August 5 cutoff, CoinGlass reported $26.74 billion. The snapshot-to-snapshot decline was $7.39 billion, or 21.65%.
The timing strongly indicates that expiry and post-expiry contract roll-off produced a substantial part of the decline. Aggregate public data does not identify exactly how much was settled, closed early, rolled forward or changed due to Bitcoin’s market price.
Bitcoin Options Reset
| Options Metric | July 29 Snapshot | August 5 Snapshot | Change |
|---|---|---|---|
| Total Options Open Interest | $34.13B | $26.74B | -$7.39B, -21.65% |
| Twenty-Four-Hour Options Volume | $3.16B | $2.59B | Approximately -$570M |
| Calls As Share Of Open Interest | 66.03% | 62.11% | -3.92 Percentage Points |
| Puts As Share Of Open Interest | 33.97% | 37.89% | +3.92 Percentage Points |
| Calls As Share Of Daily Volume | 51.34% | 48.96% | -2.38 Percentage Points |
| Puts As Share Of Daily Volume | 48.66% | 51.04% | +2.38 Percentage Points |
| Put/Call Open-Interest Ratio | Approximately 0.51 | Approximately 0.61 | Downside share increased |
| Largest Near-Term OI | July 31 $72K And $70K Calls | August 7 $70K And $72K Calls | Upside concentration rolled into the next expiry |
| Largest Longer-Dated OI | December 25 $80K Call | December 25 $80K Call | Year-end upside exposure remained |
| Major Downside OI | Not Among Top Three | December 25 $60K Put | Longer-dated protection became more visible |
The two observations are live snapshots captured at different times of day. Open interest does not identify whether options were purchased or sold.
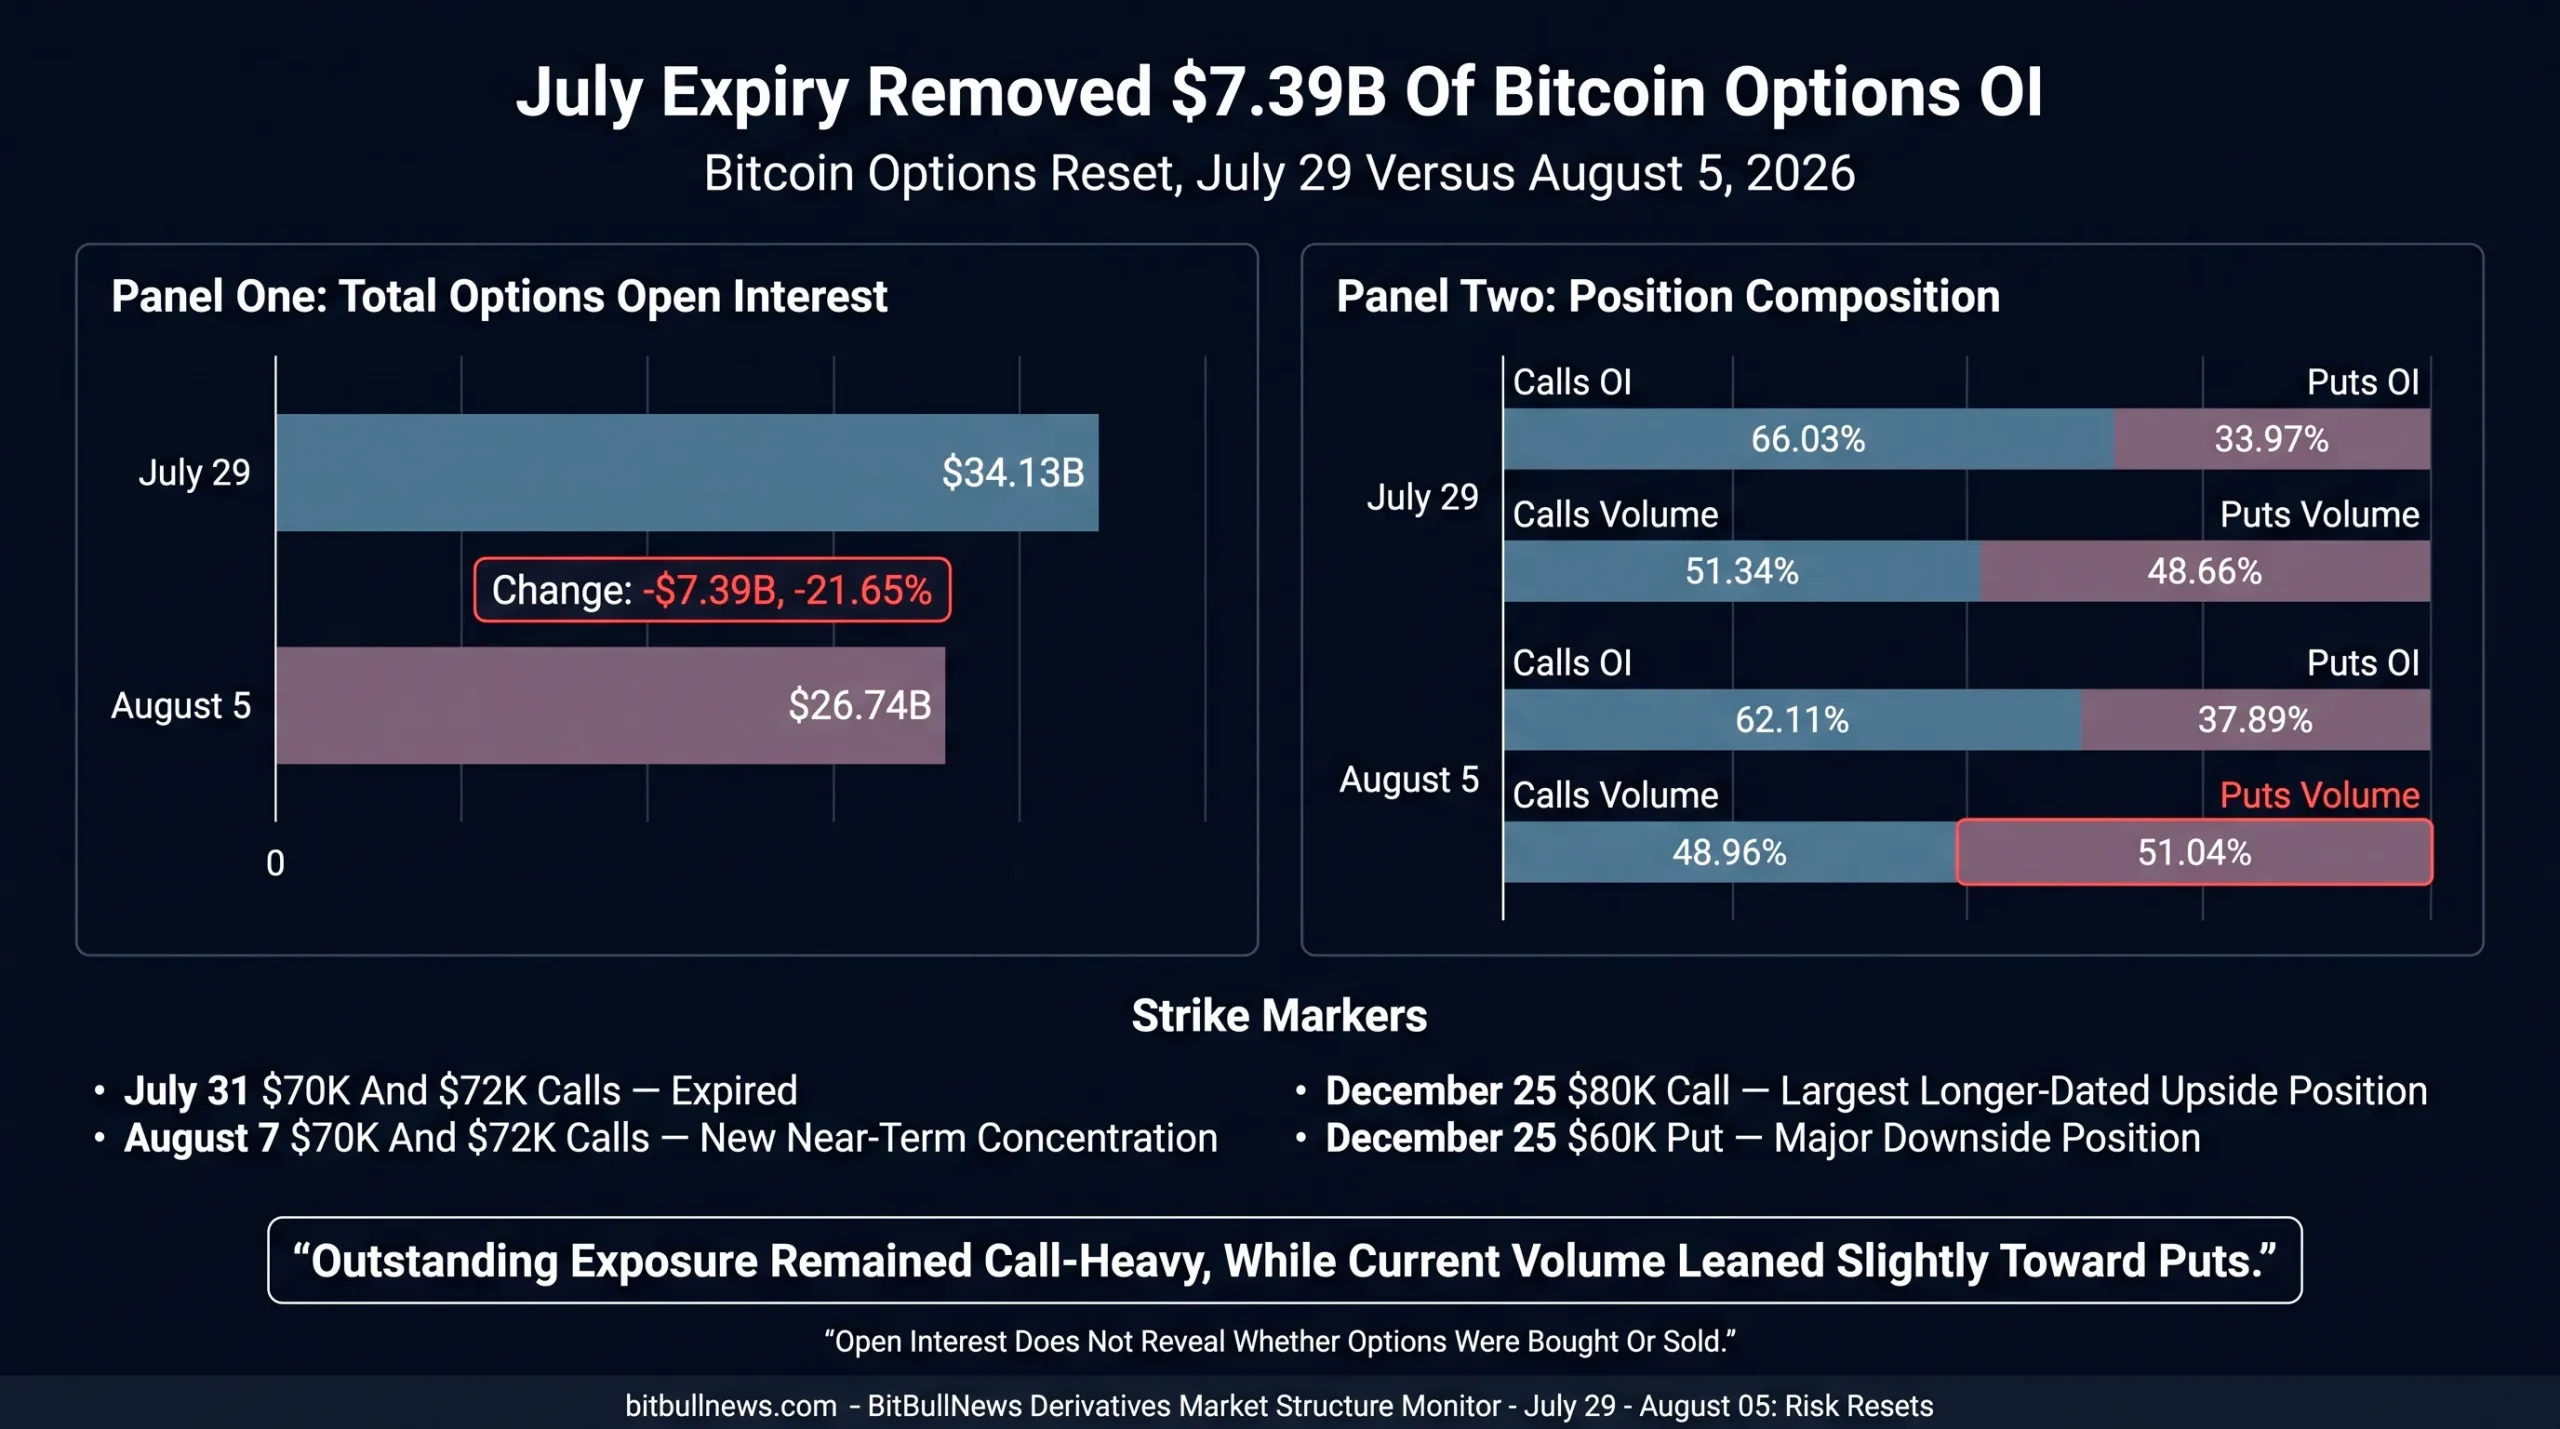
The book remained call-heavy after expiry.
Calls represented 62.11% of current open interest. The largest individual contract was still the December 25 $80,000 call. August 7 calls at $70,000 and $72,000 also ranked among the largest outstanding positions.
Current trading flow was more defensive.
Puts represented 51.04% of 24-hour options volume. The most active contract was an August 28 $57,000 put on Binance, while the December 25 $60,000 put ranked among the largest outstanding positions.
That creates a two-layer structure:
- The accumulated book still favors upside through calls.
- Current turnover is paying more attention to downside protection.
A call-heavy book is not automatically bullish. Calls can be sold through covered-call strategies or used inside spreads. The same limitation applies to puts, which can be sold to express a willingness to buy lower rather than purchased as protection.
The data supports a conclusion about exposure, not dealer direction.
The August 7 Expiry Became The Next Pressure Point
After the July contracts cleared, upside concentration shifted to August 7.
CoinGlass’s largest-contract ranking included approximately 6,614 BTC of open interest in the August 7 $70,000 call and about 5,629 BTC in the $72,000 call. The $70,000 strike sat roughly 9% above Bitcoin’s price at the reporting cutoff.
The concentration does not guarantee that spot will move toward those strikes.
It does make the area relevant for hedging behavior.
A rapid rally can force buying from dealers who are short calls. Dealers who are long calls through customer overwriting may sell into the same move. Public open-interest data does not identify which position dominates.
The correct signal is that the market rebuilt a nearby upside concentration only one week after the July calls expired without value.
ETF Demand Returned Despite Flat Price Performance
U.S. spot Bitcoin ETFs attracted $381.4 million from July 29 through August 4.
The path was volatile. Funds gained $265.2 million over July 29–30, lost $265.4 million on July 31, then attracted $381.6 million over August 3–4.
Ether funds added $30.1 million during the same five sessions.
They recorded positive flows on July 30, July 31 and August 4, while July 29 and August 3 were negative.
U.S. Spot ETF Flow Backdrop
| Trading Date | Bitcoin ETF Flow | Ether ETF Flow | Combined Flow |
|---|---|---|---|
| July 29 | +$32.1M | -$32.9M | -$0.8M |
| July 30 | +$233.1M | +$12.8M | +$245.9M |
| July 31 | -$265.4M | +$9.0M | -$256.4M |
| August 3 | +$170.1M | -$11.9M | +$158.2M |
| August 4 | +$211.5M | +$53.1M | +$264.6M |
| Period Total | +$381.4M | +$30.1M | +$411.5M |
Flows cover completed U.S. sessions from July 29 through August 4.
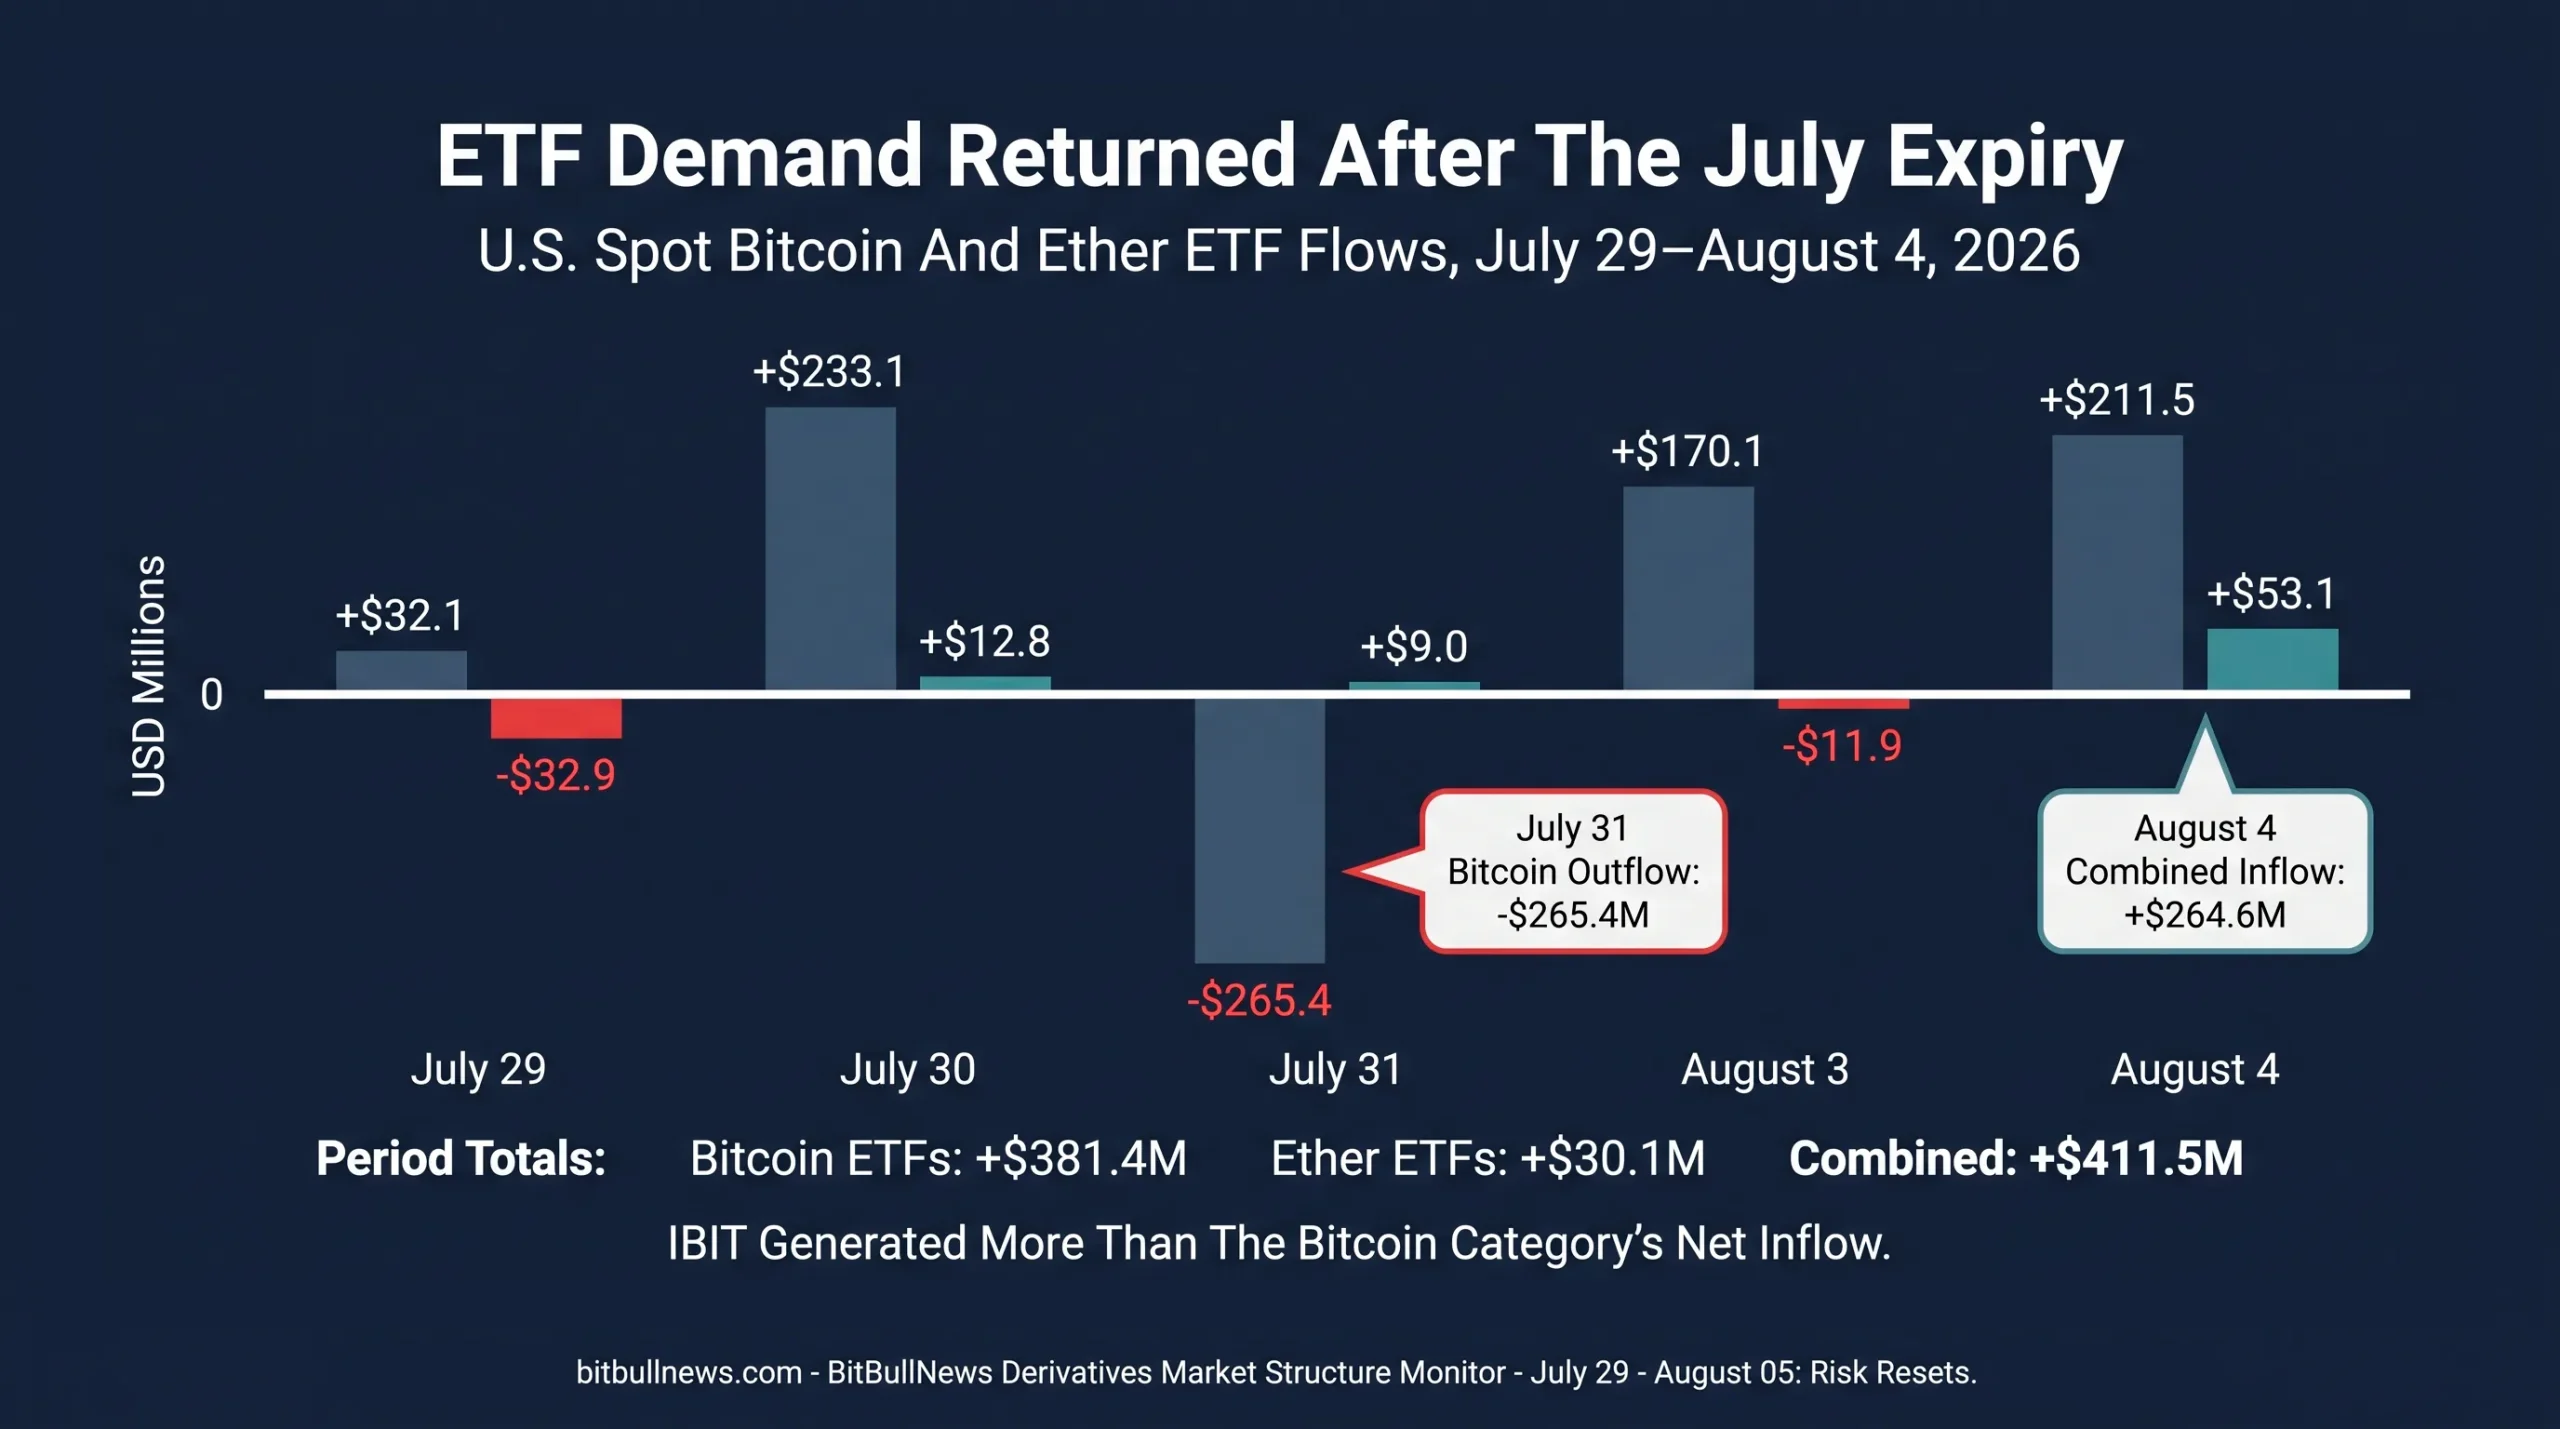
The ETF result was constructive. Its concentration was less healthy.
IBIT attracted $432.2 million, more than Bitcoin funds gained in aggregate. GBTC lost $52.6 million, FBTC lost $29.4 million and ARKB lost $19.3 million. Positive flows from smaller products supplied additional offsets.
BlackRock also led Ether.
ETHA added $54.9 million and the staked ETHB product added $21.2 million. The combined $76.1 million inflow exceeded the entire category’s $30.1 million result because FETH, ETHE and Grayscale’s lower-fee Ether product recorded net redemptions.
The flow concentration matters for derivatives.
When one issuer supplies most of the spot creation demand, aggregate support can change quickly if that product reverses. The July 31 Bitcoin outflow showed the speed of that adjustment.
Positive ETF Flow Did Not Produce A Positive Weekly Return
Bitcoin attracted $381.4 million through U.S. spot ETFs and still finished the completed price period down 0.76%.
Ether attracted $30.1 million and fell 2.42%.
That does not mean the ETF buying was ineffective.
The underlying markets also absorbed:
- July options settlement.
- Futures and perpetual repositioning.
- Selling from non-U.S. spot venues.
- Miner, treasury and long-term-holder supply.
- Redemptions or hedging outside the ETF complex.
The divergence shows why ETF flows should not be treated as a complete demand model.
They are one measurable institutional channel inside a larger global market.
Short Liquidations Dominated The Latest Recovery
CoinGlass reported approximately $35.52 million of Bitcoin liquidations and $17.22 million of Ether liquidations over the latest rolling 24-hour window.
Its liquidation pages identified shorts as the dominant side in both markets.
Rolling Twenty-Four-Hour Liquidation Snapshot
| Metric | Bitcoin | Ether | Combined |
|---|---|---|---|
| Total Liquidations | $35.52M | $17.22M | $52.74M |
| Dominant Side | Shorts | Shorts | Shorts |
| Futures Open Interest | $49.23B | $26.26B | $75.49B |
| Liquidations As Share Of OI | Approximately 0.07% | Approximately 0.07% | Approximately 0.07% |
| Market Interpretation | Short covering during price recovery | Short covering during price recovery | Contained squeeze rather than broad deleveraging |
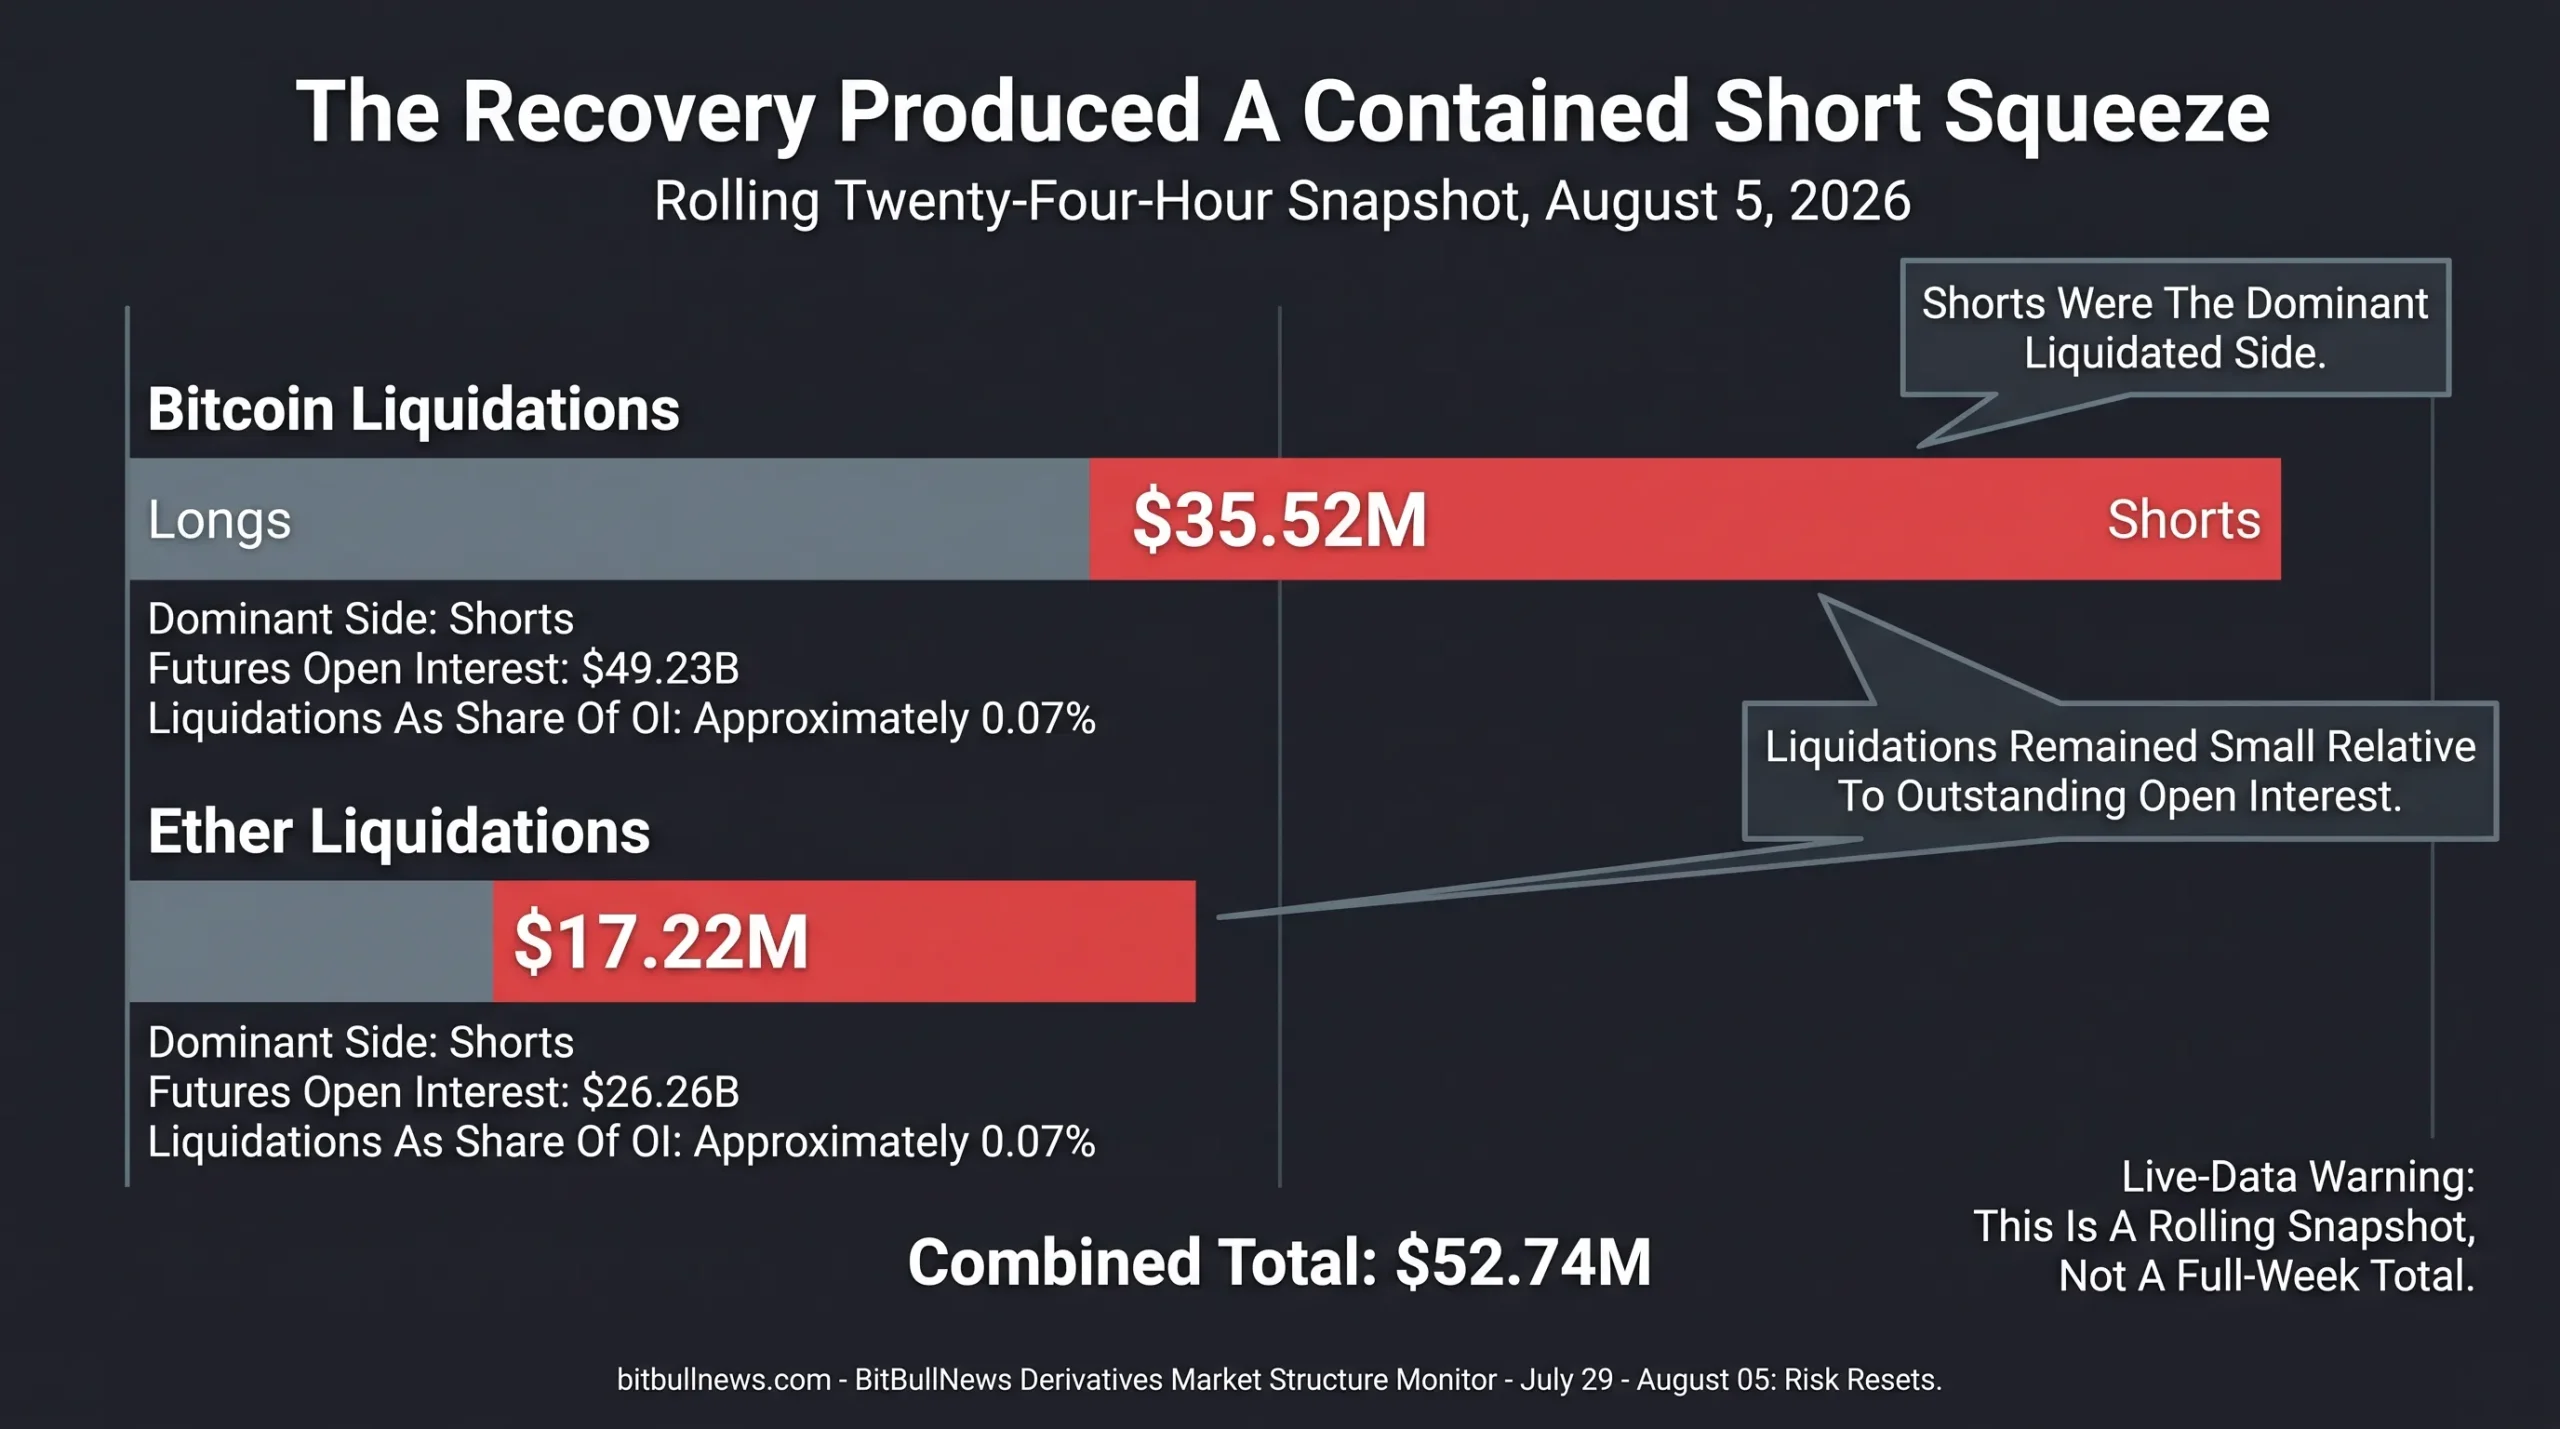
The totals were small relative to outstanding open interest.
Approximately 0.07% of reported BTC and ETH futures OI was liquidated over the measured window. That is consistent with a contained short squeeze rather than a market-wide leverage flush.
The distinction matters.
Short liquidations can accelerate a rally temporarily, but they remove buying pressure once the positions have closed. A durable move requires fresh spot demand or new long exposure after the squeeze.
The Market Reset Without Becoming Defensive
The major indicators did not line up behind one simple directional trade.
Constructive signals included:
- $411.5 million of combined BTC and ETH ETF inflows.
- Leveraged-fund short covering on CME.
- Positive but moderate funding on several major exchanges.
- Short-dominated liquidations during the latest recovery.
- Call-heavy outstanding Bitcoin options exposure.
The cautious signals were equally clear:
- BTC and ETH both finished below their July 29 closes.
- ETH underperformed and retained much higher realized volatility.
- Asset managers reduced BTC net-long exposure and increased their ETH net short.
- Bitcoin futures turnover remained almost 16 times spot volume.
- Current Bitcoin options volume leaned slightly toward puts.
- The August 7 $70,000 and $72,000 calls rebuilt nearby expiry concentration.
This is a market with constructive positioning and incomplete spot confirmation.
What Traders Should Watch Next
Whether Bitcoin Open Interest Rises Above Price
Bitcoin futures open interest was up 2.43% over the latest 24-hour period while price moved less than 1%.
Continued OI growth without a clean move above the recent $65,000–$65,300 range would indicate more leverage entering the same consolidation.
Whether Funding Broadens Across Exchanges
Current funding was modest and mixed.
A synchronized increase across Binance, OKX, Bybit, Bitget and other large venues would show that long exposure is becoming more crowded.
Whether The August 7 Calls Roll Forward
The $70,000 and $72,000 calls became the largest near-term concentrations after the July expiry.
A large roll into late August or September would preserve upside exposure even if headline OI falls after August 7.
Whether Put Volume Stays Above Call Volume
Puts represented 51.04% of current options turnover.
Continued put leadership would show that traders are maintaining protection despite call-heavy outstanding positions.
Whether ETF Inflows Broaden Beyond BlackRock
IBIT generated more than the entire Bitcoin category’s net inflow. ETHA and ETHB did the same for Ether.
A healthier institutional signal would include sustained creations across Fidelity, Bitwise, 21Shares and other issuers.
Whether CME Asset Managers Stabilize
Bitcoin asset managers remained net long but reduced their position. Ether asset managers became more net short.
A reversal in the next CFTC report would provide stronger evidence that longer-horizon institutional accounts are joining the recovery.
Whether ETH Regains Relative Strength
ETH underperformed BTC by approximately 1.66 percentage points and carried higher realized volatility.
A more constructive ETH structure would require price outperformance, stable funding and spot demand beyond BlackRock’s products.
Whether Liquidations Remain Contained
The latest BTC and ETH liquidation totals were small relative to open interest.
A move from tens of millions to several hundred million dollars would indicate that the rising futures base had become unstable.
Derivatives Risk Dashboard
| Signal | Current Reading | Interpretation | Confirmation Needed |
|---|---|---|---|
| BTC Period Return | -0.76% | Recovery erased most, but not all, of the expiry decline | Sustained close above the period high |
| ETH Period Return | -2.42% | ETH lagged BTC | Relative-performance recovery |
| BTC Three-Month Volatility | 36.37% | Material but below ETH | Volatility remains contained as OI grows |
| ETH Three-Month Volatility | 52.10% | ETH remained the higher-beta asset | Stronger return compensates for higher risk |
| BTC Futures OI | $49.23B | Large leverage base remained | OI growth is supported by spot volume |
| ETH Futures OI | $26.26B | Large exposure relative to spot turnover | ETH demand broadens beyond derivatives |
| BTC Futures-To-Spot Volume | 15.75x | Price discovery remained derivatives-heavy | Spot turnover increases |
| ETH Futures-To-Spot Volume | 23.90x | ETH was even more derivatives-dependent | Spot liquidity catches up |
| BTC Funding | Mixed, Mostly Modestly Positive | Long bias without obvious crowding | Funding stays controlled near resistance |
| BTC Options OI | $26.74B | Exposure fell after July expiry | Orderly rebuilding across later expiries |
| BTC Options OI Change | -21.65% From July 29 Snapshot | Expiry reset the outstanding book | New exposure grows without one-strike concentration |
| Call Share Of BTC OI | 62.11% | Outstanding positions retained an upside tilt | Calls remain supported after August 7 |
| Put Share Of BTC Volume | 51.04% | Current flow leaned slightly defensive | Put demand normalizes without a price break |
| August 7 $70K And $72K Calls | Major Near-Term OI Concentrations | Upside expiry risk rebuilt | Orderly expiry or roll |
| CME BTC Asset Managers | Net Long 2,299 | Still constructive, but less so than the prior week | Net-long position stabilizes |
| CME ETH Asset Managers | Net Short 3,472 | Institutional category remained defensive | Short exposure declines |
| CME BTC Leveraged Funds | Net Short 6,873 | Shorts covered but remained substantial | Continued covering with spot confirmation |
| CME ETH Leveraged Funds | Net Short 5,396 | Bearish imbalance narrowed | Further covering without funding excess |
| BTC ETF Flow | +$381.4M | Institutional spot demand returned | Inflows broaden beyond IBIT |
| ETH ETF Flow | +$30.1M | Positive but concentrated in BlackRock products | Broader issuer participation |
| Rolling BTC Liquidations | $35.52M, Shorts Dominant | Contained short squeeze | No large liquidation cascade |
| Rolling ETH Liquidations | $17.22M, Shorts Dominant | Short covering supported recovery | OI remains stable after the squeeze |
Constructive, But Not Clean: The Derivatives Reality
The July expiry reset Bitcoin’s options market. It did not remove leverage from crypto.
Bitcoin options open interest fell from $34.13 billion to $26.74 billion, a reduction of $7.39 billion. The July 31 $70,000 and $72,000 calls expired below their strikes, clearing the largest near-term concentration.
The options book quickly rebuilt another upside cluster around the August 7 $70,000 and $72,000 calls.
Outstanding positioning remained call-heavy at 62.11%. Current volume told a more cautious story, with puts accounting for 51.04% of turnover. Traders retained upside exposure while adding or trading downside structures.
Linear leverage stayed large.
Bitcoin futures open interest reached $49.23 billion, while Ether carried $26.26 billion. Futures turnover was almost 16 times BTC spot volume and nearly 24 times ETH spot volume. Funding was modest and mixed, which reduced the immediate overheating signal but left room for leverage to expand.
CME traders were not unified.
Asset managers reduced their Bitcoin net long and deepened their Ether net short. Leveraged funds covered part of their short exposure in both assets. The report therefore showed less bearish tactical positioning without a matching increase in long-only institutional conviction.
ETF flows supplied the strongest spot signal.
Bitcoin products attracted $381.4 million and Ether funds added $30.1 million. BlackRock generated more than the entire net inflow in both categories, leaving demand concentrated in IBIT, ETHA and ETHB.
Price confirmation remained incomplete.
Bitcoin finished 0.76% below its July 29 close. Ether fell 2.42% and continued to carry much higher realized volatility. The latest recovery liquidated shorts, but the forced closures represented only a small fraction of total open interest.
The structure is constructive without being clean.
Expiry risk fell. Futures leverage rose. Funding stayed controlled. ETF demand returned. Current option flow remained defensive.
The next move depends on whether spot demand catches up with derivatives exposure — and whether the August 7 options concentration rolls forward without another failed attempt to break above $70,000.
Data Sources & References
- Coin Metrics — CMBI Bitcoin Benchmark
- Coin Metrics — CMBI Ethereum Benchmark
- CoinGlass — Bitcoin Futures Data
- CoinGlass — Ethereum Market Data
- CoinGlass — Bitcoin Options Data
- CoinGlass — Funding Rates
- CoinGlass — Bitcoin Liquidations
- CoinGlass — Ethereum Liquidations
- CFTC — Traders In Financial Futures Report
- Farside Investors — Bitcoin ETF Flows
- Farside Investors — Ethereum ETF Flows
- TokenPost — July 29 CoinGlass Options Snapshot