


Content
July was a repair month for the crypto industry, but not a breakout.
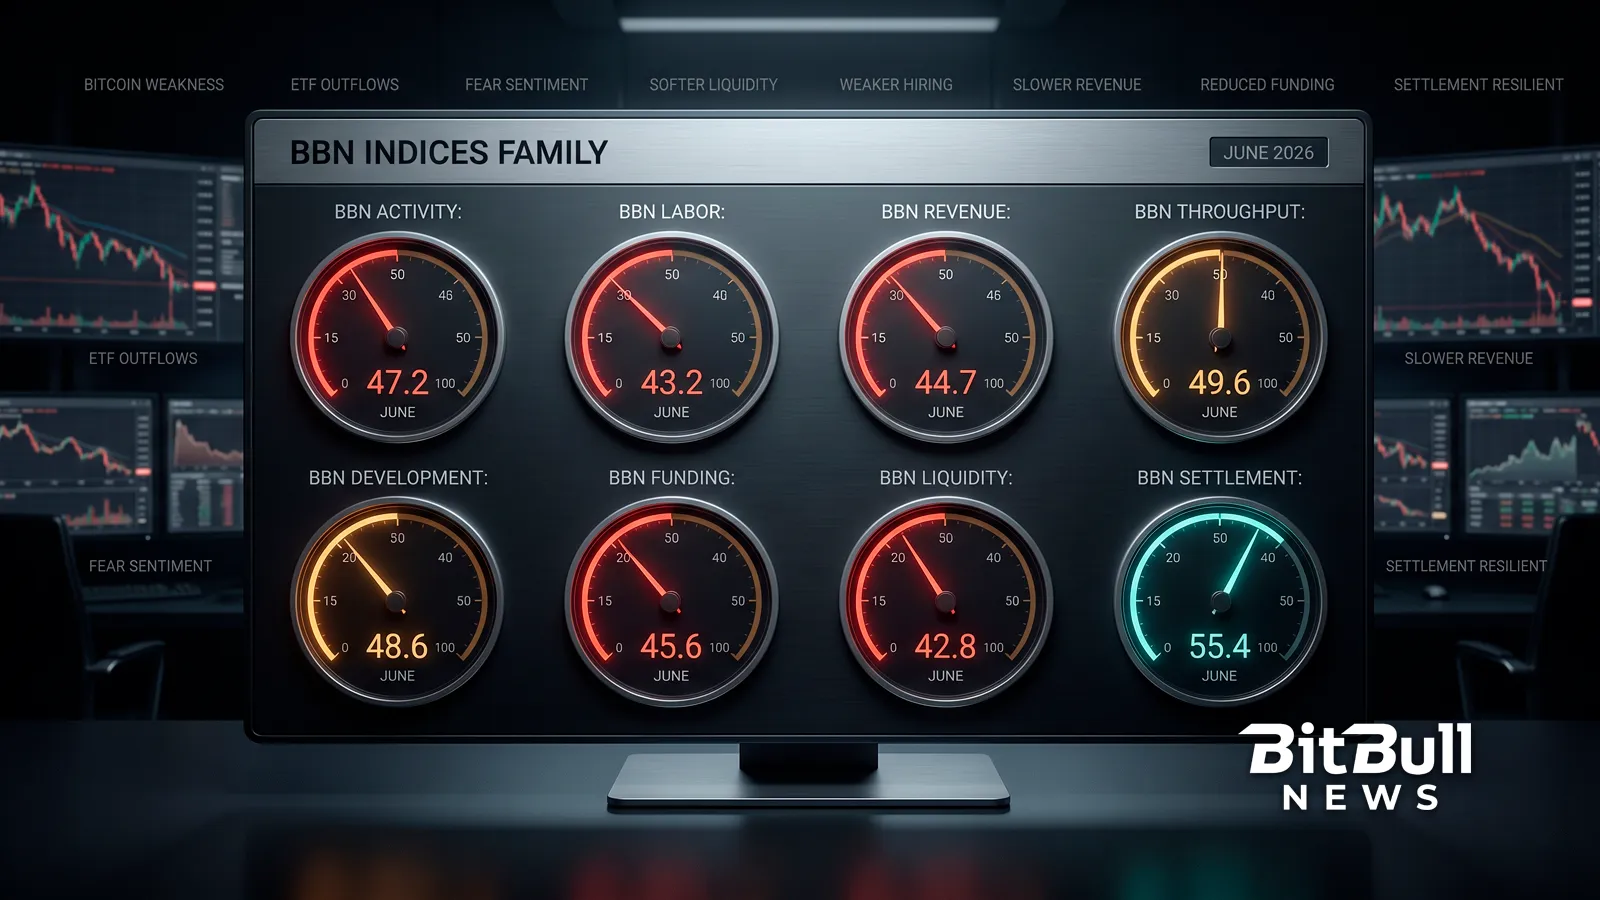
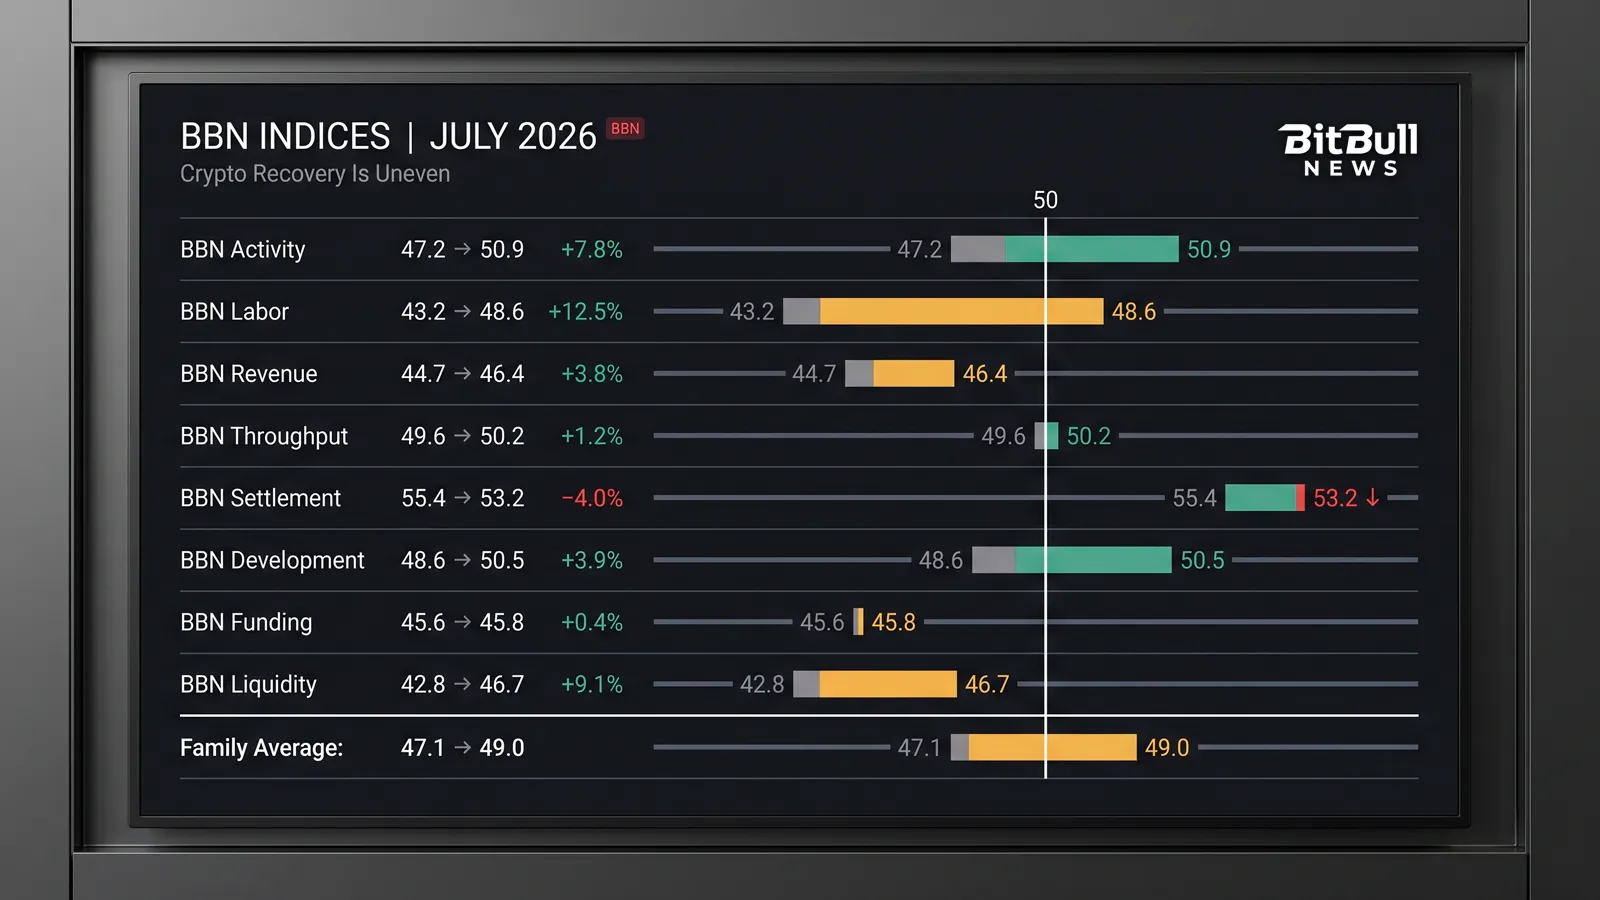
The latest BBN Indices reading shows that four of the eight industry indicators moved above the neutral 50 level, compared with just one in June. Activity recovered. Transaction throughput stabilized. Development returned to expansion. Stablecoin settlement remained the strongest part of the industry.
But the recovery stopped halfway.
Revenue, funding, labor and liquidity all improved from their June readings but remained below 50. That means conditions became less negative without turning genuinely expansionary. Prices recovered faster than trading volumes, hiring, industry-wide monetization and venture activity.
The average reading across the BitBullNews.com index family rose from 47.1 in June to 49.0 in July. The result captures the central tension of the month: the crypto market was no longer contracting as sharply, but its operating economy had not yet built enough breadth to confirm a new growth cycle.
The BitBullNews Data platform separates its analytics into two groups. BBN Indices track crypto as an operating industry through activity, labor, revenue, throughput, settlement, development, funding and liquidity. BBN Benchmarks measure Bitcoin’s performance against major macro assets and market baskets. Together, they help distinguish a price rally from a broader improvement in industry conditions.
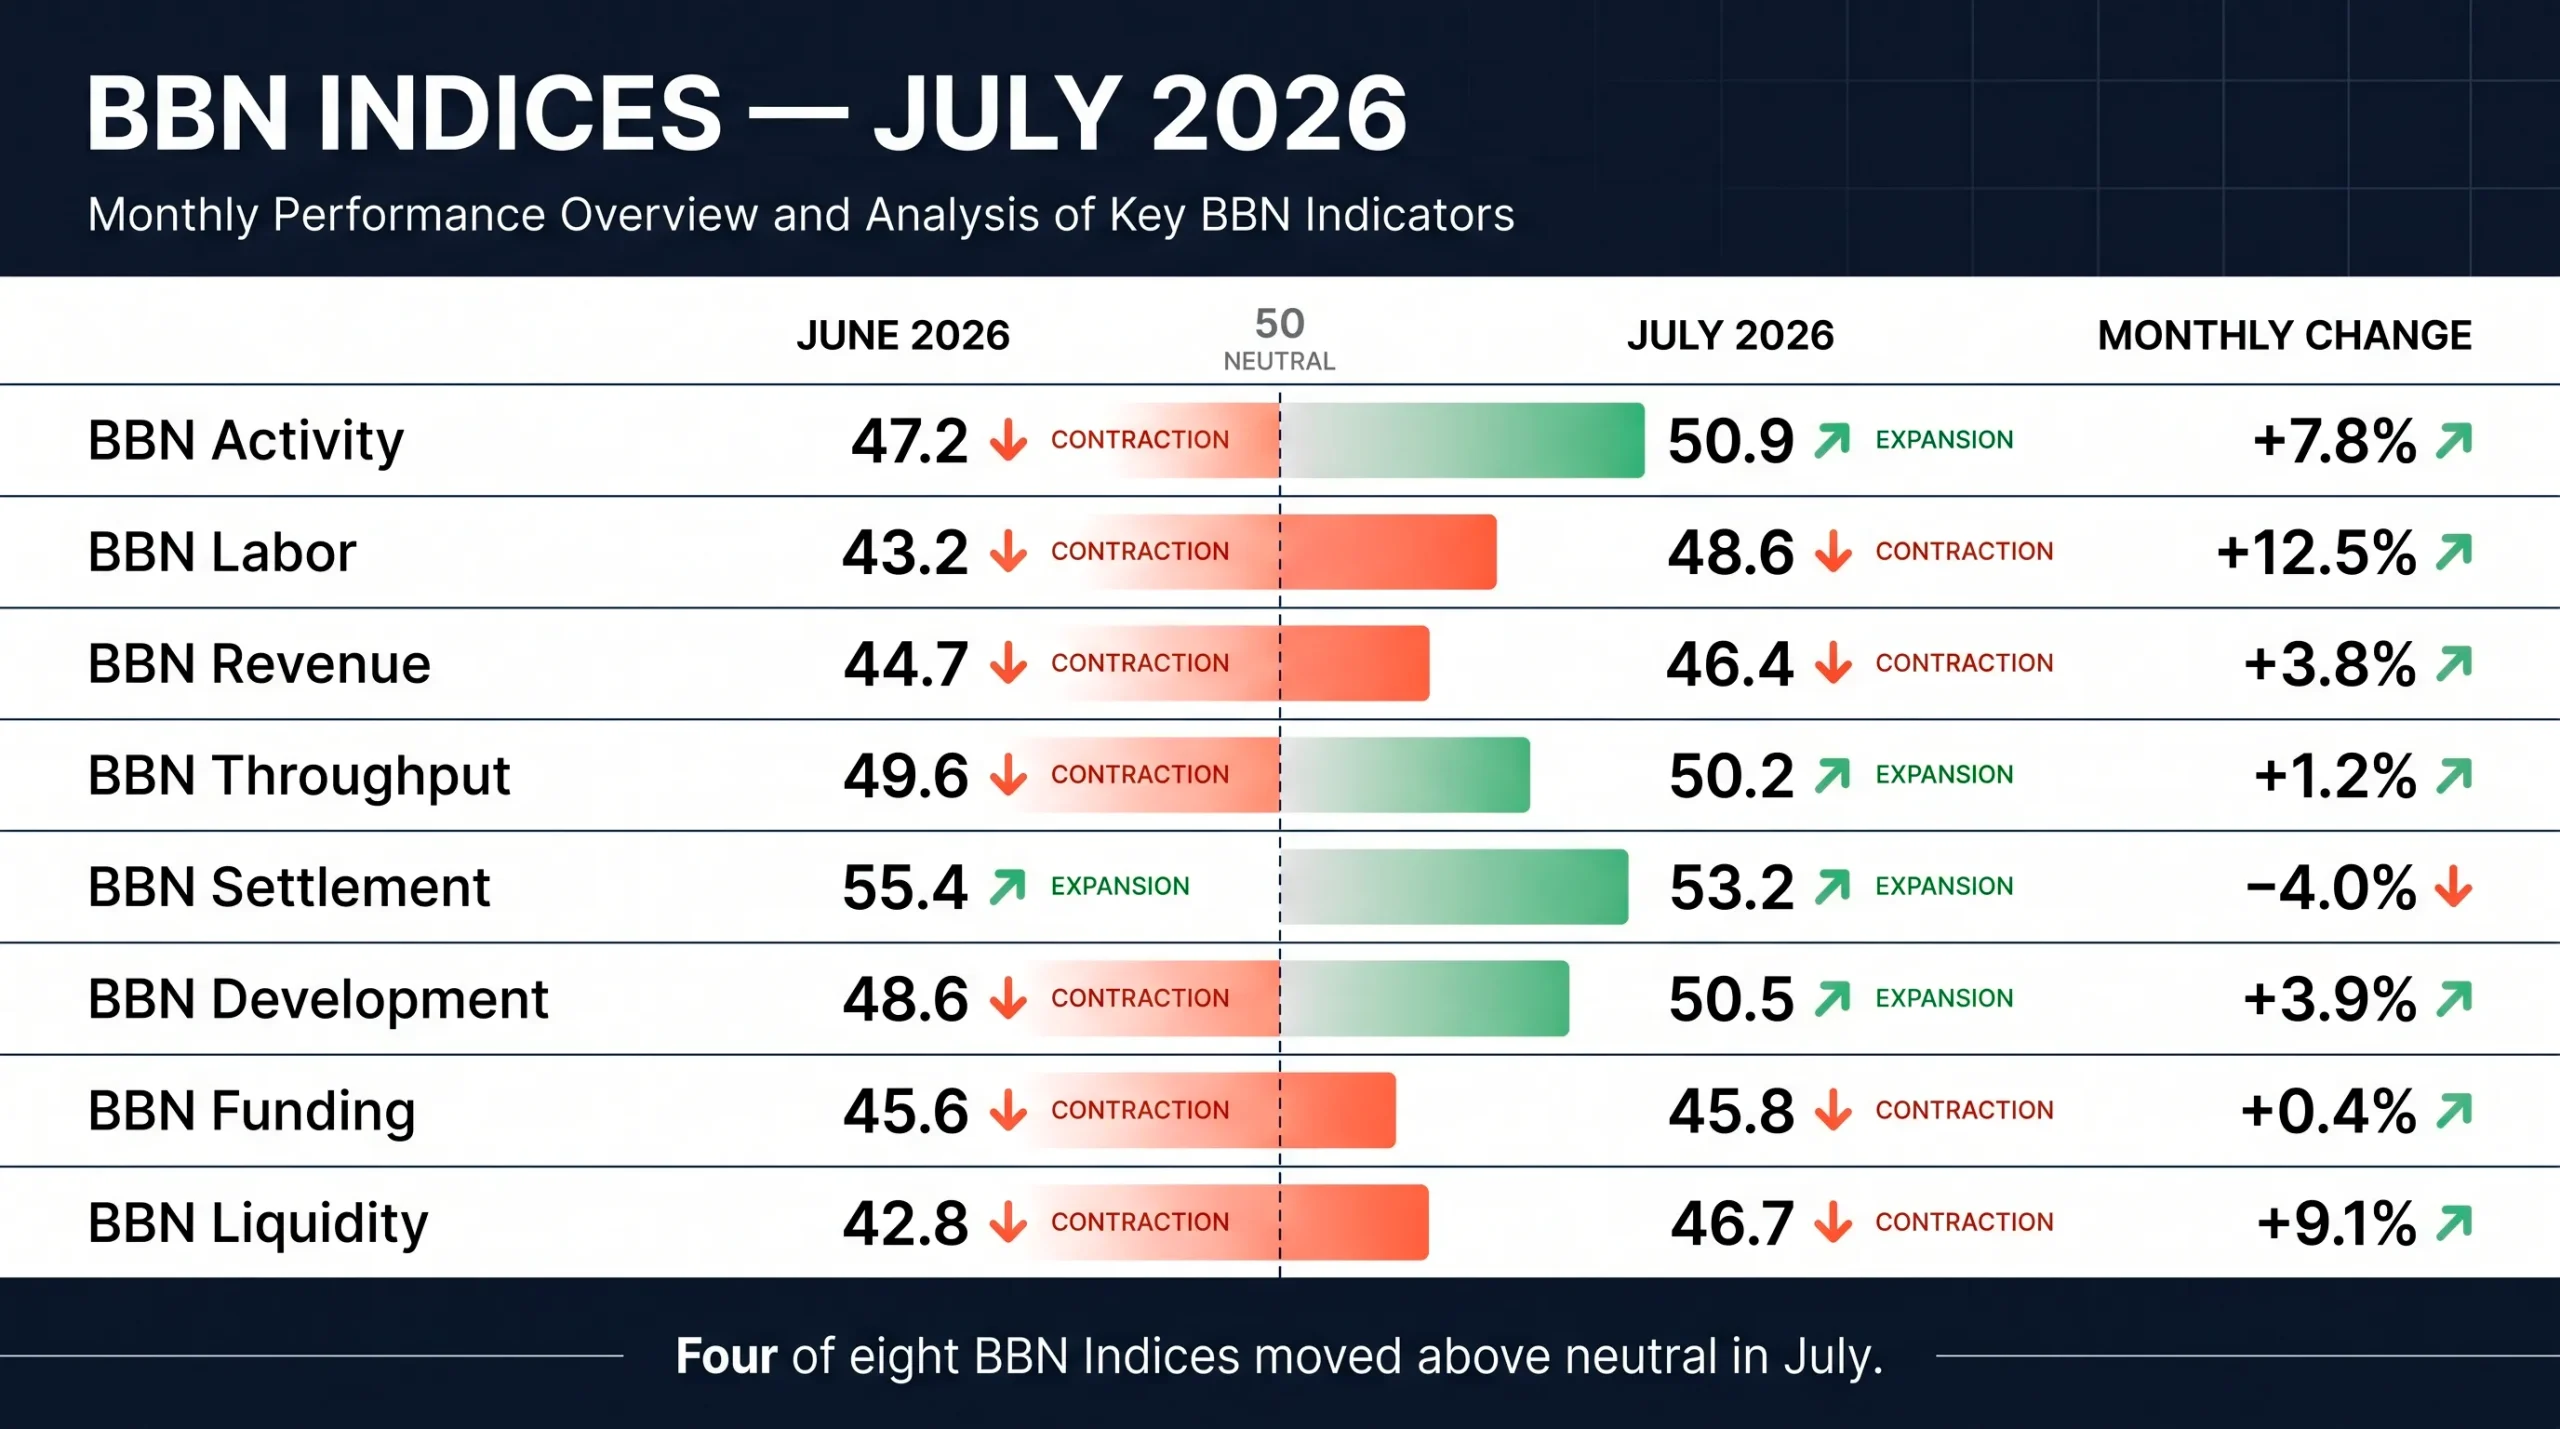
BBN Indices July 2026 Scoreboard
| BBN Index | June 2026 | July 2026 | Point Change | Monthly Change | July Signal |
|---|---|---|---|---|---|
| BBN Activity | 47.2 | 50.9 | +3.7 | +7.8% | Moderate expansion |
| BBN Labor | 43.2 | 48.6 | +5.4 | +12.5% | Contraction easing |
| BBN Revenue | 44.7 | 46.4 | +1.7 | +3.8% | Continued contraction |
| BBN Throughput | 49.6 | 50.2 | +0.6 | +1.2% | Marginal expansion |
| BBN Settlement | 55.4 | 53.2 | -2.2 | -4.0% | Expansion slowing |
| BBN Development | 48.6 | 50.5 | +1.9 | +3.9% | Moderate expansion |
| BBN Funding | 45.6 | 45.8 | +0.2 | +0.4% | Continued contraction |
| BBN Liquidity | 42.8 | 46.7 | +3.9 | +9.1% | Contraction easing |
What The Neutral 50 Level Actually Means
The neutral level is central to interpreting the BBN Indices.
A reading above 50 means conditions expanded or improved compared with the previous month. A reading below 50 means the relevant part of the industry continued to contract or weaken. A reading of exactly 50 would indicate no meaningful net monthly change.
The direction of travel and the final level must be read together.
BBN Labor, for example, rose by 12.5% in July, the largest relative improvement across the family. But its final reading was 48.6. Hiring conditions therefore improved significantly without crossing into expansion.
BBN Settlement moved in the opposite direction. It fell from 55.4 to 53.2, but remained above 50. Settlement activity was still expanding; it was simply expanding more slowly than in June.
That distinction prevents a common analytical mistake. A higher index value is not automatically evidence of growth if the reading remains below 50. Likewise, a monthly decline does not automatically indicate contraction if the index stays above the neutral threshold.
July Was A Repair Month, Not A Breakout
The July recovery began with a reversal in major crypto prices.
Bitcoin gained approximately 7.3% in July after falling more than 20% in June. Ethereum and several large-cap assets also recovered as forced selling eased and investors returned to selected risk positions.
US spot Bitcoin ETF flows also improved. Daily flow data indicate that the funds finished July with a modest net inflow of roughly $172 million, reversing part of June’s severe institutional outflow. However, the monthly total concealed significant volatility. The market recorded several strong inflow days alongside withdrawals of $424.7 million on July 13 and $265.4 million on July 31. The result was stabilization rather than a decisive return of institutional demand.
The early-July rally also included a meaningful short squeeze. Around $281 million in bearish crypto positions were liquidated during one of the first major upward moves of the month. Thin liquidity helped amplify the rebound, raising questions about how much of the initial advance came from fresh demand and how much came from traders being forced to close short positions.
That question remained relevant through the end of July. K33 Research estimated that Bitcoin spot volume was on course for its weakest month since late 2023, with average daily spot turnover of about $2.2 billion. CME positioning and perpetual futures activity also remained subdued relative to earlier periods.
Price therefore recovered before the wider industry did. That gap explains why Activity crossed 50 while Revenue and Liquidity did not.
BBN Activity Returned To Expansion
BBN Activity rose from 47.2 to 50.9, moving back above neutral after June’s contraction.
This was an important change. The index had fallen below 50 in June as Bitcoin sold off, ETF redemptions intensified and market participants reduced risk. July reversed part of that pressure through higher prices, improving institutional flows and renewed activity around major assets.
The return above 50 was nevertheless narrow. A reading of 50.9 signals expansion, but only just.
Bitcoin’s recovery brought investors back to the market, yet the improvement was not matched by a broad surge in spot trading, commercial revenue or altcoin liquidity. Activity became healthier, but it remained concentrated in Bitcoin, Ethereum and a limited number of institutional and on-chain products.
The seven-month history reinforces that interpretation. BBN Activity stood at 57.2 in April and 53.6 in May before falling to 47.2 in June. July’s 50.9 reading represents stabilization after the correction, not a return to April’s stronger operating environment.
The industry was moving again, but it was not running at full speed.
BBN Labor Recorded The Strongest Rebound
BBN Labor increased from 43.2 to 48.6, a gain of 5.4 points and 12.5%.
Public hiring data support the improvement. CryptoJobsList recorded 382 new job postings in July, up from 270 in June. The number of companies posting vacancies rose from 44 to 107, while recorded applications increased from 11,578 to 29,660.
Demand was particularly strong for security, backend, full-stack and blockchain engineering roles. Rust, Solidity and EVM-related skills also attracted more postings, suggesting that employers were still willing to invest in core infrastructure and technically specialized teams.
But Labor remained below 50 because job advertisements are only one side of the employment picture.
Restructuring continued across exchanges, wallets, protocols and infrastructure companies. The CryptoJobsList layoff tracker recorded workforce reductions or reorganizations involving companies including Pump.fun, Gnosis, Luno, Uphold, BitMart, BitMEX, Exodus, Polygon Labs and FalconX during the broader 2026 cycle.
The result was a labor market with more openings but no clear industry-wide increase in net employment. Companies were hiring for selected engineering, compliance, stablecoin, security and institutional-product roles while cutting teams considered less essential.
A reading of 48.6 therefore describes a market approaching stability. It does not yet describe a genuine hiring expansion.
Labor has remained below 50 throughout the January-to-July BBN series. July was its strongest reading so far, but employers still appeared more interested in replacing capabilities and reallocating resources than expanding headcount broadly.
BBN Revenue Improved, But Monetization Stayed Weak
BBN Revenue rose from 44.7 to 46.4, but remained clearly below neutral.
The reason is simple: higher asset prices did not generate a comparable recovery in turnover.
Trading-sensitive businesses depend on volume, not price alone. Exchanges earn more when customers transact. Market makers benefit from active two-way flow. Many protocols generate revenue through swaps, borrowing, liquidations, transaction fees or validator demand. When the market rises on limited volume, the income effect is much weaker than the price chart suggests.
July’s unusually soft Bitcoin spot volume therefore limited the recovery in exchange and brokerage revenue. It also reduced fee opportunities across the wider market.
Quarterly results released during July illustrated the difficult starting point. Coinbase reported that second-quarter spot trading volume fell 25% from the previous quarter, while transaction revenue declined 22% to approximately $559 million. Subscription and services revenue provided a more stable contribution, highlighting how custody, stablecoin income and other recurring services can protect a crypto business when trading slows.
That same split was visible across the industry.
Stablecoin issuers, selected derivatives venues and several infrastructure protocols continued to produce meaningful income. But revenue growth was not broad enough to offset weaker spot trading, thinner speculative demand and lower monetization across smaller applications.
BBN Revenue’s move from 44.7 to 46.4 means the contraction became less severe. It does not mean the industry’s income statement returned to growth.
For Revenue to move above 50, the market would need a combination of stronger trading volume, wider on-chain fee generation and improved monetization beyond a small group of dominant platforms.
BBN Throughput Moved Just Above Neutral
BBN Throughput increased from 49.6 to 50.2, crossing into marginal expansion.
The small move tells a nuanced story. Centralized spot trading remained weak, but crypto’s transaction infrastructure continued to carry significant value through stablecoins, decentralized exchanges, perpetual futures markets, lending protocols and cross-chain systems.
That was enough to prevent a broader decline in throughput.
The difference between Throughput and Revenue is particularly revealing. Networks and applications can process more transactions without generating proportionally more income. Lower fees, more efficient execution and activity concentrated in low-cost environments can raise transaction counts or transferred value while leaving industry revenue under pressure.
Stablecoins also provided an important floor. They continued to move between exchanges, wallets, DeFi protocols, market makers and institutional counterparties even when speculative spot activity was limited.
The final reading of 50.2 should therefore be interpreted cautiously. Crypto’s transaction engine was no longer contracting, but the expansion was extremely modest. It relied on resilient financial infrastructure rather than a broad return of retail and institutional trading intensity.
Throughput’s three-month average remained above 50, supported by stronger readings in May and the industry’s persistent demand for dollar-denominated settlement. That makes it one of the healthier components of the BBN family, even though July itself was close to neutral.
BBN Settlement Remained The Industry’s Strongest Pillar
BBN Settlement declined from 55.4 to 53.2, but remained comfortably above neutral.
Settlement is the only BBN Index that stayed above 50 in every month from January through July. That consistency separates stablecoin and payment infrastructure from the more cyclical parts of the crypto economy.
The July decline reflects a slower rate of expansion following exceptionally strong settlement activity earlier in the year. The stablecoin market also experienced a rare supply contraction. By late July, the total market value of stablecoins had fallen by roughly $10 billion from its May peak to around $300 billion.
But supply was only part of the story.
Adjusted stablecoin transaction volume reached approximately $1.79 trillion in June, an all-time high and a 63% increase from the previous month, according to data cited by Forbes. That strong base made a July slowdown more likely, while also demonstrating that stablecoins remained deeply embedded in crypto’s operating infrastructure.
Stablecoins continue to serve several functions at once:
- exchange and market-maker settlement;
- collateral for lending and derivatives;
- cross-border transfers;
- corporate and treasury payments;
- dollar access in markets where conventional banking is limited;
- movement of capital between centralized and decentralized venues.
Those uses do not disappear when Bitcoin trading volume falls. That is why Settlement can remain above 50 during a month in which Revenue and Liquidity remain in contraction.
The fall to 53.2 means settlement growth cooled. It does not mean settlement weakened outright. The rails continued to expand, just at a more moderate pace.
BBN Development Crossed 50 For The First Time
BBN Development rose from 48.6 to 50.5, moving into expansion for the first time in the January-to-July series.
July delivered a strong calendar of protocol upgrades, infrastructure work and security-related investment.
Solana activated an increase in its mainnet block compute limit from 60 million to 100 million compute units on July 29. The upgrade expanded network capacity at a time when some Solana blocks were already approaching previous limits.
NEAR Protocol introduced post-quantum signing support and dynamic resharding through its 2.13 upgrade, targeting both long-term security and network scalability.
Lido began migrating roughly 8 million ETH to a post-Pectra staking architecture designed to reduce validator count and network messaging overhead. The transition was expected to cut Lido’s validator footprint by approximately one-third and reduce attestation traffic by 29%.
Galaxy also launched a Bitcoin quantum-readiness initiative offering up to $5 million in grants for developers working on post-quantum cryptography and related Bitcoin security research.
These developments helped push the index above neutral. They showed that established teams were continuing to ship technically significant infrastructure despite weak market revenue and cautious venture conditions.
The reading remained close to 50 because development breadth was still uneven. Mature ecosystems and well-funded infrastructure teams remained active, but the sector had not returned to a broad developer-acquisition cycle across every chain and application category.
The July signal is therefore constructive but measured: crypto development expanded, although the expansion was concentrated in upgrades, optimization and security rather than a wave of new speculative applications.
BBN Funding Barely Changed
BBN Funding moved from 45.6 to 45.8, the smallest monthly improvement in the index family.
The month included several large and strategically important transactions.
Crypto.com announced a $400 million investment from Citadel Securities, valuing the company at $20 billion. The deal was Crypto.com’s first institutional funding round and was positioned around expansion into tokenized securities, derivatives and institutional markets.
Brokerage infrastructure company Alpaca raised $135 million in equity financing, bringing its broader financing package to $435 million when debt was included. The company said the capital would support tokenized markets and financial infrastructure designed for AI-native services.
These transactions demonstrate that large pools of capital remain available for companies with institutional distribution, proven infrastructure and a clear path to revenue.
But they also reveal why the Funding Index stayed below 50.
Capital was concentrated in a small number of large, later-stage or strategic deals. CryptoRank data cited in July reports indicated that only around 150 unique venture firms participated in crypto funding rounds during the month, the lowest level since November 2020. Broader CryptoRank analysis has also shown capital increasingly favoring later-stage companies with proven traction over early experimental projects.
The industry therefore had funding value without funding breadth.
A few major investments can lift the total amount raised, but they do not create an expansionary funding environment if deal counts, early-stage participation, sector diversity and the active investor base remain weak.
The 45.8 reading reflects that concentration. Funding was available, but only for a narrower group of businesses.
BBN Liquidity Recovered From Its June Low
BBN Liquidity rose from 42.8 to 46.7, an increase of 9.1%.
The improvement came from several sources. Bitcoin and Ethereum prices stabilized, spot ETF flows turned modestly positive, forced selling declined and order-book conditions improved for major assets.
Coinbase Institutional described exchange order-book depth as one of the brighter areas of the market entering July. However, its positioning analysis also showed that the market remained led by major assets, while speculative appetite across smaller tokens continued to contract.
That concentration kept Liquidity below 50.
Liquidity is not simply the ability to buy or sell Bitcoin. A healthy industry-wide reading also requires deep order books across multiple assets and venues, stable spreads, active derivatives markets, reliable on-chain depth and sufficient two-way flow to absorb larger trades without major price impact.
July’s weak spot volumes and muted derivatives positioning showed that those conditions had not fully returned.
The market was more liquid than it had been during the June sell-off, but the improvement remained centered on Bitcoin, Ethereum and a limited number of high-volume products. Many smaller assets continued to trade with shallow books, greater slippage and stronger dependence on short-lived speculative flows.
This explains why Liquidity posted one of the largest monthly gains while remaining below neutral. Market functioning improved, but industry-wide depth was still contracting.
The Seven-Month Trend Shows A Two-Speed Industry
The BBN Indices history from January through July shows that crypto has developed two different operating speeds.
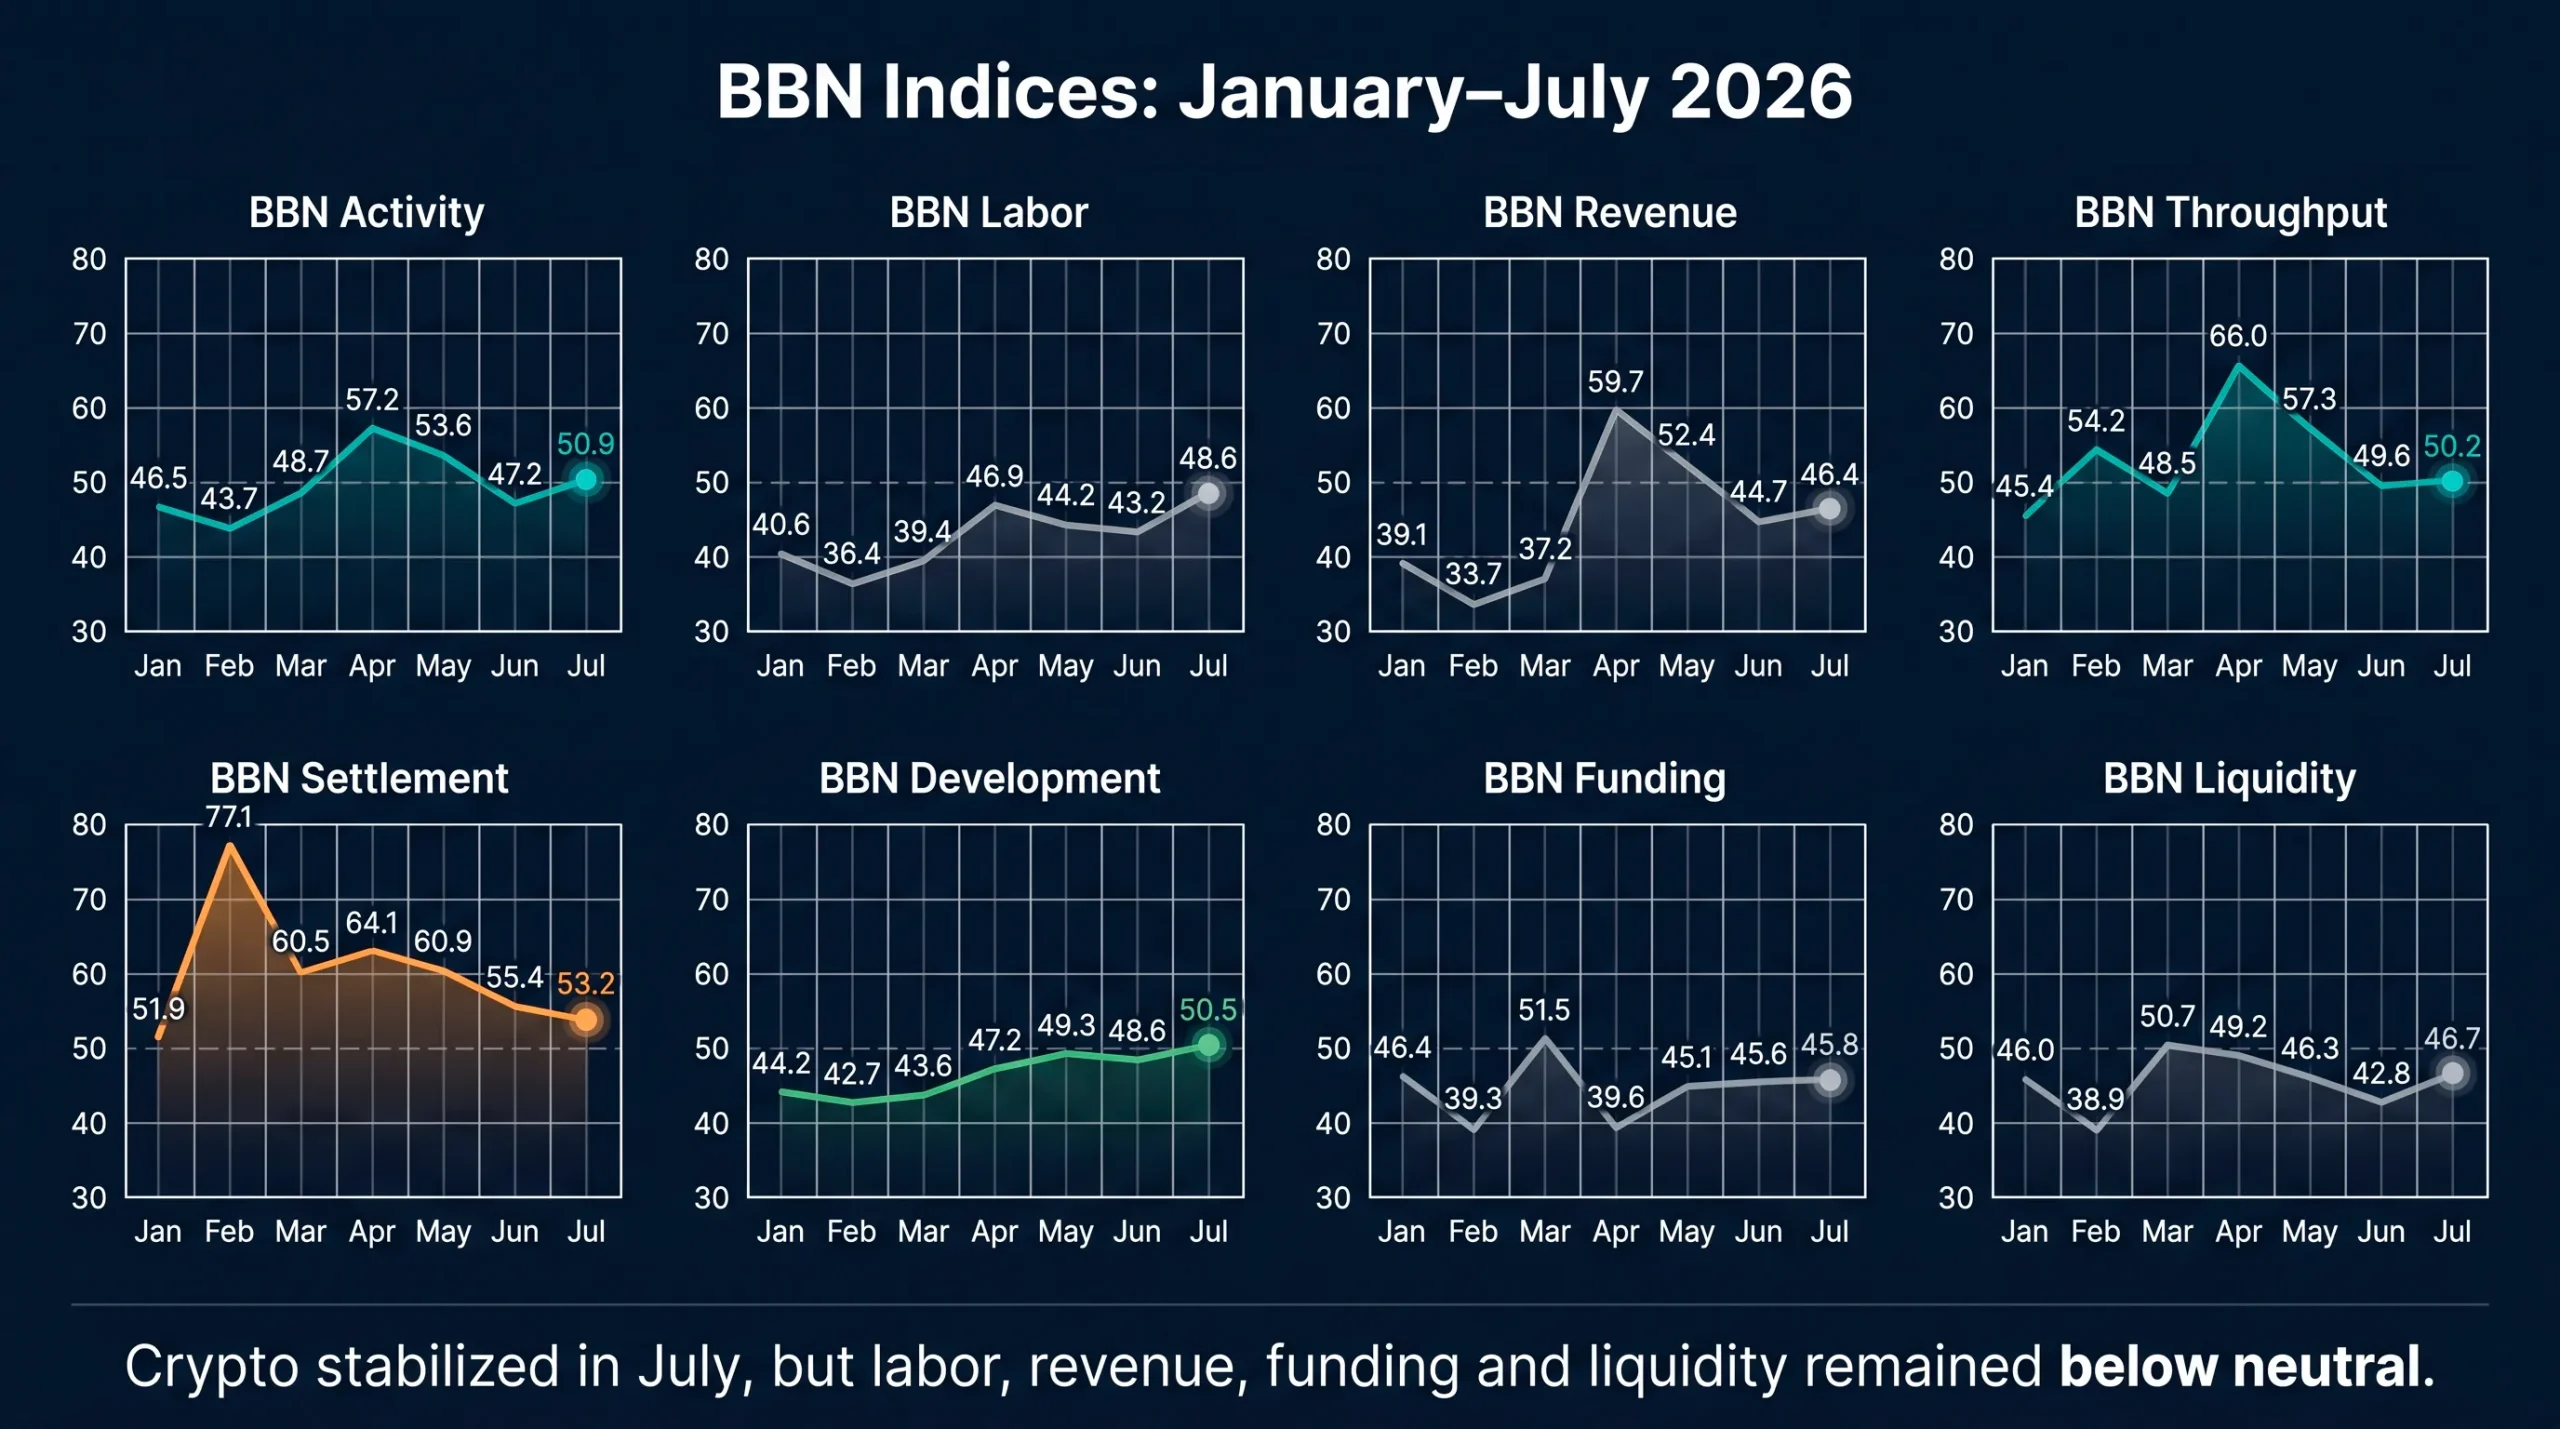
The family average rose from 45.0 in January to a seven-month high of 53.7 in April. It then slipped to 51.1 in May, fell to 47.1 during June’s sharp correction and recovered to 49.0 in July.
That pattern places July between contraction and expansion. It also reveals which parts of the industry have been structurally resilient.
Settlement has remained above 50 throughout the entire period. Throughput has also performed relatively well, supported by stablecoin transfers and crypto-native financial infrastructure.
Labor has remained below 50 every month. Funding has crossed above neutral only once, while Liquidity has spent most of the period in contraction. Revenue expanded strongly in April and remained above neutral in May, but fell back as trading conditions deteriorated.
The three-month averages covering May through July reinforce the divide:
- Settlement averaged 56.5.
- Throughput averaged 52.4.
- Activity averaged 50.6.
- Development averaged 49.5.
- Revenue averaged 47.8.
- Labor, Funding and Liquidity remained near 45.
Crypto’s rails are operating more strongly than its labor market, financing environment and income base. The industry can move value effectively, but many of the businesses sitting on top of that infrastructure are still struggling to convert activity into broad revenue, hiring and capital formation.
BBN Benchmarks Showed That Energy Masked Broader Weakness
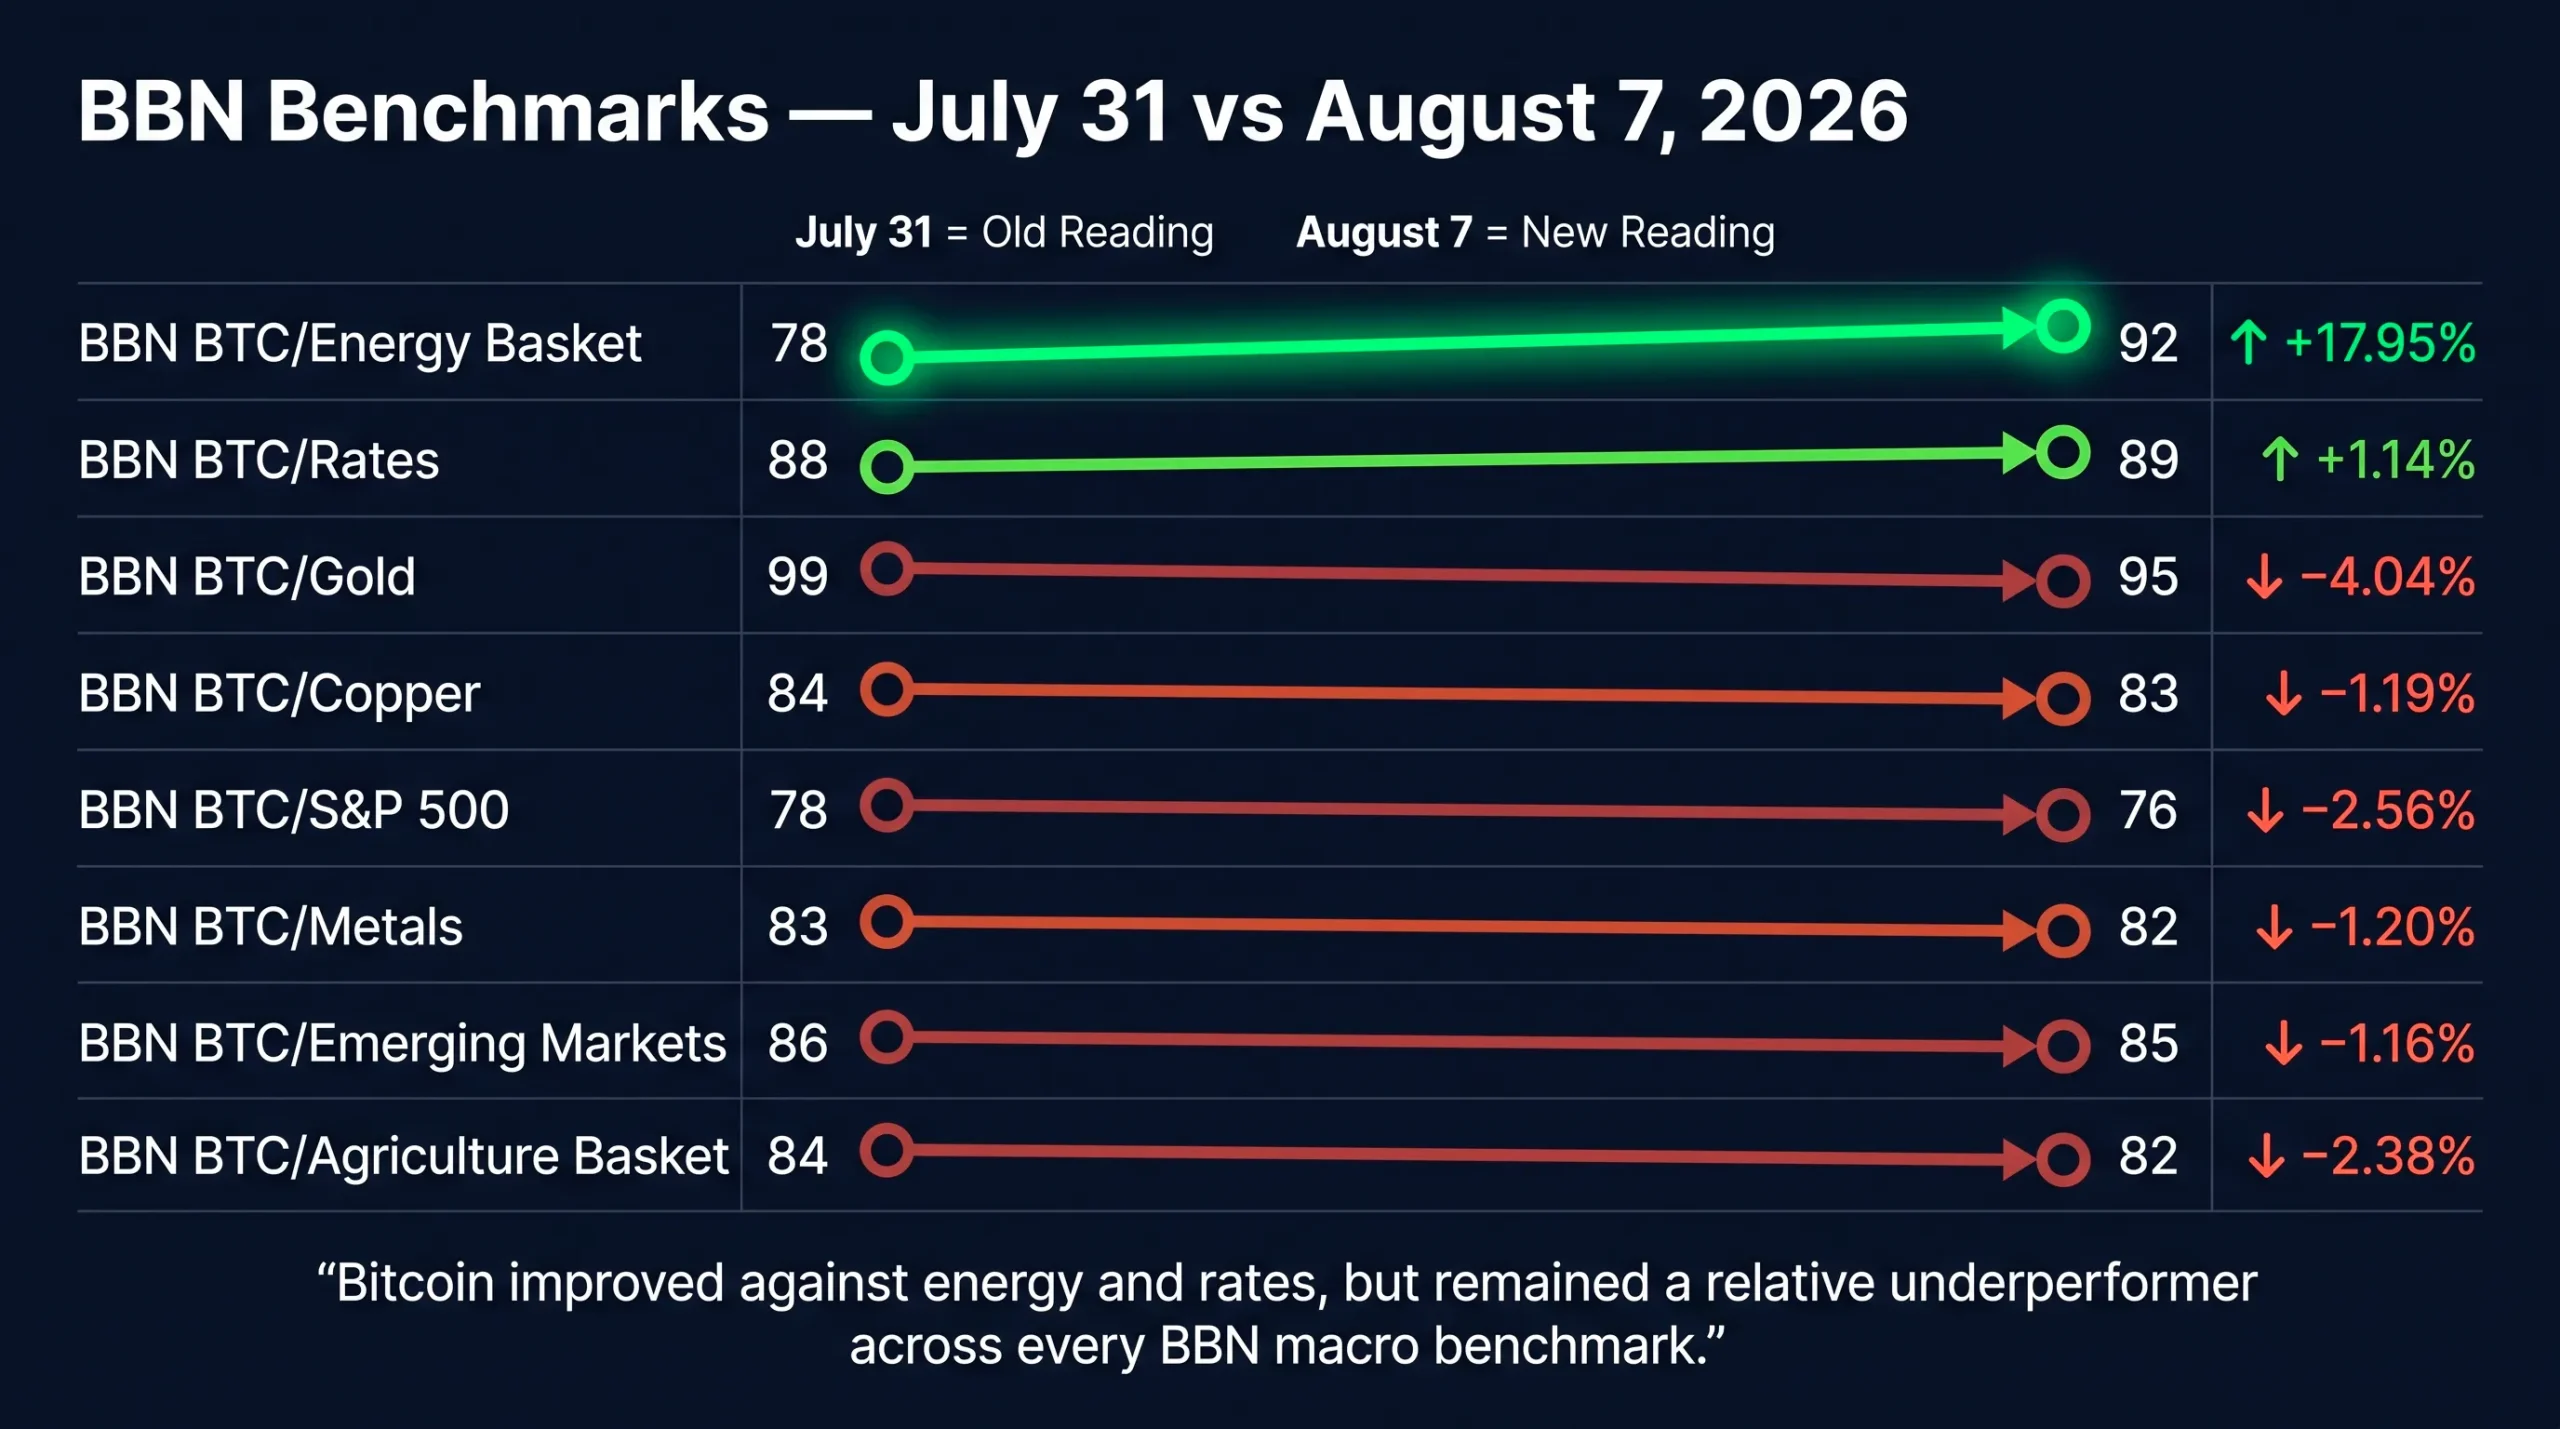
The BBN Benchmarks presented a more cautious picture by August 7.
Although the headline average improved slightly, Bitcoin lost relative ground against six of the eight macro assets and baskets tracked by BitBullNews.com. The apparent recovery was driven almost entirely by one exceptional move in the BBN BTC/Energy Basket.
The distinction between the two BitBullNews data families is important. BBN Indices use 50 as the neutral level, measuring whether different parts of the crypto industry are expanding or contracting. BBN Benchmarks use 100 as their neutral reference, showing whether Bitcoin is outperforming or underperforming a selected macro asset or basket.
A reading above 100 indicates that Bitcoin is ahead of the comparison asset. A reading below 100 means Bitcoin remains the relative underperformer.
Every benchmark was still below 100 on August 7.
| BBN Benchmark | July 31 | August 7 | Weekly Change | Gap From Neutral |
|---|---|---|---|---|
| BBN BTC/Gold | 99 | 95 | -4.04% | -5 |
| BBN BTC/Copper | 84 | 83 | -1.19% | -17 |
| BBN BTC/S&P 500 | 78 | 76 | -2.56% | -24 |
| BBN BTC/Metals | 83 | 82 | -1.20% | -18 |
| BBN BTC/Emerging Markets | 86 | 85 | -1.16% | -15 |
| BBN BTC/Rates | 88 | 89 | +1.14% | -11 |
| BBN BTC/Energy Basket | 78 | 92 | +17.95% | -8 |
| BBN BTC/Agriculture Basket | 84 | 82 | -2.38% | -18 |
The benchmark family average increased from 85.0 to 85.5, but that headline figure overstates the strength of Bitcoin’s relative recovery.
Excluding the Energy Basket, the average of the other seven benchmarks fell from 86.0 to approximately 84.6. In other words, Bitcoin’s overall benchmark score improved only because its relative position against energy changed dramatically. Across the rest of the macro board, the trend was predominantly negative.
Bitcoin Moved Further Away From Gold
The most symbolically important change came from BBN BTC/Gold, which declined from 99 to 95.
At the end of July, Bitcoin was only one point below the neutral level. It had come close to matching gold’s performance and briefly appeared capable of reclaiming leadership against the traditional defensive asset.
That attempt did not hold.
The decline to 95 widened the gap between Bitcoin and gold, suggesting that investors continued to favor established defensive exposure when choosing between the two monetary assets. Bitcoin was still performing better against gold than against most other assets in the BBN family, but the move away from 100 showed that its relative monetary narrative had weakened during the week.
This extended the reversal described in BitBullNews’ analysis, Bitcoin Falls Back Below Gold As Seven BBN Benchmarks Turn Lower. The July 31 update had already shown Bitcoin falling back below gold after briefly crossing the neutral line. The August 7 reading confirmed that the earlier breakout had not developed into a sustained trend.
Bitcoin did not simply remain below gold. It moved further below it.
US Equities Remained Bitcoin’s Hardest Comparison
BBN BTC/S&P 500 fell from 78 to 76, leaving it as the weakest reading in the entire benchmark family.
The result shows that Bitcoin continued to struggle against US equities. Even after the internal crypto market stabilized in July, Bitcoin did not attract enough incremental capital to outperform an equity market supported by corporate earnings, AI investment and demand for large technology companies.
A reading of 76 places the benchmark 24 points below neutral. That is a substantial relative-performance gap and one of the clearest signs that Bitcoin had not regained leadership within the wider risk-asset market.
This matters for the BBN Indices because a broad crypto expansion becomes easier when Bitcoin is winning the competition for speculative and institutional capital. When equities continue to offer stronger relative returns, investment flows that might otherwise enter crypto can remain concentrated in stocks.
The weakness in BTC/S&P 500 helps explain why BBN Activity moved only marginally above 50 in July and why BBN Revenue, Liquidity and Funding remained below neutral.
Industrial And Emerging-Market Benchmarks Also Weakened
Bitcoin also lost ground against copper, industrial metals and emerging markets.
BBN BTC/Copper declined from 84 to 83, while BBN BTC/Metals fell from 83 to 82. The moves were small, but they suggest that Bitcoin was unable to outperform assets connected to physical demand, infrastructure investment and the global industrial cycle.
Copper and industrial metals can benefit from long-term investment in electricity networks, data centers, artificial intelligence infrastructure and manufacturing capacity. These structural sources of demand can make them difficult for Bitcoin to outperform, even during periods when crypto prices are stabilizing.
BBN BTC/Emerging Markets slipped from 86 to 85, showing that emerging-market assets also remained ahead of Bitcoin on the indexed framework.
The combined weakness across equities, metals and emerging markets indicates that capital was not rotating decisively toward Bitcoin. Instead, several traditional and economically sensitive asset groups continued to offer stronger relative performance.
Rates Improved, But Not Enough To Signal A Macro Pivot
BBN BTC/Rates increased from 88 to 89, making it one of only two benchmarks to improve during the week.
The one-point gain suggests that Bitcoin performed slightly better against the interest-rate environment. That may reflect changes in yield expectations, monetary-policy positioning or demand for higher-duration risk assets.
However, the benchmark remained 11 points below neutral.
The improvement was therefore constructive but limited. Bitcoin had not yet established a clear advantage over the rates backdrop, and the move was too small to indicate a major liquidity shift or sustained monetary-policy tailwind.
For crypto, the rates benchmark remains important because expectations for monetary tightening or easing affect the opportunity cost of holding non-yielding and high-volatility assets. A move toward 100 would strengthen the case for a broader risk-on environment. A reading of 89 suggests that this transition remained incomplete.
Energy Was The Clear Outlier
The largest move by far came from BBN BTC/Energy Basket, which jumped from 78 to 92.
That represents a weekly increase of 17.95% and transformed Energy from Bitcoin’s joint-weakest comparison into the second-strongest benchmark in the family.
The scale of the move requires careful interpretation.
A relative benchmark can rise because Bitcoin strengthens, because the comparison asset weakens or because both developments occur simultaneously. The jump in BTC/Energy therefore does not automatically mean that crypto experienced an equally powerful improvement in underlying demand.
What it does show is that Bitcoin recovered substantial relative ground against energy assets.
The move lifted the overall BBN Benchmark family average even as six other readings declined. Without Energy, the broader benchmark picture would have shown a clear weekly deterioration.
At 92, BTC/Energy remained below the neutral level of 100. Bitcoin had not yet moved into outright outperformance, but it was much closer than it had been one week earlier.
Energy’s contribution is therefore both positive and cautionary. It improved the headline result, but it also concealed weakness across most of the remaining benchmark family.
Agriculture Added To The Broad Relative Decline
BBN BTC/Agriculture Basket fell from 84 to 82, a weekly decline of 2.38%.
Agriculture is influenced by a different set of forces than equities or technology assets, including weather, crop supply, fertilizer costs, transportation expenses and global food demand. Bitcoin’s underperformance against the basket therefore adds breadth to the negative signal.
The weakness was not confined to one competing asset class.
Bitcoin lost relative ground against a defensive monetary asset, US equities, industrial commodities, emerging markets and agriculture during the same observation period. That makes the deterioration more meaningful than a single isolated benchmark decline.
The Recovery Remained Internal Rather Than Macro-Led
The August 7 readings do not contradict the improvement seen in the July BBN Indices. Instead, they show that the internal crypto recovery had not yet translated into external macro leadership.
The BBN Indices found that Activity, Throughput, Settlement and Development were above 50. Crypto networks continued to process value, stablecoin rails remained expansionary, development activity improved and the operating environment became healthier than it had been in June.
But the BBN Benchmarks answer a different question: was Bitcoin outperforming the other places where global capital could be allocated?
By August 7, the answer was still no.
Bitcoin remained below 100 against every tracked macro comparison. It improved strongly against energy and modestly against rates, but weakened against six other benchmarks. The rise in the family average was therefore narrow rather than broad.
This is a key distinction for interpreting the July recovery.
Crypto can stabilize internally without immediately becoming the strongest global risk trade. Developers can continue shipping, stablecoins can settle more value and industry activity can recover while Bitcoin still trails equities, commodities and defensive assets.
That is exactly what the combined BitBullNews data showed.
The July BBN Indices described an industry moving out of contraction. The August 7 BBN Benchmarks described a market that had not yet won back macro leadership.
A convincing breakout would require more than one exceptional benchmark move. BTC/Gold would need to return toward and eventually above 100. BTC/S&P 500 would need to recover from the mid-70s. The industrial, emerging-market and agriculture comparisons would also need to show sustained improvement.
Until that happens, the BitBullNews Data framework points to a crypto industry that is stabilizing internally but still competing from a position of relative macro weakness.
Why It Matters
The July BBN Indices show a crypto industry recovering from stress, but doing so unevenly.
The strongest parts of the market were the parts closest to infrastructure. Stablecoins continued to settle value. Networks continued to process transactions. Major protocol teams continued to ship upgrades. Activity returned as Bitcoin and Ethereum recovered.
The weaker parts were the parts that require broad confidence.
Revenue remained below neutral because trading volume did not match the price rebound. Labor improved but companies continued to restructure. Funding was dominated by a few large transactions. Liquidity recovered around major assets but remained shallow across the wider market.
This is not a bearish picture in the conventional sense. Four indices moved above 50, and every index except Settlement improved from June. But it is not yet a broad risk-on environment either.
A stronger industry-wide recovery would require several developments at the same time:
- BBN Activity staying above 50 for more than one month;
- BBN Revenue moving toward expansion on stronger trading and protocol income;
- BBN Liquidity improving beyond Bitcoin and Ethereum;
- BBN Labor crossing 50 through net hiring rather than vacancy replacement;
- BBN Funding gaining breadth across investors, stages and sectors;
- BBN Settlement remaining above neutral even as its June base effect fades.
July did not confirm a new crypto boom. It confirmed that June’s contraction was not turning into a collapse.
The market’s infrastructure remained functional, developers kept shipping and institutional capital continued to support selected businesses. But the operating recovery was still narrower than the price recovery.
For BitBullNews.com’s BBN Indices family, the message is clear:
Crypto stabilized in July, but the industry still needs stronger revenue, deeper liquidity and broader capital formation before stabilization can become expansion.