


Bitcoin is no longer trading like a market that is still in panic mode.
As of April 14, BTC was back near $74.8K, close to the most important near-term resistance on the chart, after rebounding sharply from the high-$68K area seen a week earlier. That alone would be notable. What makes it more important is the context: Bitcoin is recovering at the same moment that global risk appetite is improving again, U.S. equities are pressing back toward record highs, oil has pulled off its panic peaks, and on-chain data no longer look like a market sliding into a new leg down.
This is the core BitBullNews editorial view: Bitcoin still has work to do before anyone can call this a clean new bull leg, but the structure is no longer bearish in the way it looked only a few weeks ago. The market is shifting from “survive the selloff” to “test whether the rebound can become a breakout.” And right now, that entire transition runs through one price: $75,000.
The Macro Backdrop Has Turned From Headwind to Tailwind
The first reason the Bitcoin setup looks stronger this week is simple: macro has stopped actively fighting the trade.
After the temporary U.S.-Iran ceasefire headlines hit on April 8, global markets immediately flipped into relief mode. In the AP’s ceasefire rally report, the S&P 500 jumped 2.5%, the Dow surged 1,325 points, and oil plunged below $95 a barrel. That was the first signal that investors were willing to price de-escalation rather than just escalation. Then, even after weekend talks failed to produce a final agreement, the market still held up. In AP’s April 14 Asia and oil update, Asian equities rose again and oil fell as traders focused on the possibility of a second round of U.S.-Iran talks.
That matters because Bitcoin has been trading as a global liquidity asset all year. When markets fear energy shocks, inflation shocks, and geopolitical spillover, BTC gets hit like a high-beta risk asset. When those same fears begin to soften, even slightly, Bitcoin tends to rebound faster than traditional markets because it is more reflexive and more sensitive to positioning. That reflexivity is exactly what we are seeing now.
The U.S. equity tape reinforces the same message. In AP’s April 13 market recap, the S&P 500 rose another 1% to 6,886.24 and moved back to within 1.3% of its record high, even though oil had briefly pushed above $100 after the latest talks failed. That is not how a market trades when investors believe the worst-case macro scenario is still the base case. That is how a market trades when it is starting to trust that the shock can be absorbed.
Wall Street is also explicitly leaning that way. In MarketWatch’s report on JPMorgan’s latest note, the bank’s strategists told investors with at least a three-month horizon to keep buying the dip. And in MarketWatch’s coverage of Tom Lee’s call, Lee argued that the ceasefire backdrop likely marked the bottom for stocks and stayed constructive on crypto as well. You do not need to agree with every bullish strategist to see the shift: the mainstream conversation has moved from defense to selective re-risking.
Bitcoin Is Not Just Following Risk-On — It Is Leading It
Bitcoin’s own price behavior looks stronger than a simple sympathy bounce.
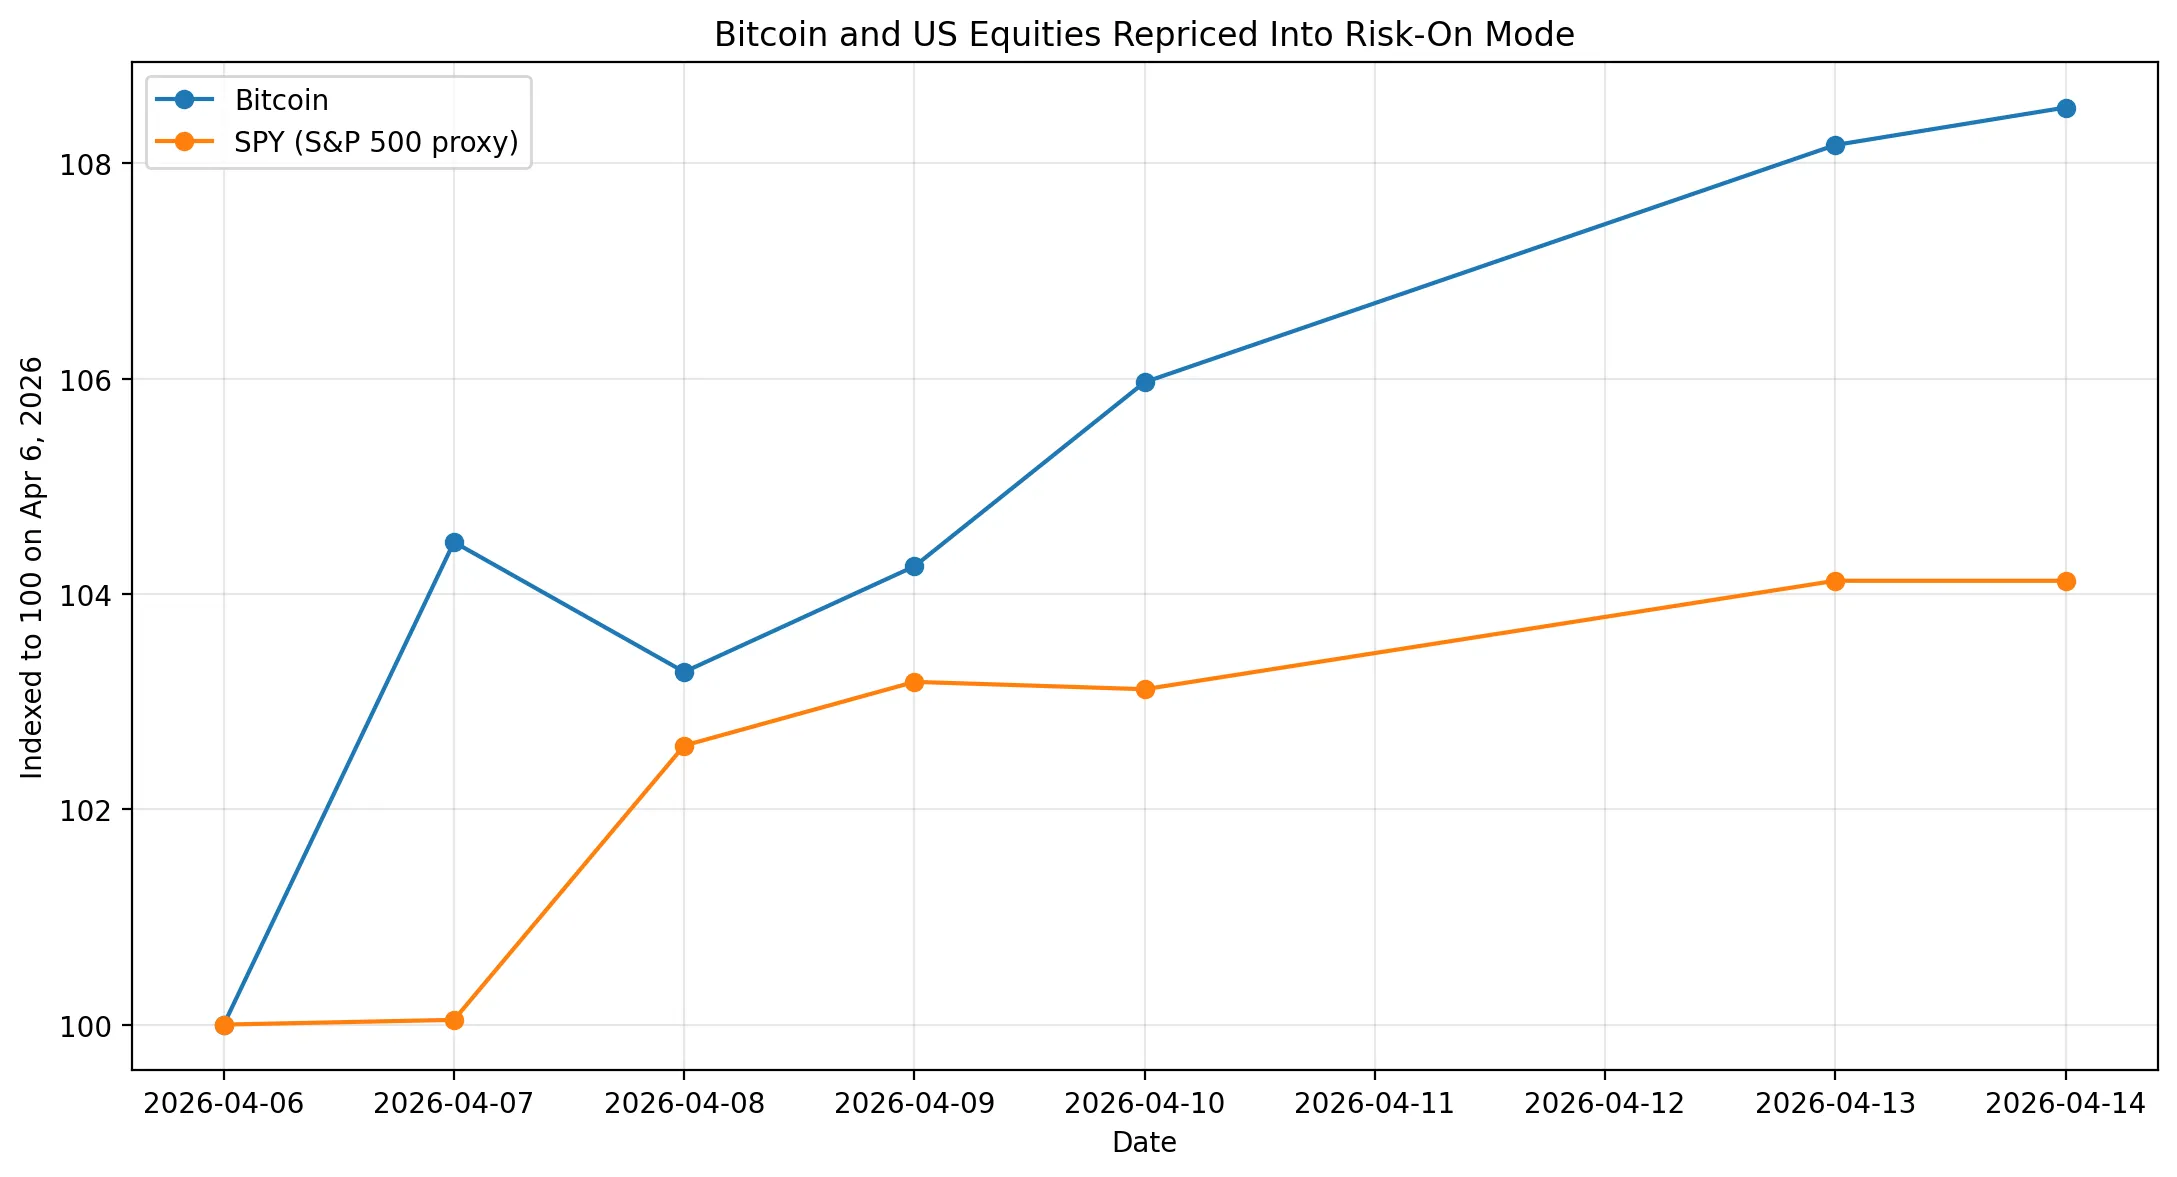
Using CoinGecko’s daily Bitcoin price history, BTC closed at $68,864 on April 6 and $74,515 on April 13. That is roughly an 8.2% move in a week. Meanwhile, U.S. equities staged a strong relief rally but still moved with much lower beta. In other words, Bitcoin is not merely recovering because stocks are green. It is outperforming inside a recovering macro tape, which is usually what leadership looks like in the early stage of a market rebound.
That distinction matters. In weak rebounds, Bitcoin usually lags and traders sell strength quickly. In stronger rebounds, BTC starts acting like the market’s preferred expression of renewed risk appetite. This week looks much closer to the second pattern than the first. Even after geopolitical headlines stayed messy, Bitcoin kept grinding higher instead of rolling back over. That tells you buyers are no longer waiting for perfect conditions. They are stepping in ahead of them.
On-Chain No Longer Looks Like a Breakdown Market
The second major reason this setup deserves attention is on-chain structure.
The best way to describe the current on-chain picture is this: Bitcoin is no longer in clean capitulation, but it is not yet in full bull-market expansion either. That middle state is exactly where important bottoms and early recovery rallies tend to form.
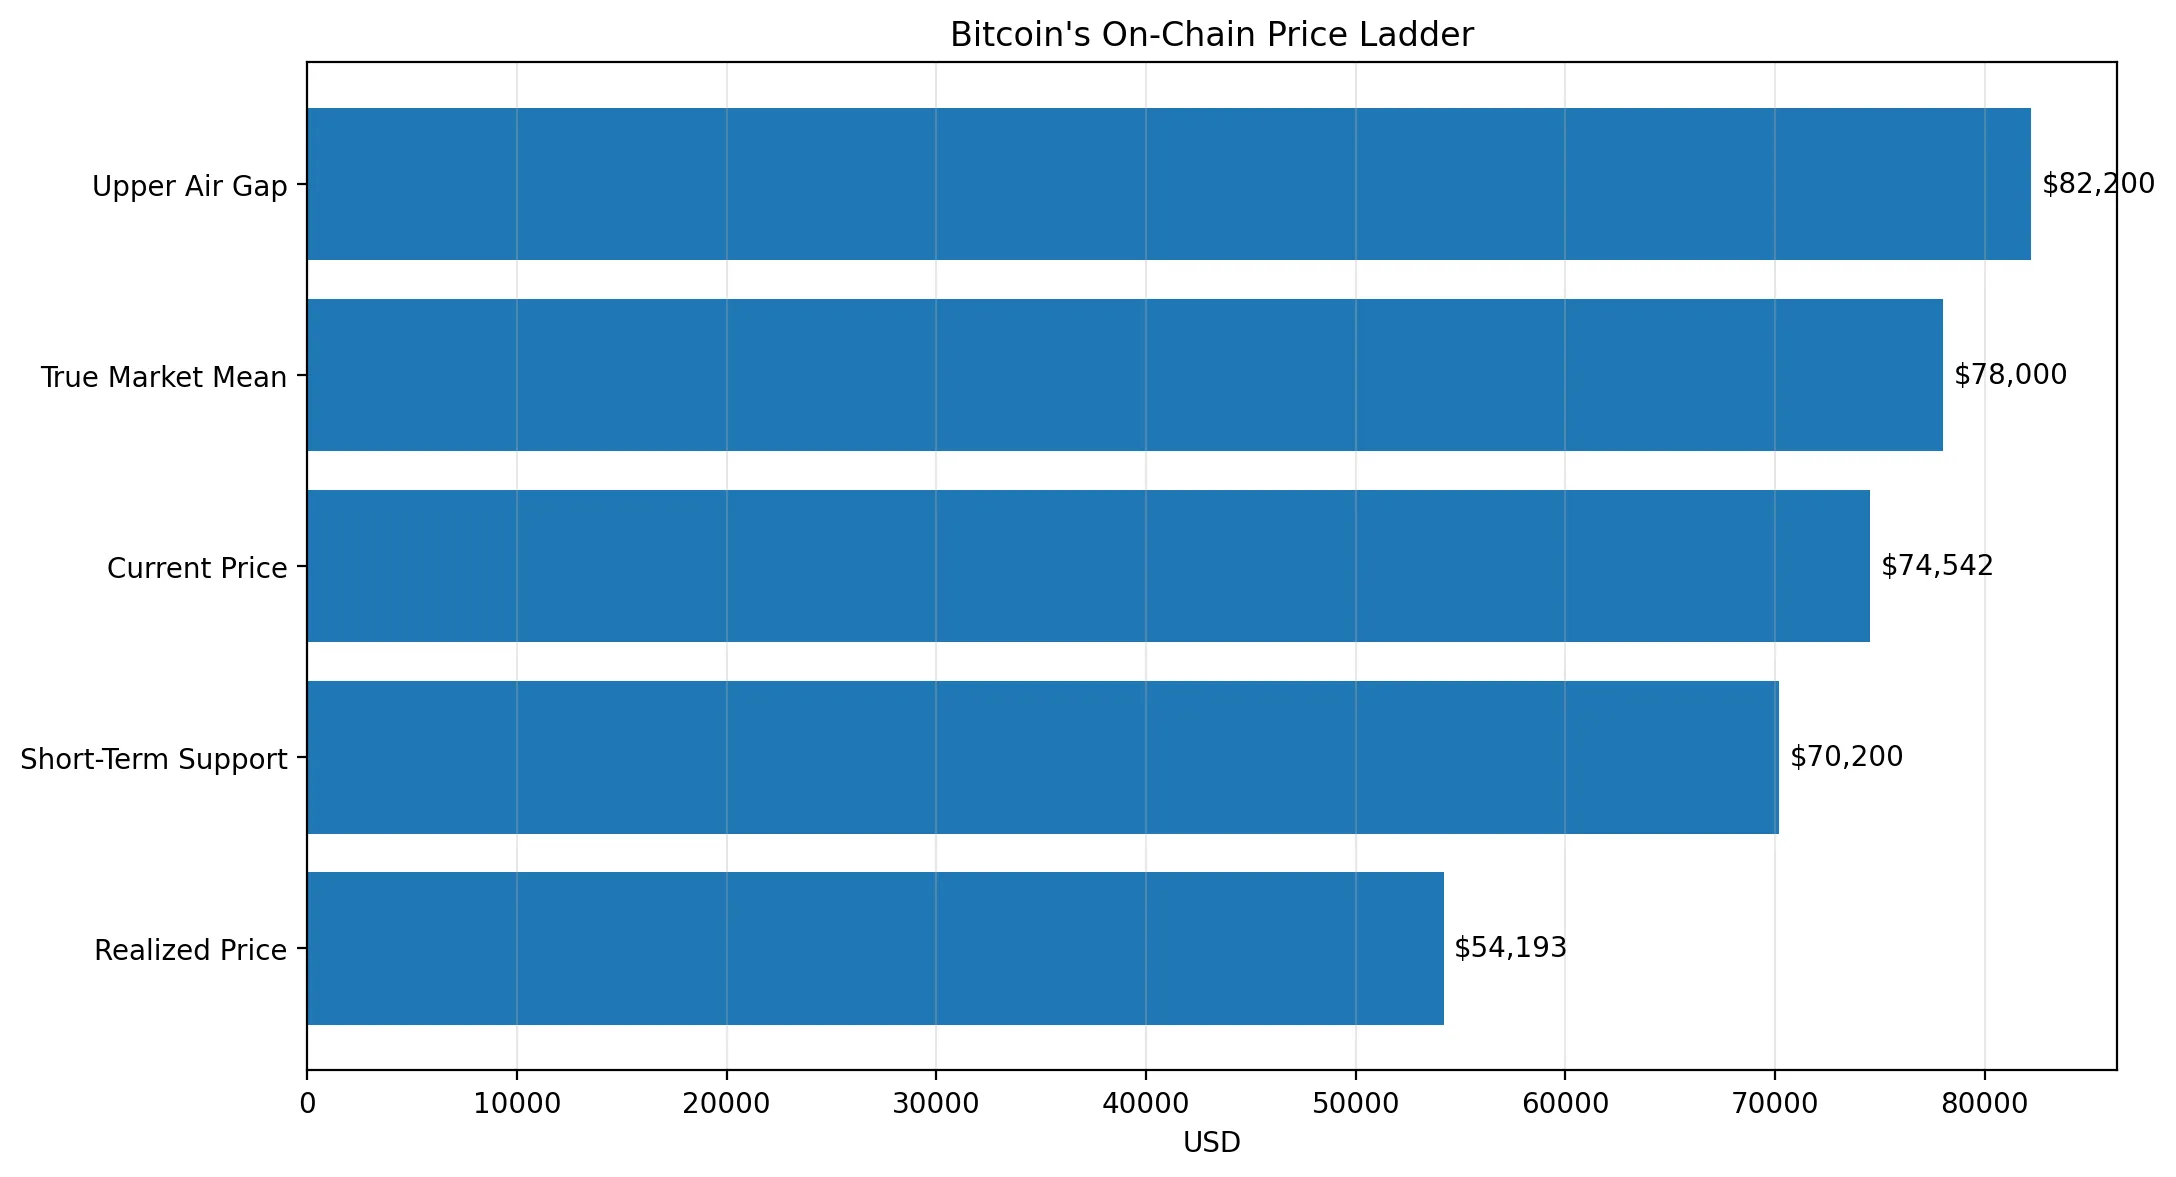
In Glassnode’s Week On-chain report, “Bouncing in a Bear”, the firm says early signs of de-escalation are creating room for a relief rally above $70K. But it also makes an important distinction: Bitcoin is still trading inside what Glassnode calls the bear-market value zone. Realized Price sits around $54K, True Market Mean around $78K, and the Short-Term Holder Cost Basis around $81.6K. That means the market has improved, but it has not yet reclaimed the levels that usually confirm a deeper structural recovery.
That sounds less bullish than the headline, but in practice it is constructive. Why? Because it means Bitcoin is already off the floor while still far below the levels that would typically trigger broad profit-taking from late-cycle buyers. A market in that position can still move a lot higher before it starts feeling crowded again. Glassnode’s own framework says a bounce toward the True Market Mean near $78K is plausible, while the real “market structure has changed” confirmation only comes later if BTC can reclaim the short-term holder break-even zone closer to $81.6K.
The raw metrics also look meaningfully better than they did during the recent stress phase. On Glassnode Studio’s Percent Supply in Profit chart, 63.182% of Bitcoin supply is back in profit. On the MVRV chart, the ratio is around 1.33, which suggests the market is back above aggregate cost basis but nowhere near the sort of euphoric premium associated with late-cycle overheating. On the Realized Price chart, the network-wide cost basis is about $54,156.
That combination is important analytically. A market with more than 60% of supply in profit and MVRV above 1 is not behaving like a market still searching for a final flush. But because MVRV remains relatively restrained, it is also not behaving like a market already fully repriced into mania. The simplest interpretation is that Bitcoin has moved from distress into recovery, but not yet from recovery into acceleration. That leaves room for a breakout leg if price can clear the next resistance cluster.
There are also signs that the spot side of the market is becoming healthier. In Glassnode’s ETF flow report, U.S. spot Bitcoin ETFs showed latest net inflows of about 2,331 BTC, and in the weekly research note Glassnode says the 14-day average has flipped back into modest inflow territory after a long stretch of outflows. That is not a full demand flood yet, but it is exactly the kind of directional improvement you want to see if you are arguing that the low is in and institutional pressure is stabilizing rather than worsening.
Network activity also does not look dead. On Glassnode’s Active Addresses chart, active addresses were running near 624,265 over the latest 24 hours. Exchange balances were about 3.03 million BTC on the all-exchange balance chart, while illiquid supply stood around 13.4 million BTC and long-term holder supply around 14.67 million BTC on the corresponding illiquid supply and long-term holder supply charts. Long-term holder net position change was also positive, around 90,012 BTC. None of those metrics alone proves a bull market, but together they support a stronger conclusion: coins are not flooding back to exchanges, sticky holders are still dominant, and the sell-side picture looks much less aggressive than it did during the drawdown.
The Derivatives Picture Still Favors the Bulls
This is where the article becomes more than just a macro story.
In Glassnode’s “Awaiting Liquidity” report, perpetual futures funding remained negative even as Bitcoin stabilized and attempted to recover. Glassnode’s interpretation is straightforward: short positioning still dominates, and crowded shorts can become fuel for price if momentum continues upward. In the same report, the firm notes that ETF flows were starting to rebound while spot demand, although still soft, was no longer deteriorating in the same way.
The latest weekly report adds another useful detail. Glassnode says a pocket of long gamma has developed between $69K and $71.5K, which may help contain downside in the near term, while short gamma sits overhead beyond $80K. That creates a clean tactical map: the market now has visible near-term support under spot, but also a zone above $80K where upside can become more unstable and faster if price gets there. This is exactly the kind of setup where a push through obvious resistance can snowball into a squeeze.
This is also why the current rally feels more dangerous for bears than for bulls. Shorts are still leaning into the move, yet price has stopped obeying the bearish script. In crypto, that can persist for a while, and then suddenly not persist at all. Once the market senses that the short side is trapped beneath a clean breakout, it often front-runs the squeeze.
Why $75,000 Is the Most Important Price on the Chart
A stronger article needs a stronger answer to the obvious question: why exactly does $75K matter?
Because it is not just a psychological round number. It is the visible near-term ceiling separating “recovery bounce” from “breakout continuation.”
Bitcoin is trading just below that zone now, and recent daily closes from CoinGecko’s BTC history show the market repeatedly pressing into the low-to-mid $74K area after bouncing from $68K. The current spot price is also sitting right under that barrier. In practical trading terms, $75K is the level where bears still have a narrative. Above it, they start losing one.
A decisive break above $75K would matter for three reasons at once.
First, it would confirm that the high-$68K zone likely was the local bottom of the recent panic leg. Second, it would open the path toward Glassnode’s True Market Mean near $78K, which is the first real on-chain upside magnet above current price. Third, it would move Bitcoin closer to the more important $80K-$81.6K region, where short gamma and the short-term holder cost basis sit. Markets often accelerate when they move from a headline-driven bounce into a level-driven squeeze, and $75K is the handoff point.
Put differently: $75K is the trigger, $78K is the first target, and $80K-$81.6K is the real test.
Bitcoin Price Prediction: The Bull, Base, and Bear Cases
A stronger prediction piece should not pretend there is only one path. It should lay out scenarios.
Bull Case: $75K breaks, $78K comes quickly, and $80K-$82K enters play
This is the highest-probability bullish path from here.
If Bitcoin gets a convincing daily close above $75K and then holds the level on the next pullback, the most logical near-term move is a push into the True Market Mean around $78K. If ETF inflows continue improving, spot participation expands, and shorts are forced to cover, the move can then extend toward the low $80Ks, where Glassnode’s short gamma and short-term holder break-even zone begin to matter more. In this scenario, the 7-day target becomes roughly $76.5K-$78.5K, while the 30-day bullish target moves into the $80K-$82K region.
Base Case: Bitcoin ranges between $70K and $75K before the next leg
This is still a constructive outcome, not a bearish one.
Glassnode continues to describe the rebound as early and still lacking full conviction, with spot volumes soft and derivatives participation subdued. That means the market may need more time to absorb overhead supply and let confidence rebuild. A range between roughly $70K and $75K would allow Bitcoin to digest recent gains, pull in fresh buyers, and force late shorts to stay uncomfortable without yet delivering a headline breakout. In editorial terms, that would look less exciting day to day, but it would arguably create a healthier foundation for a later move toward $78K and beyond.
Bear Case: the breakout fails and BTC loses the support shelf
The bearish invalidation is clearer now than it was a week ago.
Glassnode’s latest derivatives map shows long gamma support between $69K and $71.5K. If Bitcoin loses that zone on a closing basis and cannot reclaim it quickly, then the current move starts looking less like a recovery and more like another failed relief bounce. In that case, a retest of the mid-to-high $67K area becomes possible, especially if macro headlines worsen and ETF inflows stall again. The bigger bullish thesis is not destroyed by one rejection, but it is postponed if BTC falls back below the support shelf that has started to form under spot.
Final Verdict
The strongest analytical reading of Bitcoin right now is not “full bull market confirmed.”
It is this: the market has likely already passed through its most dangerous short-term phase, and it is now setting up for a decisive test of whether recovery can become trend.
Macro conditions are no longer uniformly hostile. Wall Street is buying weakness again. Oil panic has cooled from its extremes. ETF flows have stopped bleeding and turned modestly positive. More than 63% of Bitcoin supply is back in profit, but MVRV is still restrained enough to suggest there is room before conditions become overheated. Long-term holders remain dominant, exchange balances are not flashing major distribution, and the derivatives market still carries the kind of defensive short bias that can fuel a squeeze higher.
So the clearest BitBullNews call is this: Bitcoin looks bullish in an early-recovery sense, not euphoric in a late-cycle sense. That is exactly why the setup is interesting.
If $75,000 breaks and turns into support, the next move toward $78,000 becomes the path of least resistance, and a fast extension into the $80,000-$82,000 zone becomes realistic. If $75,000 rejects price again, Bitcoin can still consolidate without breaking the bigger recovery thesis. But as long as BTC holds the $69K-$71.5K support pocket and keeps pressing the ceiling, the burden of proof is no longer on the bulls.
It is on the bears.