


Content
The newest RWA watch confirms that tokenization is still growing, but not evenly, and not always in the way headline market-size numbers suggest.
As of April 7, 2026, the uploaded report shows $27.98B in distributed RWA value, up 5.77% over roughly 30 days, alongside $142.26B in represented RWA value, down 58.95%. That drop is too large to read as a normal investor outflow story. The report itself flags it as likely driven in large part by coverage or classification changes, especially because a late-March snapshot still showed represented value in the mid-$300B range. At the same time, total holders rose to 713,976, up 5.62%, which means the market broadened even as one major category definition shifted under the surface.
The most important practical conclusion is that the RWA market continued to expand where crypto and traditional finance already overlap cleanly: tokenized U.S. Treasuries, institutional fund wrappers, and a few dominant credit platforms. What did not expand as convincingly was broad secondary liquidity. The strongest products added AUM, but the gap between headline asset value and actually usable on-chain liquidity remains large. That is the key theme of this issue and the clearest continuation from the previous March edition.
Continuity With the Previous March Edition
The previous BitBullNews RWA watch already argued that the most successful products were the ones solving cash management, custody, collateral, and settlement rather than promising immediate open-market liquidity. This new report strengthens that thesis.
The distributed side of the market grew from the high-$20B range rather than collapsing, tokenized Treasury products remained the core growth engine, and the report explicitly shows that many of the largest and most institutionally important balances still sit in represented or otherwise constrained forms. In other words, the sector did not disprove the previous issue. It clarified it. The fastest-growing corner of RWA is still the one closest to tokenized cash and short-duration yield, not the broadest possible vision of fully open tokenized capital markets.
Market Structure Snapshot
The report’s top-level composition makes the current market structure easy to read.
Table 1. Headline RWA market snapshot as of April 7, 2026
| Metric | Reading | 30D change |
|---|---|---|
| Distributed RWA value | $27.98B | +5.77% |
| Represented RWA value | $142.26B | -58.95% |
| Total RWA holders (ex stablecoins) | 713,976 | +5.62% |
| Stablecoins (context) | $300.53B | +0.38% |
The headline growth was real on the distributed side, but the represented side needs interpretation. The report is explicit that the sharp represented-value drop likely reflects classification or coverage changes more than simple redemption pressure. That is an important distinction, because a naive reading would suggest a massive capital exodus that the rest of the data does not support.
Just as important, the report pairs RWA.xyz with DefiLlama’s RWA dashboard to separate issued or tracked value from actually active DeFi usage. DefiLlama’s current RWA dashboard shows about $15.2B in on-chain RWA market cap and about $1.108B in DeFi Active TVL, while Ethereum’s own RWA chain page alone accounts for roughly $832.96M in DeFi Active TVL. That means only a small single-digit share of tracked RWA value is actively deployed inside DeFi at any given time, which is exactly the kind of liquidity gap our previous March watch warned about.
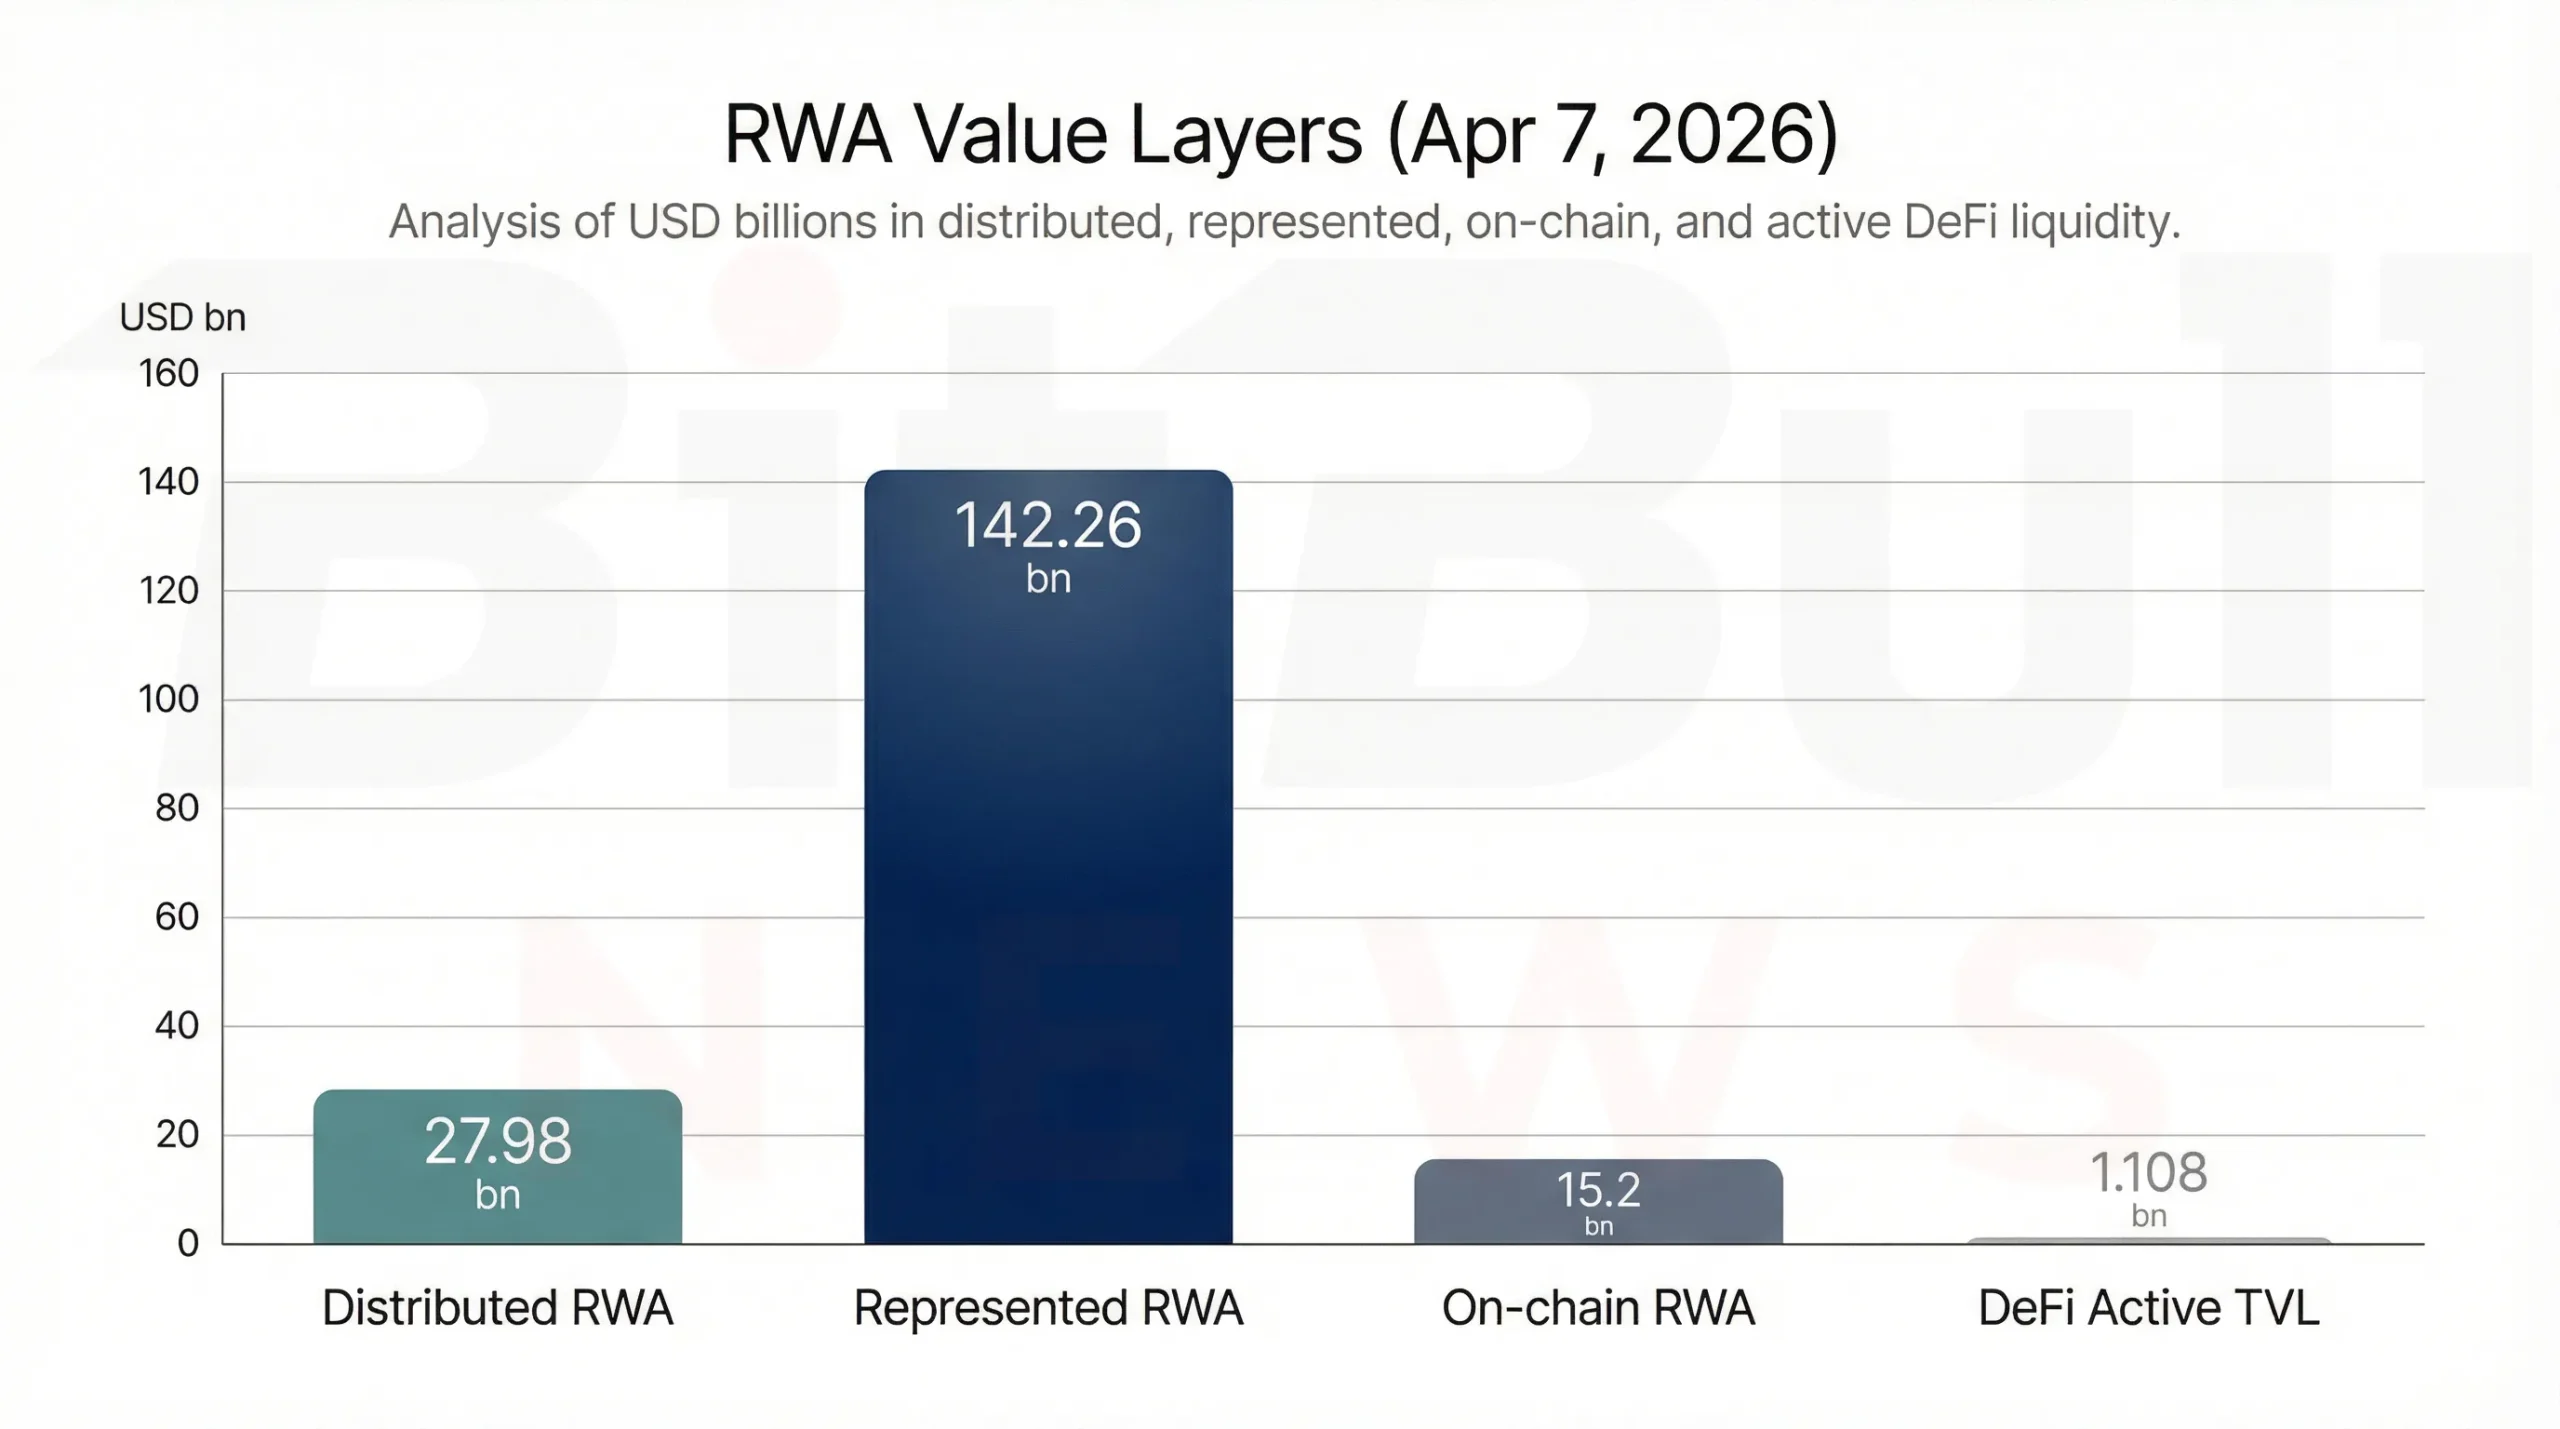
Chart 1. The gap between distributed value, represented value, on-chain RWA market cap, and DeFi-active TVL shows why headline tokenization size is still much larger than composable on-chain liquidity.
Tokenized Treasuries and Money-Market Instruments
Tokenized Treasuries remained the clearest institutional-grade growth segment in the market. But the most important development was who grew and how they grew.
Table 2. Major Treasury and cash-equivalent RWA products
| Product | AUM | 30D change | Est. AUM change | Holders | Monthly transfer volume | Transfer volume / AUM |
|---|---|---|---|---|---|---|
| USYC | $2.686B | +33.12% | +$0.67B | 44 | $592.0M | 22.0% |
| BUIDL | $2.248B | +9.08% | +$0.19B | 57 | $85.3M | 3.8% |
| USDY | $1.867B | +41.79% | +$0.55B | 16,560 | $80.7M | 4.3% |
| JTRSY | $1.166B | +105.89% | +$0.60B | 11 | $645.8M | 55.4% |
| BENJI | $1.012B | -2.53% | -$0.03B | 1,094 | $1.62M | 0.2% |
| USTB | $0.825B | +35.33% | +$0.22B | 97 | $310.3M | 37.6% |
| OUSG | $0.688B | -8.34% | -$0.06B | 56 | $215.5M | 31.3% |
Three conclusions stand out.
First, the biggest winners were not all the same kind of product. USYC, USDY, JTRSY, and USTB all expanded sharply, but their holder bases and turnover profiles are very different. JTRSY more than doubled in 30 days while still sitting with only 11 holders, a reminder that some of the fastest-growing products are still highly concentrated and institutionally distributed. By contrast, USDY grew quickly while reaching 16,560 holders, which looks much more like scaled, broadly distributed tokenized yield.
Second, not all large Treasury AUM means broad on-chain use. BENJI still sits near $1.0B, but with only $1.62M in monthly transfer volume. That is not “dead,” but it does strongly suggest that the tokenized layer exists more as recordkeeping and structured access than as a deeply liquid circulating instrument.
Third, the category is increasingly becoming layered. The report points out that OUSG functions in part as a tokenized fund allocator holding multiple institutional money-market products, including exposure to BUIDL and other funds. That means some of the reported growth in tokenized Treasury exposure is now happening through wrappers on top of other tokenized funds, not only through direct end-investor purchase of the base products themselves.
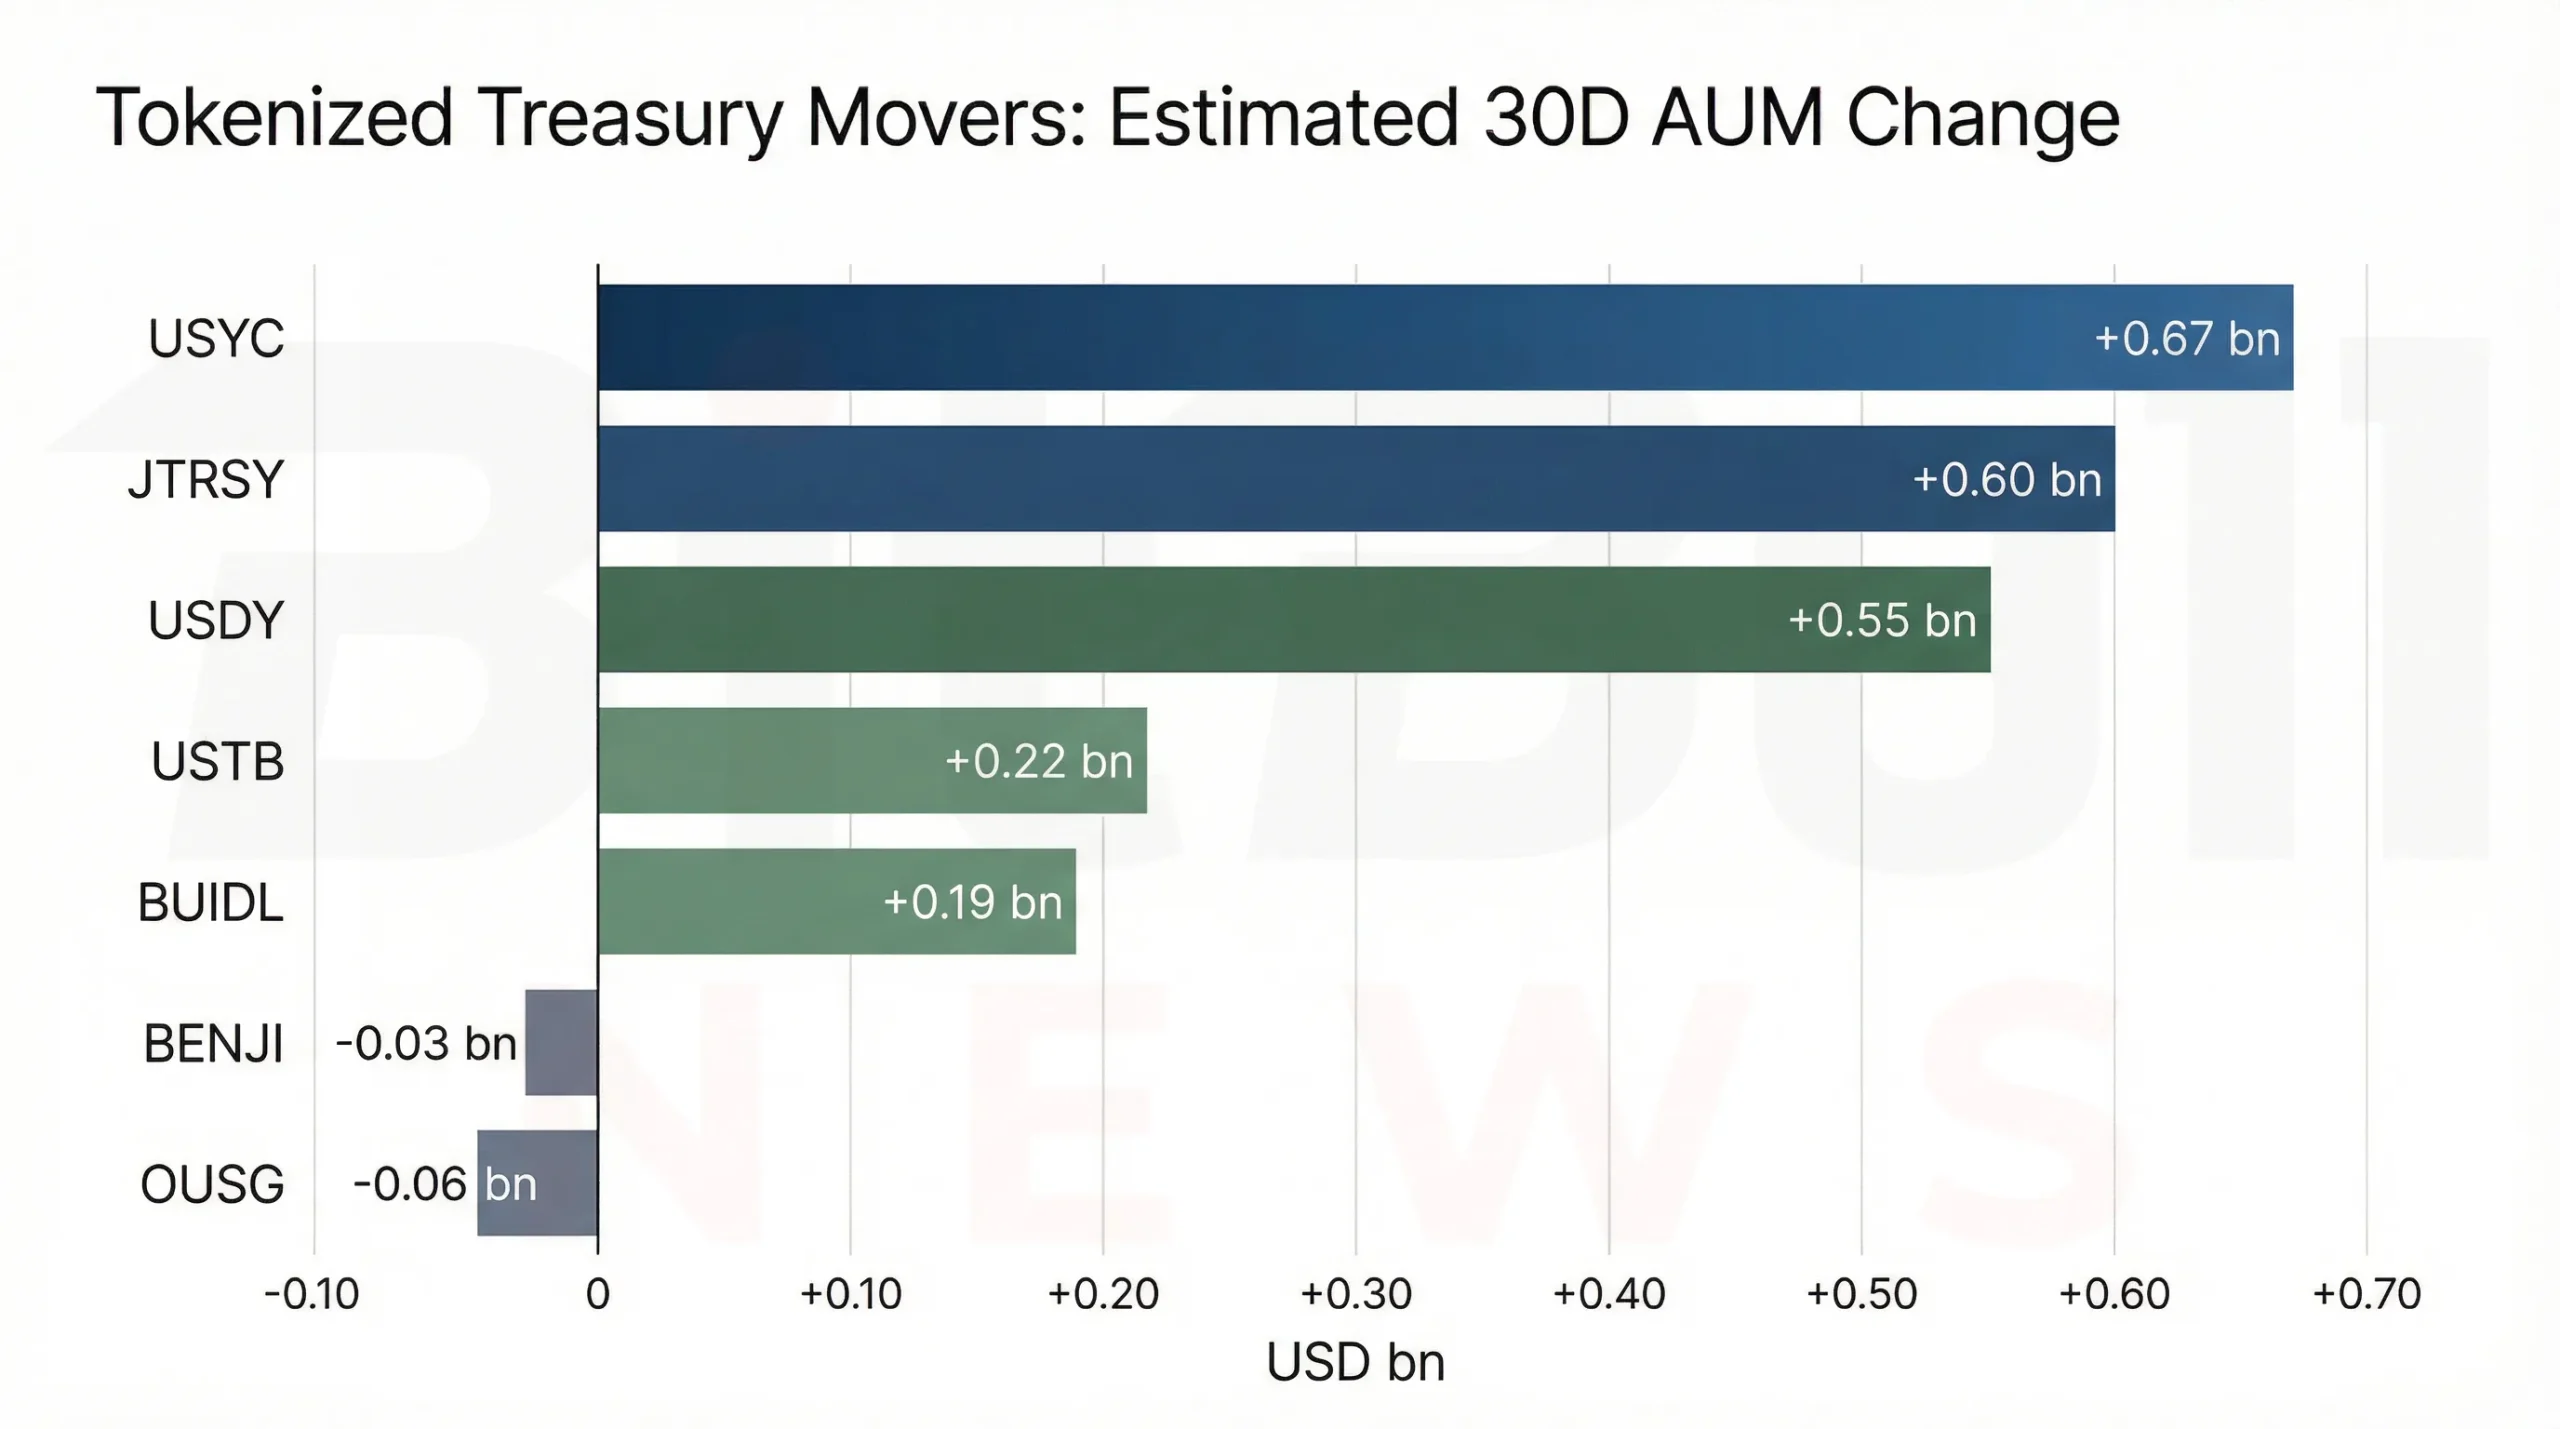
Chart 2. The strongest growth in tokenized Treasuries came from USYC, JTRSY, USDY, and USTB, while BENJI and OUSG contracted modestly over the same window.
Treasury Liquidity Reality Check
AUM growth alone is not enough. Transfer intensity tells you which products are actually moving.
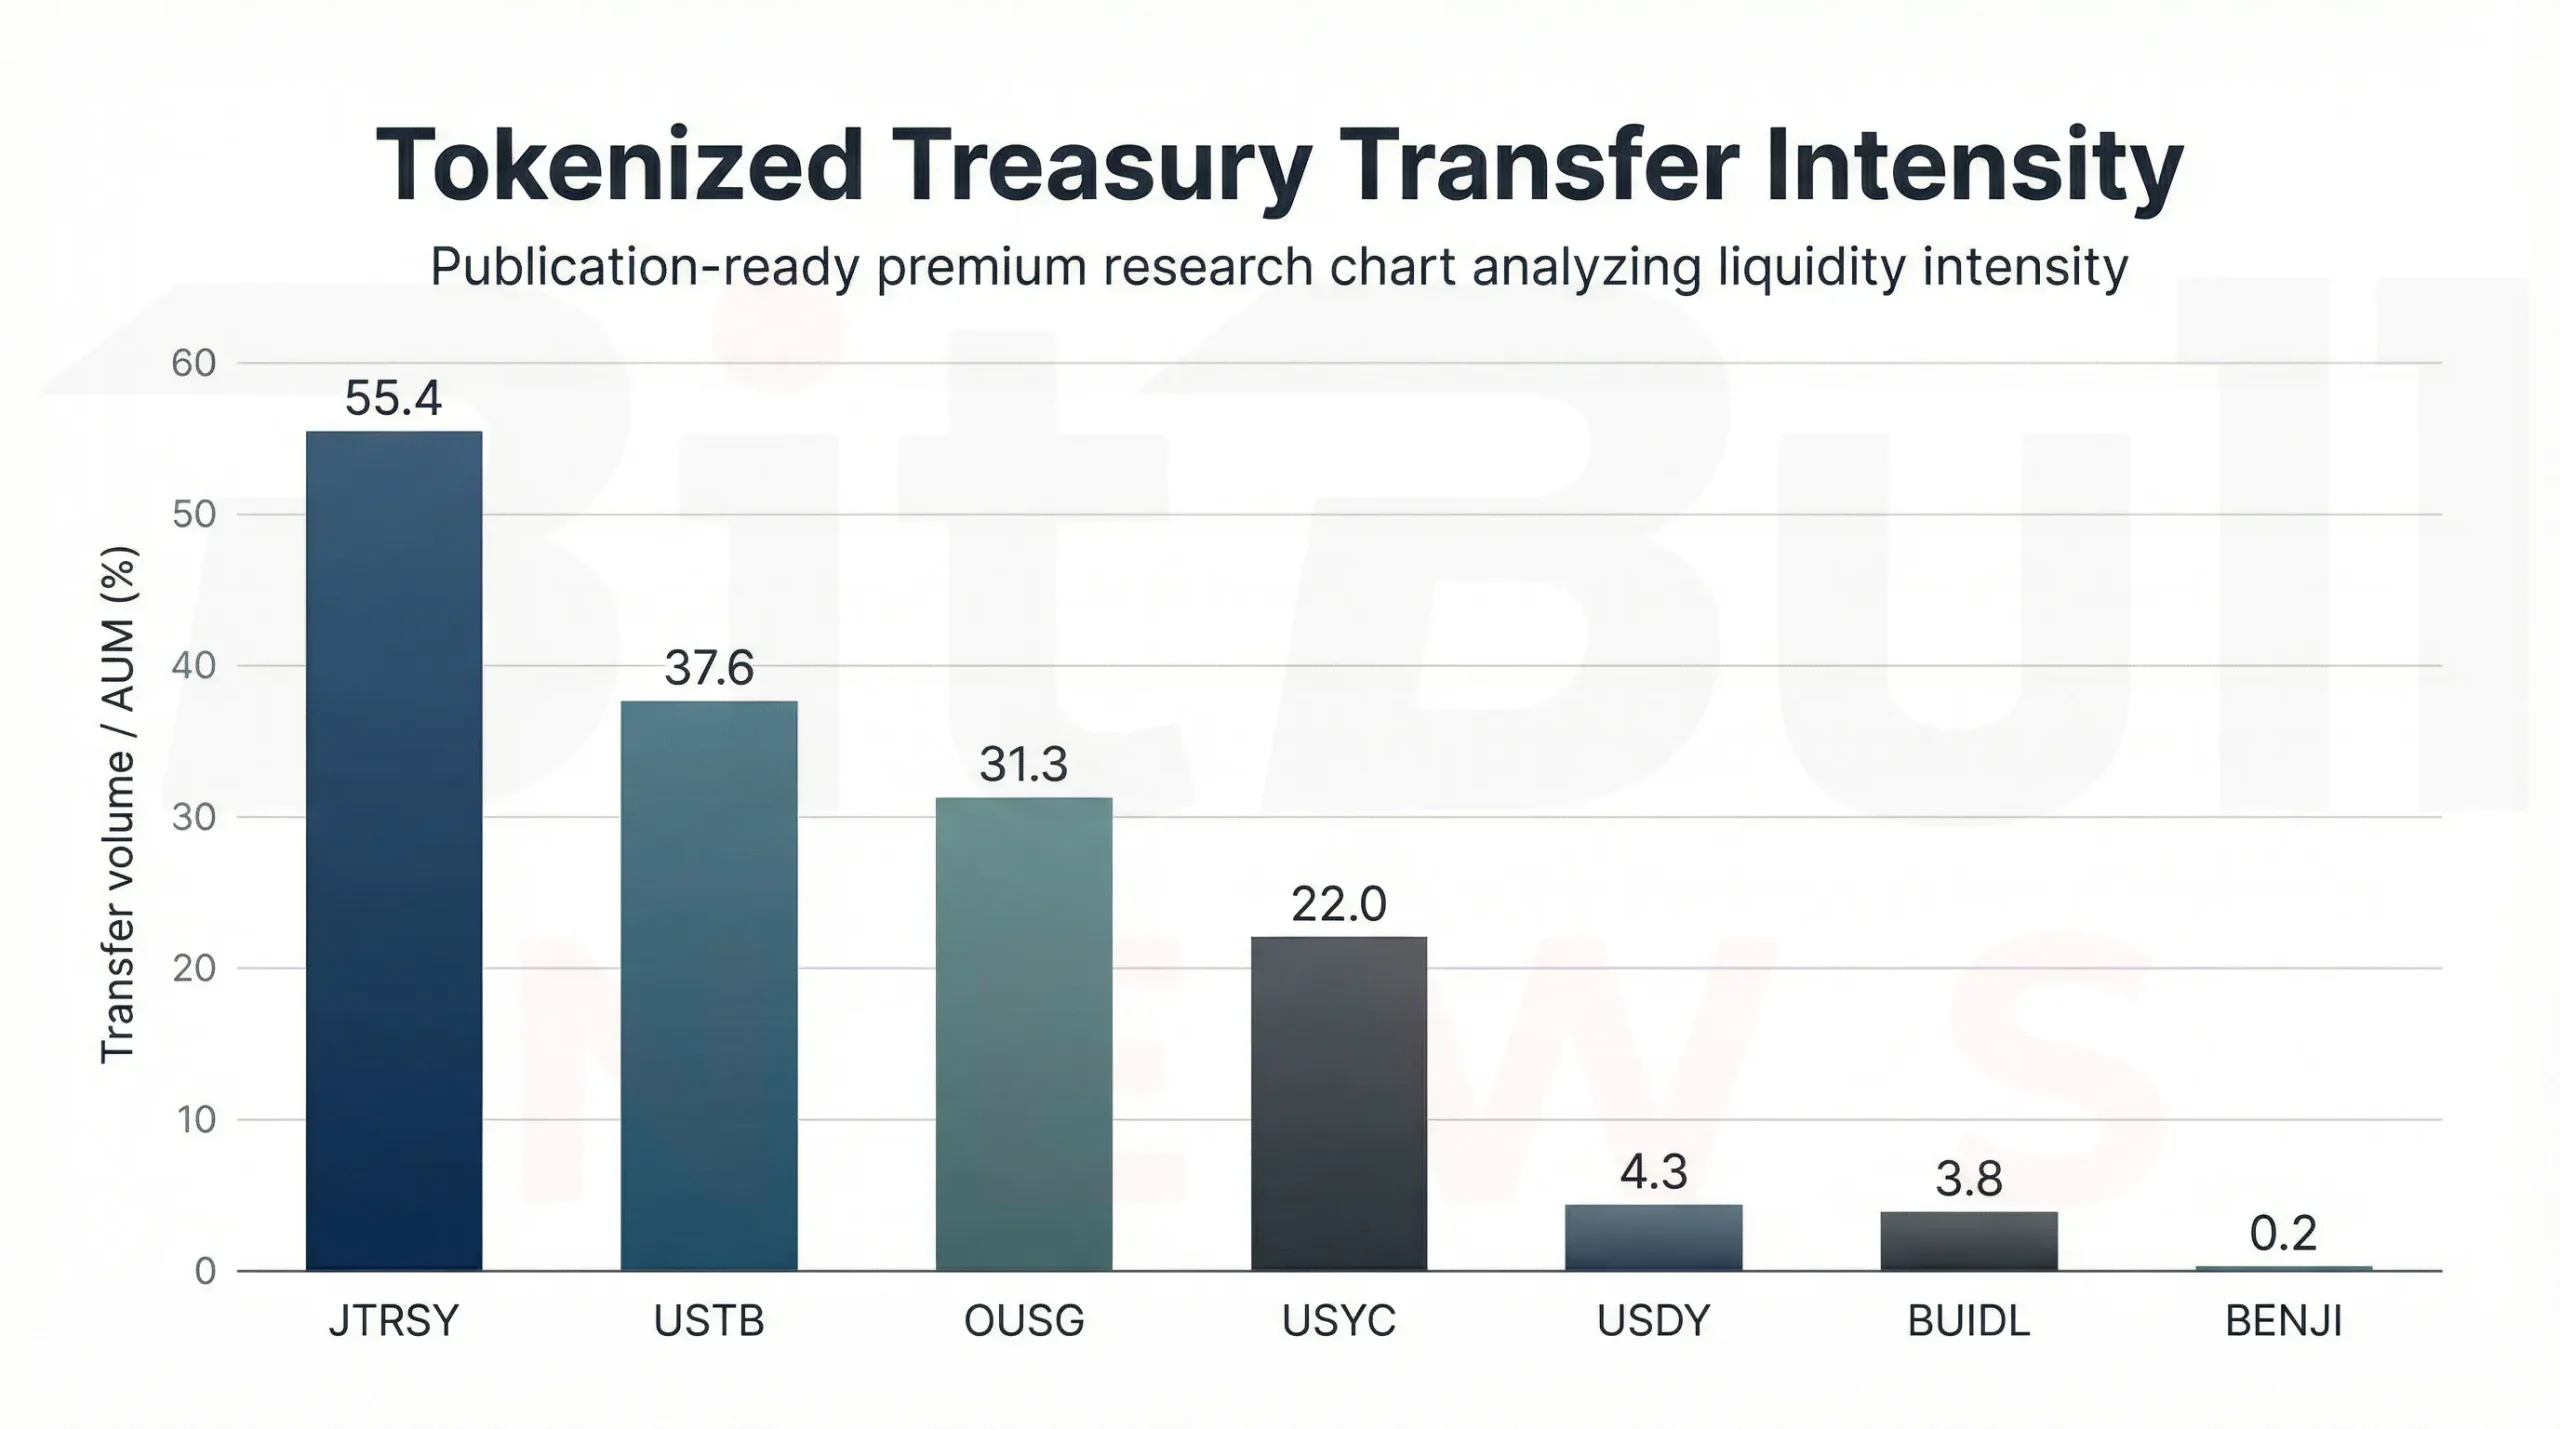
Chart 3. Transfer volume relative to AUM varies dramatically across Treasury products, highlighting the difference between tokenized balance-sheet presence and actual transactional usage.
The transfer-intensity gap is the most useful liquidity filter in the report. JTRSY at 55.4%, USTB at 37.6%, OUSG at 31.3%, and USYC at 22.0% all look meaningfully active relative to size. BUIDL at 3.8% and BENJI at 0.2% look much more static. The point is not that low-turnover products are bad. It is that they should not be marketed or interpreted as if they were all equally liquid simply because they are “on-chain.”
Private Credit and Structured Credit
Private credit remains one of the largest categories in RWA, but it is also the clearest place where the distinction between distributed and represented matters most.
As of April 7, the report shows:
- Distributed credit value: $6.00B, -5.53% over 30 days
- Represented credit value: $19.57B, +3.59%
- Holders: 184,777, -0.52%.
That split is not trivial. It means the more visibly on-chain, more DeFi-like slice of tokenized credit actually shrank over the last month, while the more represented slice still expanded modestly. In other words, the credit market is growing where it is more structured and controlled, not where it is most transparently distributed on public rails.
The platform table makes the competitive picture even clearer.
Table 3. Tokenized credit platform leadership
| Platform | Value | 30D change | Market share |
|---|---|---|---|
| Maple | $2.4B | +35.47% | 40.23% |
| STOKR | $1.3B | -25.30% | 21.92% |
| Centrifuge | $447.8M | -43.66% | 7.46% |
The real story is consolidation. Maple gained share aggressively. STOKR and Centrifuge both shrank sharply. This is not a subtle rebalancing. It is a visible winner-take-most dynamic inside tokenized credit, with Maple expanding while large competitors lost ground.
The report also gives a crucial example of why represented credit can distort market perception: Figure HELOC Token is listed at about $16.47B and classified as represented. That means a very large credit balance can exist in the RWA data without implying large, liquid, DeFi-style public-chain activity. This is exactly why headline market-size figures need to be interpreted with far more caution in credit than in simpler Treasury products.
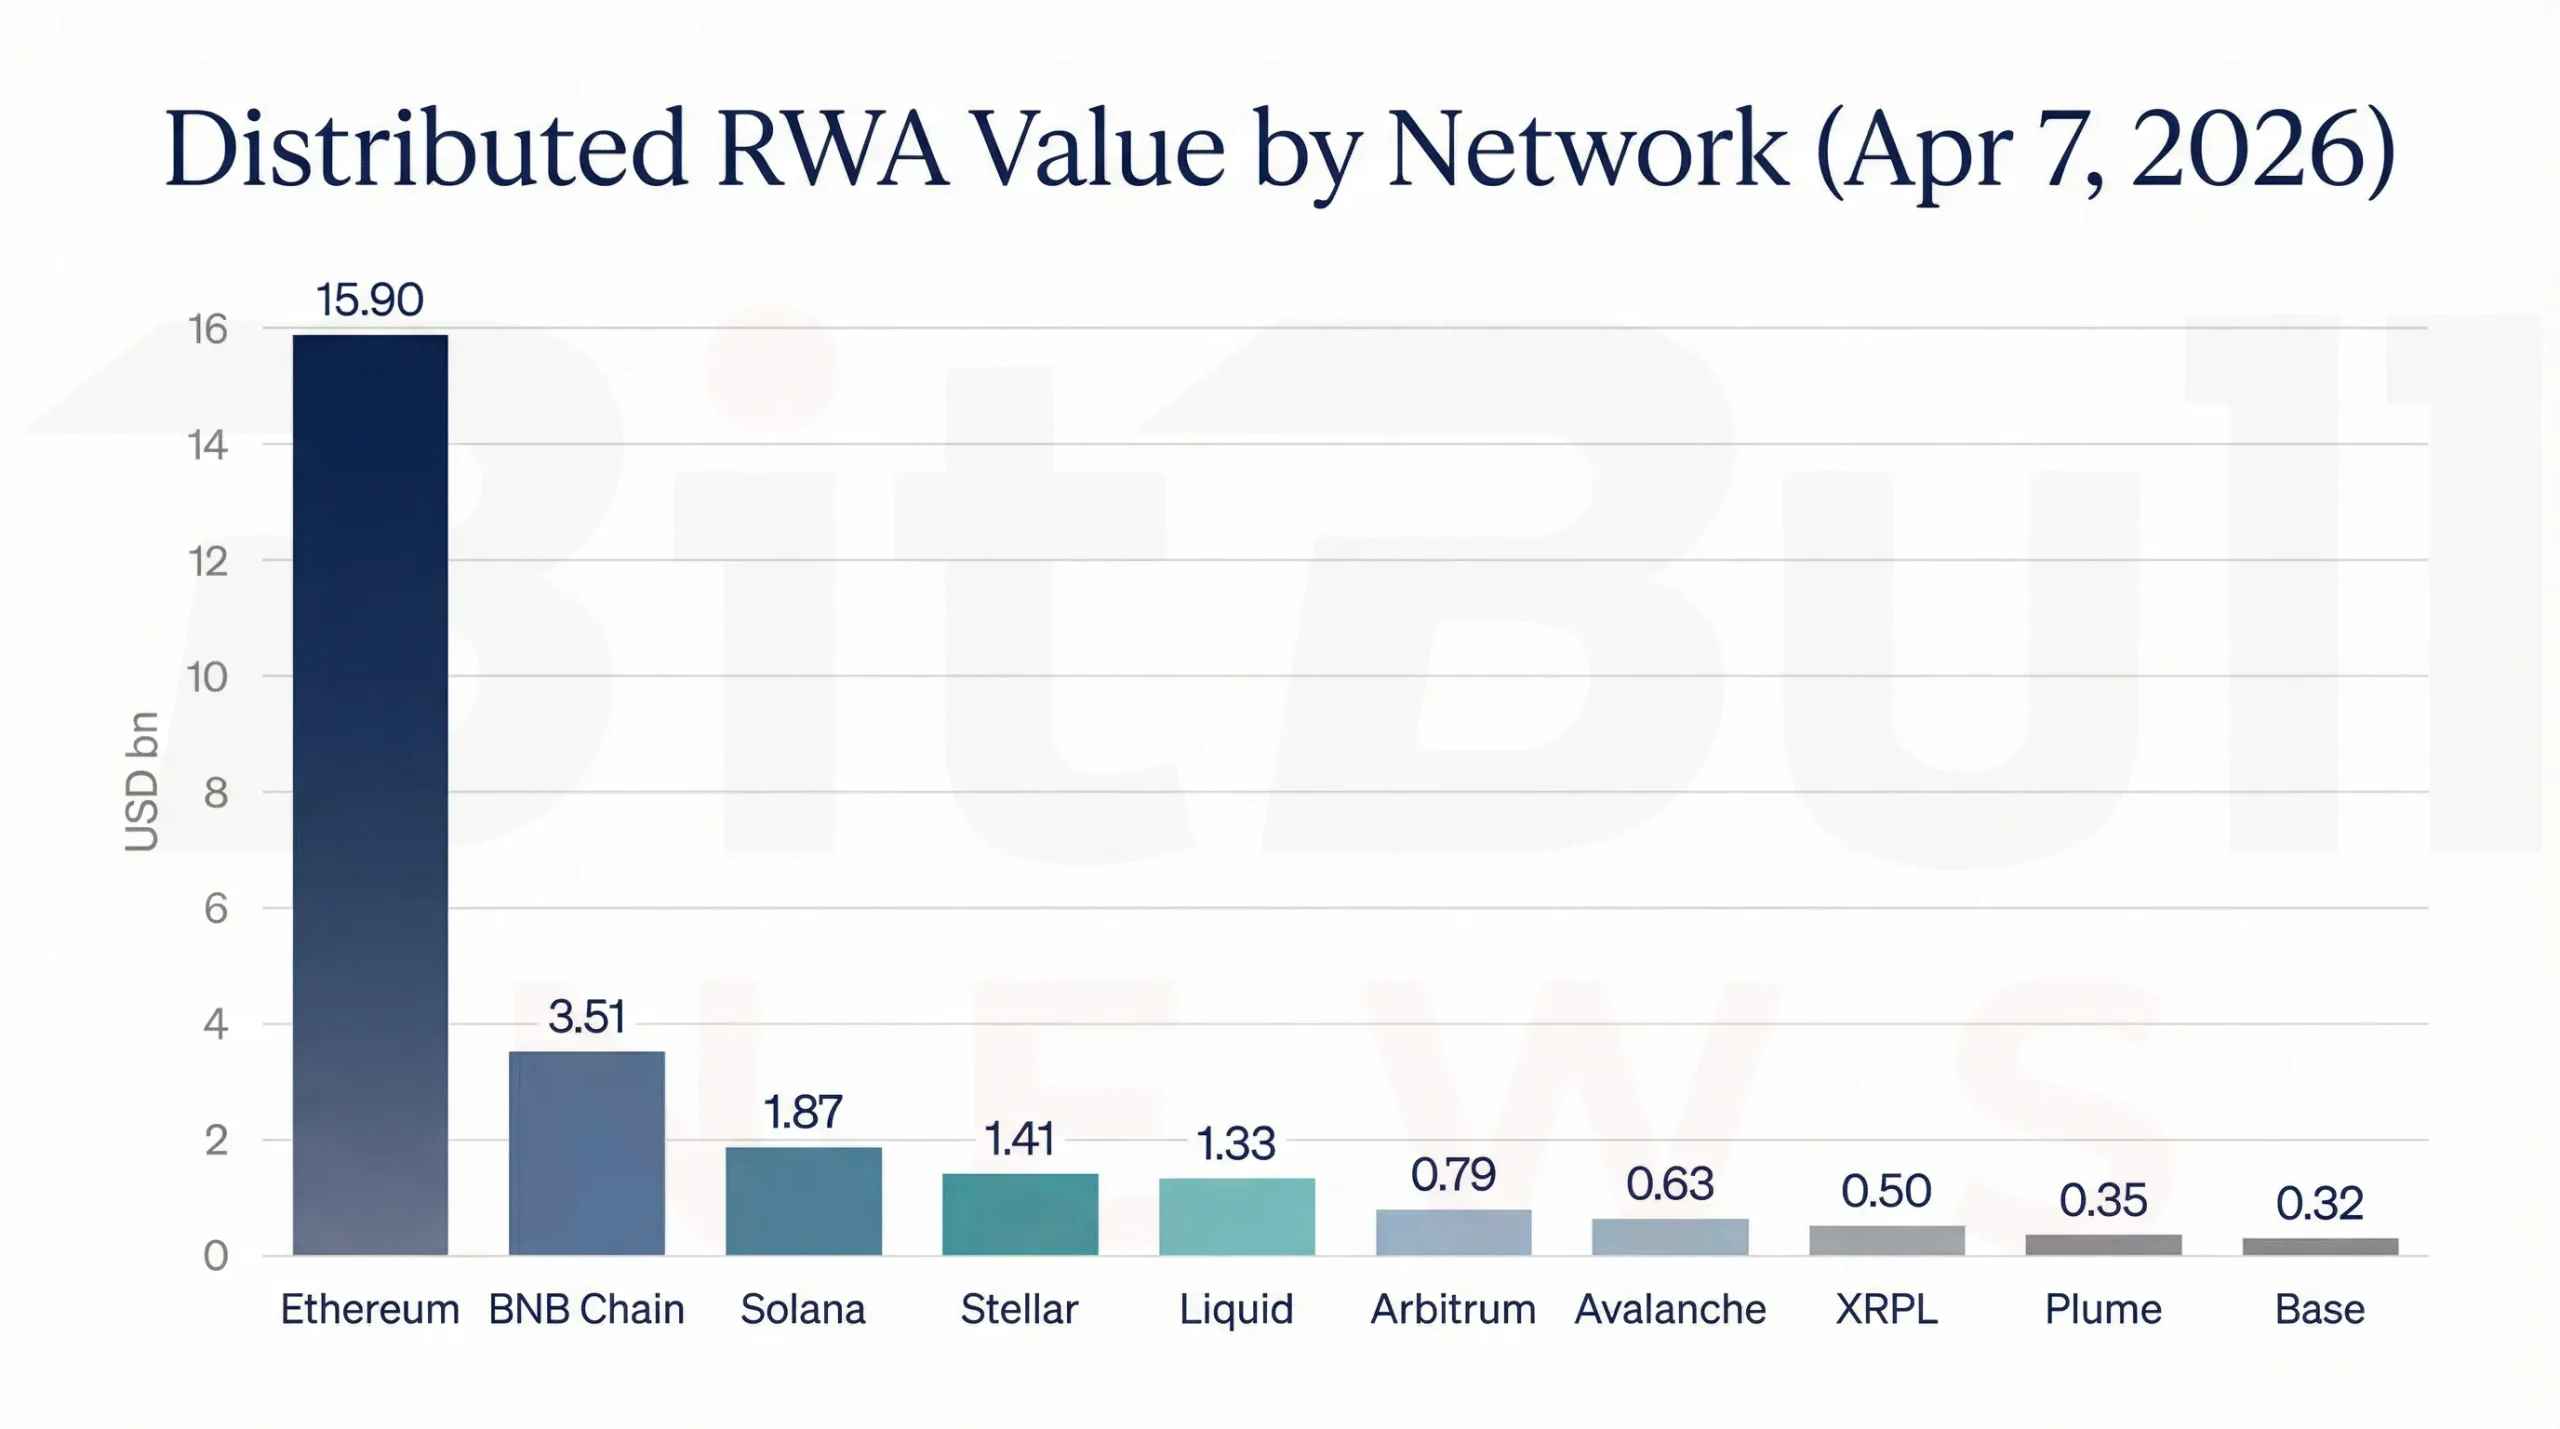
Chart 4. Maple led the category by a wide margin and was also the clearest 30-day share gainer inside distributed tokenized credit.
Tokenized Equities and Fund Wrappers
Tokenized equities grew in value, but not in participation quality.
The report’s tokenized-stocks dashboard shows:
- Total value: $1.08B, +12.56%
- Holders: 190.61K, +10.01%
- Monthly transfer volume: $2.30B, -5.02%
- Monthly active addresses: 45,721, -45.07%.
That is a very specific market pattern: value up, holders up, activity down. It implies that the category grew through issuance, accumulation, and a smaller set of repeat users rather than through widening day-to-day participation. That is not necessarily bearish, but it does mean tokenized equities still have not proven that broader usage is expanding as fast as their market value.
Table 4. Tokenized equities platform shares
| Platform | Value | Share | 30D change |
|---|---|---|---|
| Ondo | $652.70M | 60.49% | +14.64% |
| xStocks | $256.33M | 23.75% | +16.81% |
| Securitize | $165.99M | 15.38% | -0.02% |
The competitive structure is clearer than the participation trend. Ondo remains dominant and still grew. xStocks was the faster-growing number two. Securitize held roughly flat. That means the category is not being blown open by a wave of new competitors. It is still growing through a small number of platforms with established distribution and product credibility.
The report also includes a useful example of what “marketing without liquidity” looks like: Robinhood Ouster (OUSTrh) at about $9,145, with 1 holder and $0 monthly transfer volume. That kind of token may be interesting as a proof of concept, but it does not matter at market-structure scale.
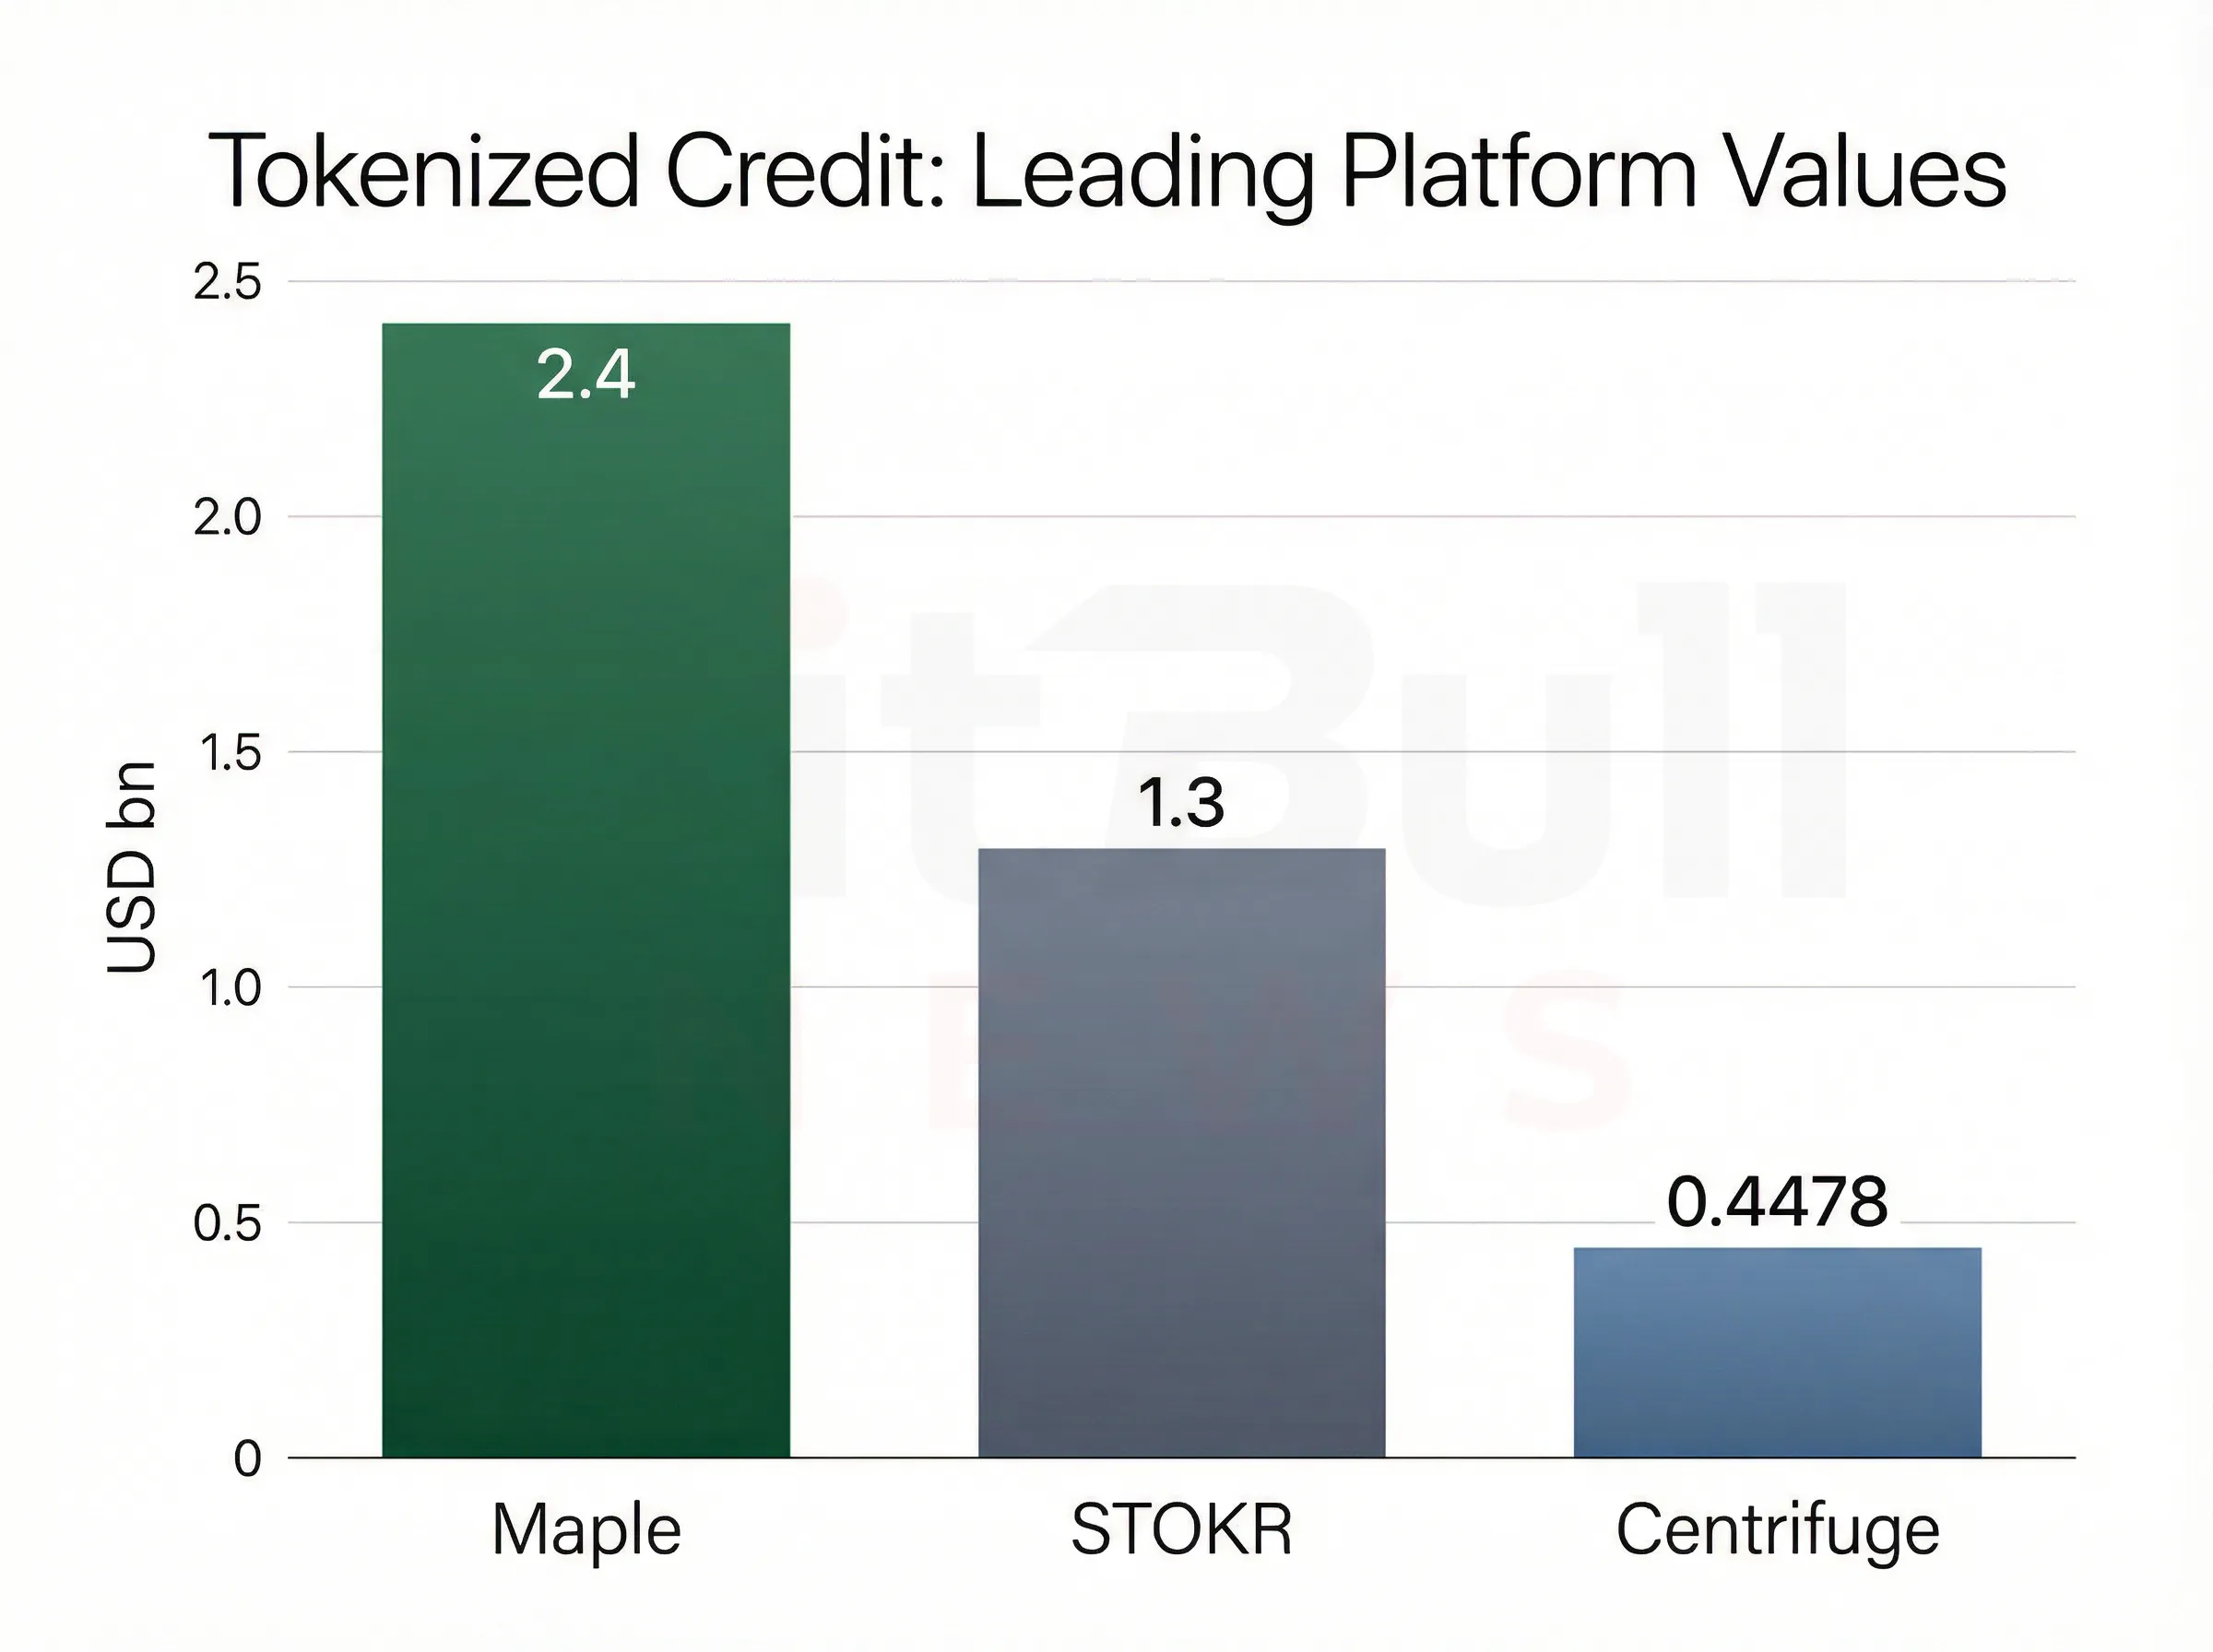
Chart 5. Tokenized equities grew in market value and holder count over 30 days, but active addresses and transfer volume moved the other way.
Networks, Platforms, and the Liquidity Reality Check
The network rankings remain highly concentrated.
Table 5. Distributed RWA value by network
| Network | Distributed RWA value | Share |
|---|---|---|
| Ethereum | $15.90B | ~56.8% |
| BNB Chain | $3.51B | ~12.5% |
| Solana | $1.87B | ~6.7% |
| Stellar | $1.41B | ~5.0% |
| Liquid Network | $1.33B | ~4.8% |
| Arbitrum | $0.79B | ~2.8% |
| Avalanche | $0.63B | ~2.2% |
| XRP Ledger | $0.50B | ~1.8% |
| Plume | $0.35B | ~1.3% |
| Base | $0.32B | ~1.2% |
The top three networks — Ethereum, BNB Chain, and Solana — hold roughly 76% of distributed RWAs. The top five hold about 86%. That is still a concentrated market, even before you apply the second filter of actual DeFi liquidity and transfer activity.
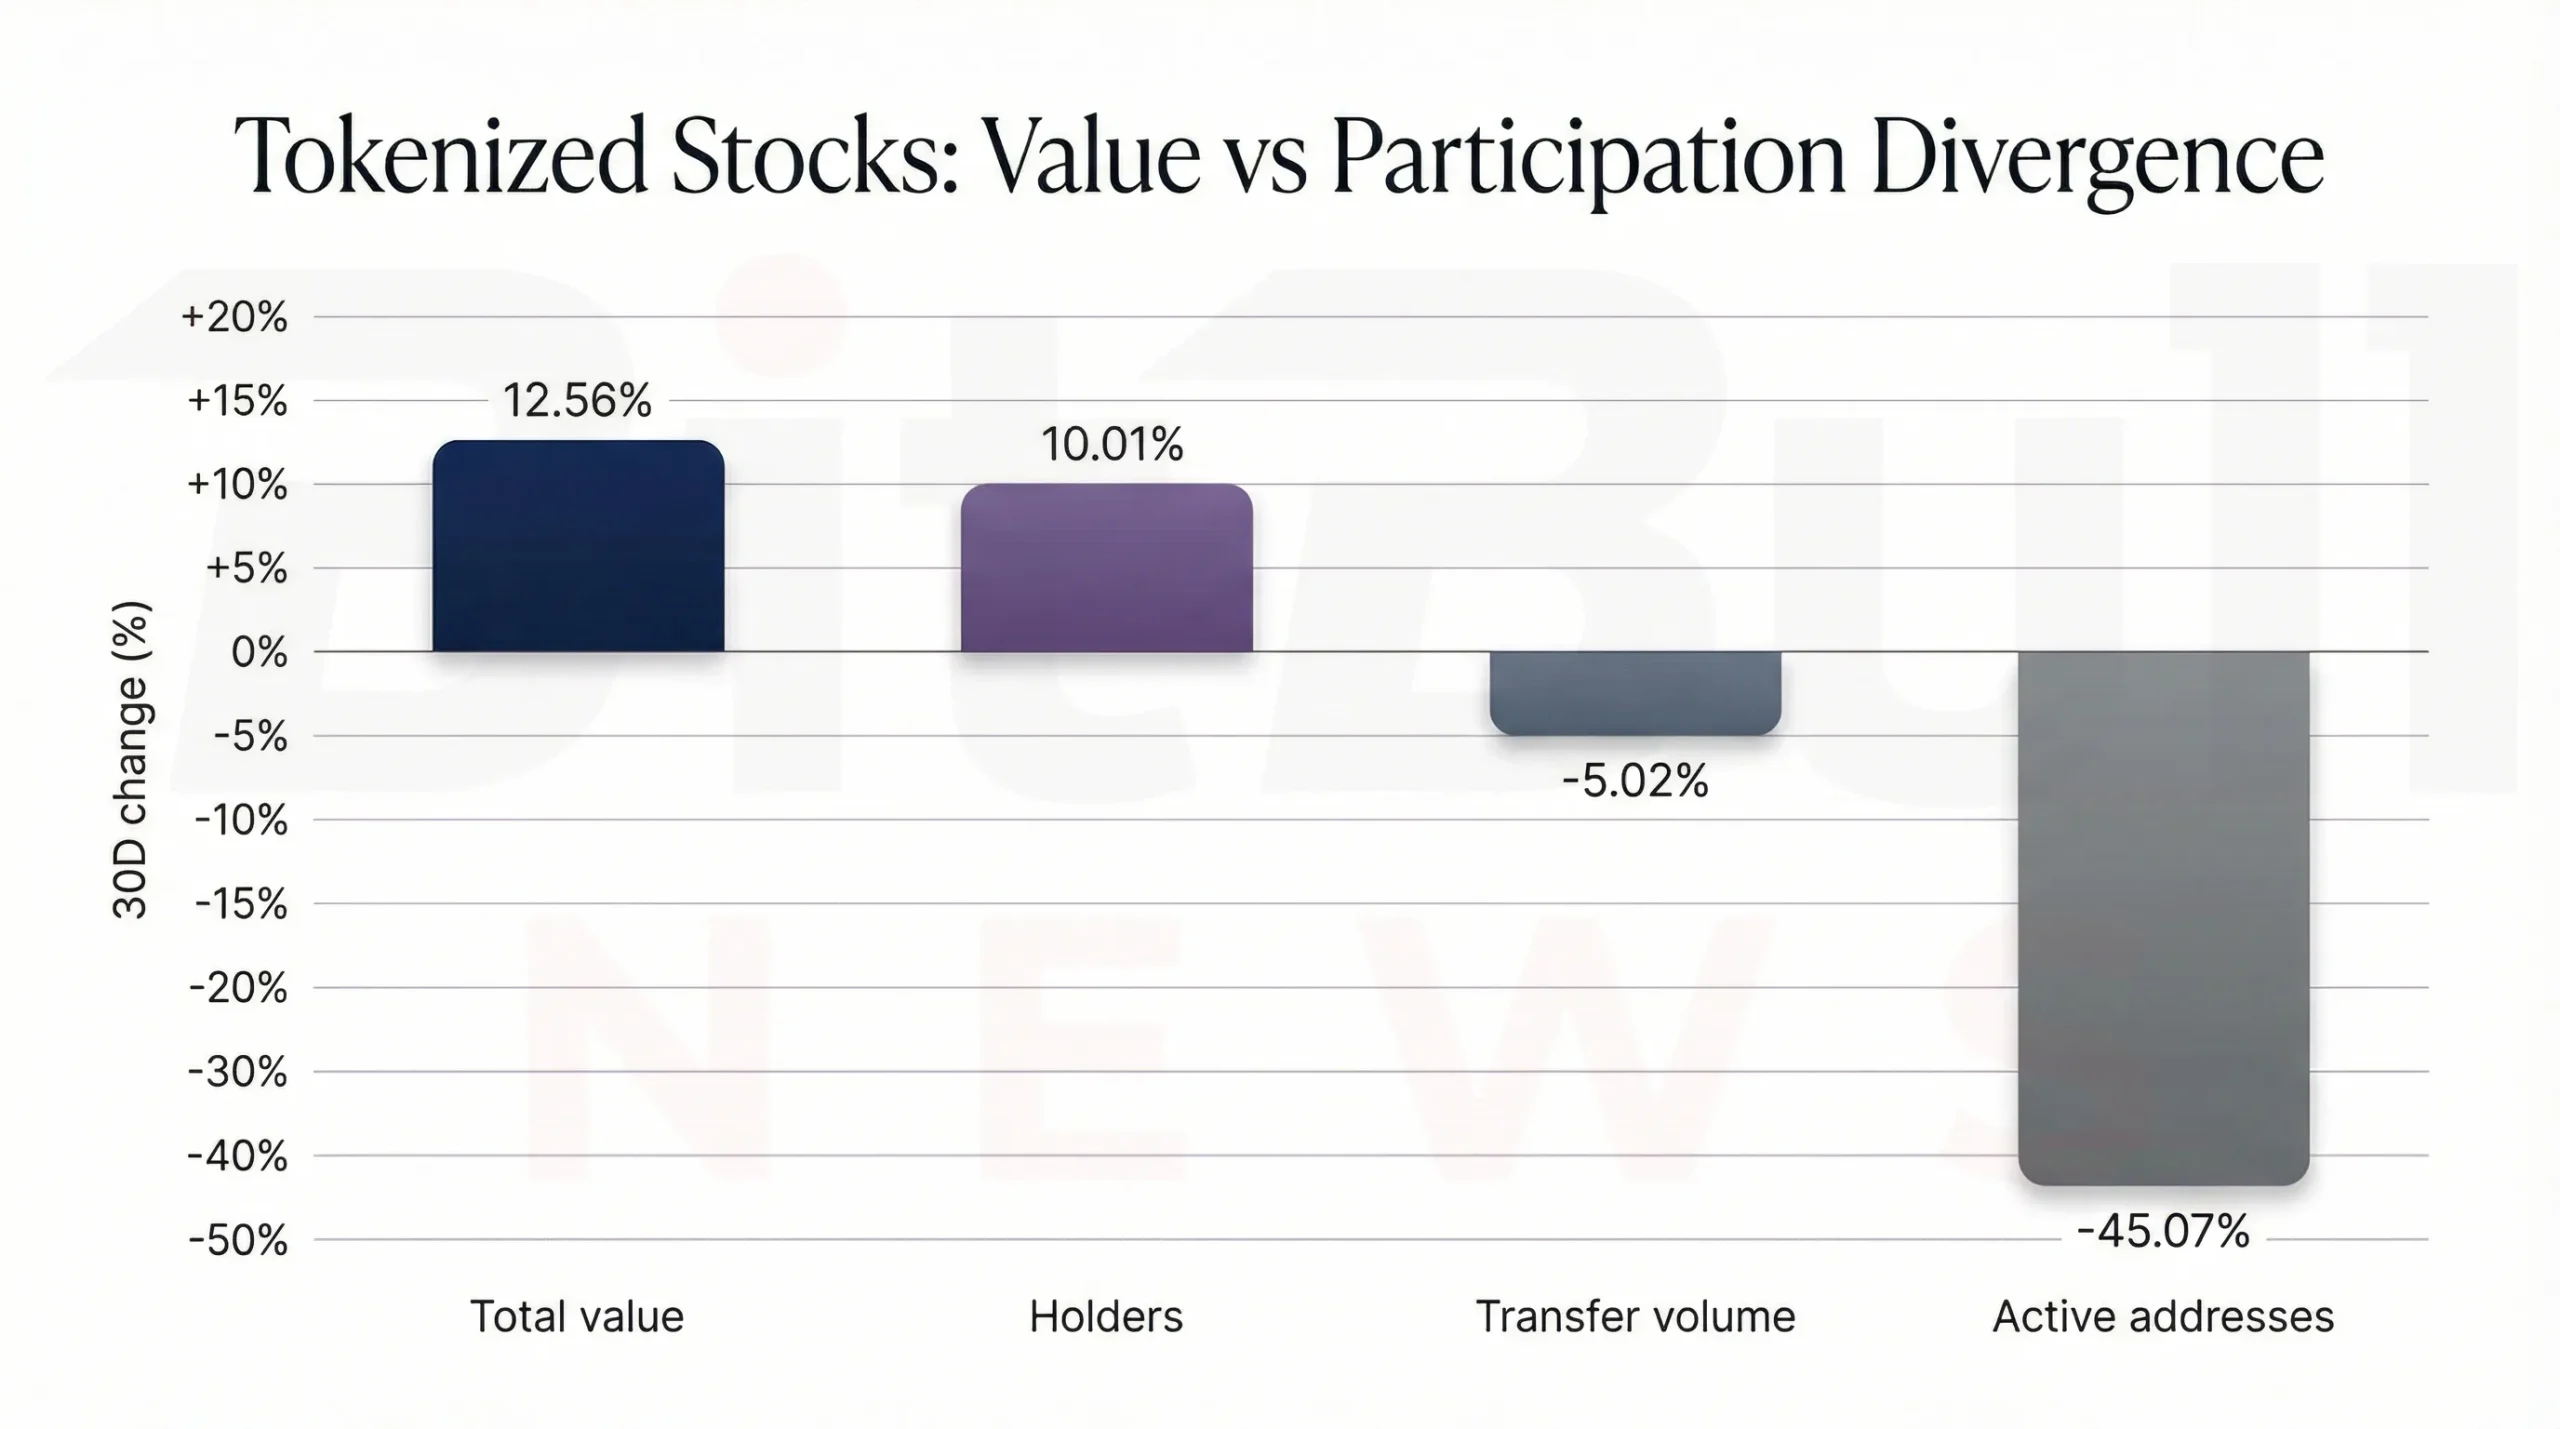
Chart 6. Distributed RWAs remain heavily concentrated, with Ethereum still the dominant gravity center for value and usage.
But the most important network insight in the report is not just who leads by value. It is who leads by observable liquidity.
The report gives a perfect example using USYC. On paper, BNB Chain holds about $2.276B of USYC supply, while Ethereum holds only about $115.7M. But all of the product’s reported $592M monthly transfer volume sits on Ethereum, while the BNB-side balance showed zero monthly transfer volume and zero monthly transfers in the cited view. That is the clearest possible reminder that supply can move to cheaper rails while transactional gravity stays on Ethereum, where the deepest DeFi and institutional counterparties still live.
DeFi-Active Filter: How Much of RWA Is Actually Composable?
This is the section that matters most for serious market interpretation.
DefiLlama’s RWA dashboard shows about $15.2B in on-chain RWA market cap and only $1.108B in DeFi Active TVL. That implies that only single-digit percentages of tracked RWA value are actively being used in DeFi at any one time. Ethereum alone currently accounts for roughly $832.96M of that DeFi-active total, which means composable RWA liquidity remains heavily concentrated in one ecosystem even as token supply spreads across multiple chains.
This is the most important reality check in the whole report. Tokenization is not fake. It is growing. But issued supply, represented value, and usable DeFi liquidity are still very different things. The market keeps compressing them into one number. It should not.
Why This Looks Like a 2026 Institutional Theme
The report closes with a useful macro frame. It notes that:
- BlackRock publicly named crypto and tokenization as themes driving markets in 2026,
- the World Economic Forum highlighted digital assets and tokenized assets as part of a potential 2026 inflection point,
- and the IMF emphasized that tokenized finance changes settlement and liquidity dynamics but still depends on policy, legal, and settlement anchors.
That matters because it explains why the category is not disappearing even when liquidity remains narrower than the marketing suggests. Institutions are still moving in, but they are moving in through the segments that fit their workflows: Treasury funds, structured wrappers, private credit platforms, and high-control distribution layers. The market’s next phase depends less on issuing more tokens and more on proving that those tokens can become meaningfully usable without breaking legal, settlement, and compliance requirements.
BitBullNews View
The market did not become broader over this window. It became clearer.
Tokenized Treasuries remained the strongest growth engine and did so through a handful of identifiable winners. Credit consolidated around Maple while more distributed competitors shrank. Tokenized equities continued to grow in value, but not in broad participation. Network concentration remained high, and the gap between headline AUM and real DeFi-active liquidity remained one of the defining structural features of the sector.
That means the right read is not “RWAs are stalling,” and not “tokenization has already arrived everywhere.” The right read is this: RWA growth is real, but it is still mostly happening in products that solve institutional cash, fund, and credit workflows before they solve open-market liquidity.
Key Findings
- Distributed RWA value rose to $27.98B, while represented value fell to $142.26B, a move the report itself says likely reflects classification effects as much as capital movement.
- Tokenized Treasuries remained the strongest segment, with USYC, JTRSY, USDY, and USTB posting the largest estimated 30-day AUM gains.
- BENJI remained large in AUM but showed very low on-chain transfer intensity, reinforcing the difference between presence and liquidity.
- In credit, Maple gained share decisively while STOKR and Centrifuge shrank.
- Tokenized equities grew in value and holders, but monthly active addresses fell 45.07%, signaling weaker participation breadth.
- Distributed RWAs remain heavily concentrated on Ethereum, BNB Chain, and Solana, with Ethereum still dominating usable liquidity.
- DefiLlama’s RWA dashboard still shows only a small single-digit share of tracked RWA value actively used in DeFi.
Final Verdict
Research verdict: Growth continued, but liquidity stayed selective
The March 12 to April 7 window did not weaken the long-term RWA thesis. It strengthened the case that the winning part of the market is still the part closest to institutional-grade cash management, Treasury exposure, and controlled credit distribution. What the window did not show was broad secondary liquidity expansion across all tokenized assets.
The clearest conclusion is this:
The RWA market is growing, but it is still scaling through concentrated products, concentrated platforms, and concentrated liquidity rather than through fully generalized on-chain capital markets.