



Content
Institutional crypto flows reversed decisively this week.
The U.S. Bitcoin, Ether and Solana products covered by Farside Investors recorded $717.5 million of combined net inflows across the five completed trading sessions from July 30 through August 5. Bitcoin funds attracted $593.7 million. Ether products added $123.8 million. Farside’s tracked Solana funds reported no net creations or redemptions.
The August 6 U.S. session had not produced a completed flow print at the BitBullNews reporting cutoff. It is not included in the totals.
The reversal was large.
During the previous five completed sessions, from July 23 through July 29, the same tracked product groups lost $567.7 million. The move from a $567.7 million outflow to a $717.5 million inflow created a five-session swing of approximately $1.29 billion.
The recovery was also highly concentrated.
BlackRock’s IBIT attracted $539.2 million, equal to 90.8% of tracked Bitcoin inflows. ETHA added $100 million, while the smaller staked ETHB product gained $26.1 million. Together, the three BlackRock products generated $665.3 million — 92.7% of all tracked Bitcoin and Ether inflows.
Price action did not fully confirm the allocation signal.
Bitcoin closed July 30 at $64,725.31 and August 5 at $64,597.50, a decline of approximately 0.20%. Ether fell about 0.57%, from $1,917.37 to $1,906.53. The products absorbed substantial new capital without producing a clean underlying-asset breakout.
That divergence is the central market-structure signal this week.
ETF demand returned. Price remained range-bound. BlackRock captured most of the allocation, while product competition outside the market leader remained uneven.
Data Scope And Cutoff
Flow data comes from Farside Investors and covers:
- Twelve listed U.S. Bitcoin products.
- Ten listed U.S. Ether products.
- Six listed U.S. Solana products.
Farside’s tables had not added Morgan Stanley’s new MSSE and MSOL products by the August 6 reporting cutoff. The Ether and Solana totals therefore do not cover every product currently trading in the United States.
Morgan Stanley launched MSSE and MSOL on July 28. Both charge 0.14% and intend to stake part of their holdings without Morgan Stanley retaining a percentage of the resulting staking rewards. Morgan Stanley reported $21.18 million of net assets for MSSE as of August 4. A comparable current MSOL asset figure was not available in the primary sources reviewed for this report.
Flow totals measure primary-market creations and redemptions. They do not equal exchange trading volume, fund performance or changes in assets caused by movements in the underlying crypto price.
Weekly ETF Flow Scorecard
| Metric | Bitcoin Funds | Ether Funds | Solana Funds | Combined |
|---|---|---|---|---|
| Tracked Net Flow, July 30–August 5 | +$593.7M | +$123.8M | $0.0M | +$717.5M |
| Previous Five Sessions, July 23–29 | -$494.4M | -$56.2M | -$17.1M | -$567.7M |
| Five-Session Swing | +$1.088B | +$180.0M | +$17.1M | +$1.285B |
| Positive Sessions | 4 Of 5 | 4 Of 5 | 0 Of 5 | 4 Net-Positive Days |
| Largest Daily Inflow | +$244.4M | +$60.8M | $0.0M | +$305.2M |
| Largest Daily Outflow | -$265.4M | -$11.9M | $0.0M | -$256.4M |
| Average Daily Flow | +$118.7M | +$24.8M | $0.0M | +$143.5M |
| Cumulative Net Inflow In Farside Dataset | $52.00B | $11.32B | $1.12B | $64.45B |
| Current Flow As Share Of Cumulative Net Inflow | +1.14% | +1.09% | 0.00% | +1.11% |
The Solana dataset does not include Morgan Stanley’s MSOL. The Ether dataset does not include MSSE.
Bitcoin produced 82.7% of the tracked inflow. Ether supplied the remaining 17.3%.
The relative flow intensity was almost identical. Bitcoin’s $593.7 million represented approximately 1.14% of its cumulative net inflow base. Ether’s $123.8 million represented about 1.09%.
This was not only a Bitcoin allocation cycle. Both mature product categories attracted capital at a similar rate relative to their historical inflows.
Three Positive Sessions Repaired The July 31 Outflow
The period began with a $245.9 million combined inflow on July 30.
That demand disappeared one session later. Bitcoin products lost $265.4 million on July 31, producing a $256.4 million combined outflow even as Ether funds remained slightly positive.
The market then recorded three consecutive positive sessions:
- August 3: +$158.2 million.
- August 4: +$264.6 million.
- August 5: +$305.2 million.
Those three sessions generated $728 million of combined inflows, more than the full five-session result because they also offset the July 31 reversal.
Daily Tracked Crypto ETP Flows
| Trading Date | Bitcoin Funds | Ether Funds | Solana Funds | Combined Flow |
|---|---|---|---|---|
| July 30 | +$233.1M | +$12.8M | $0.0M | +$245.9M |
| July 31 | -$265.4M | +$9.0M | $0.0M | -$256.4M |
| August 3 | +$170.1M | -$11.9M | $0.0M | +$158.2M |
| August 4 | +$211.5M | +$53.1M | $0.0M | +$264.6M |
| August 5 | +$244.4M | +$60.8M | $0.0M | +$305.2M |
| Period Total | +$593.7M | +$123.8M | $0.0M | +$717.5M |
Figures cover the products listed in Farside’s respective tables.
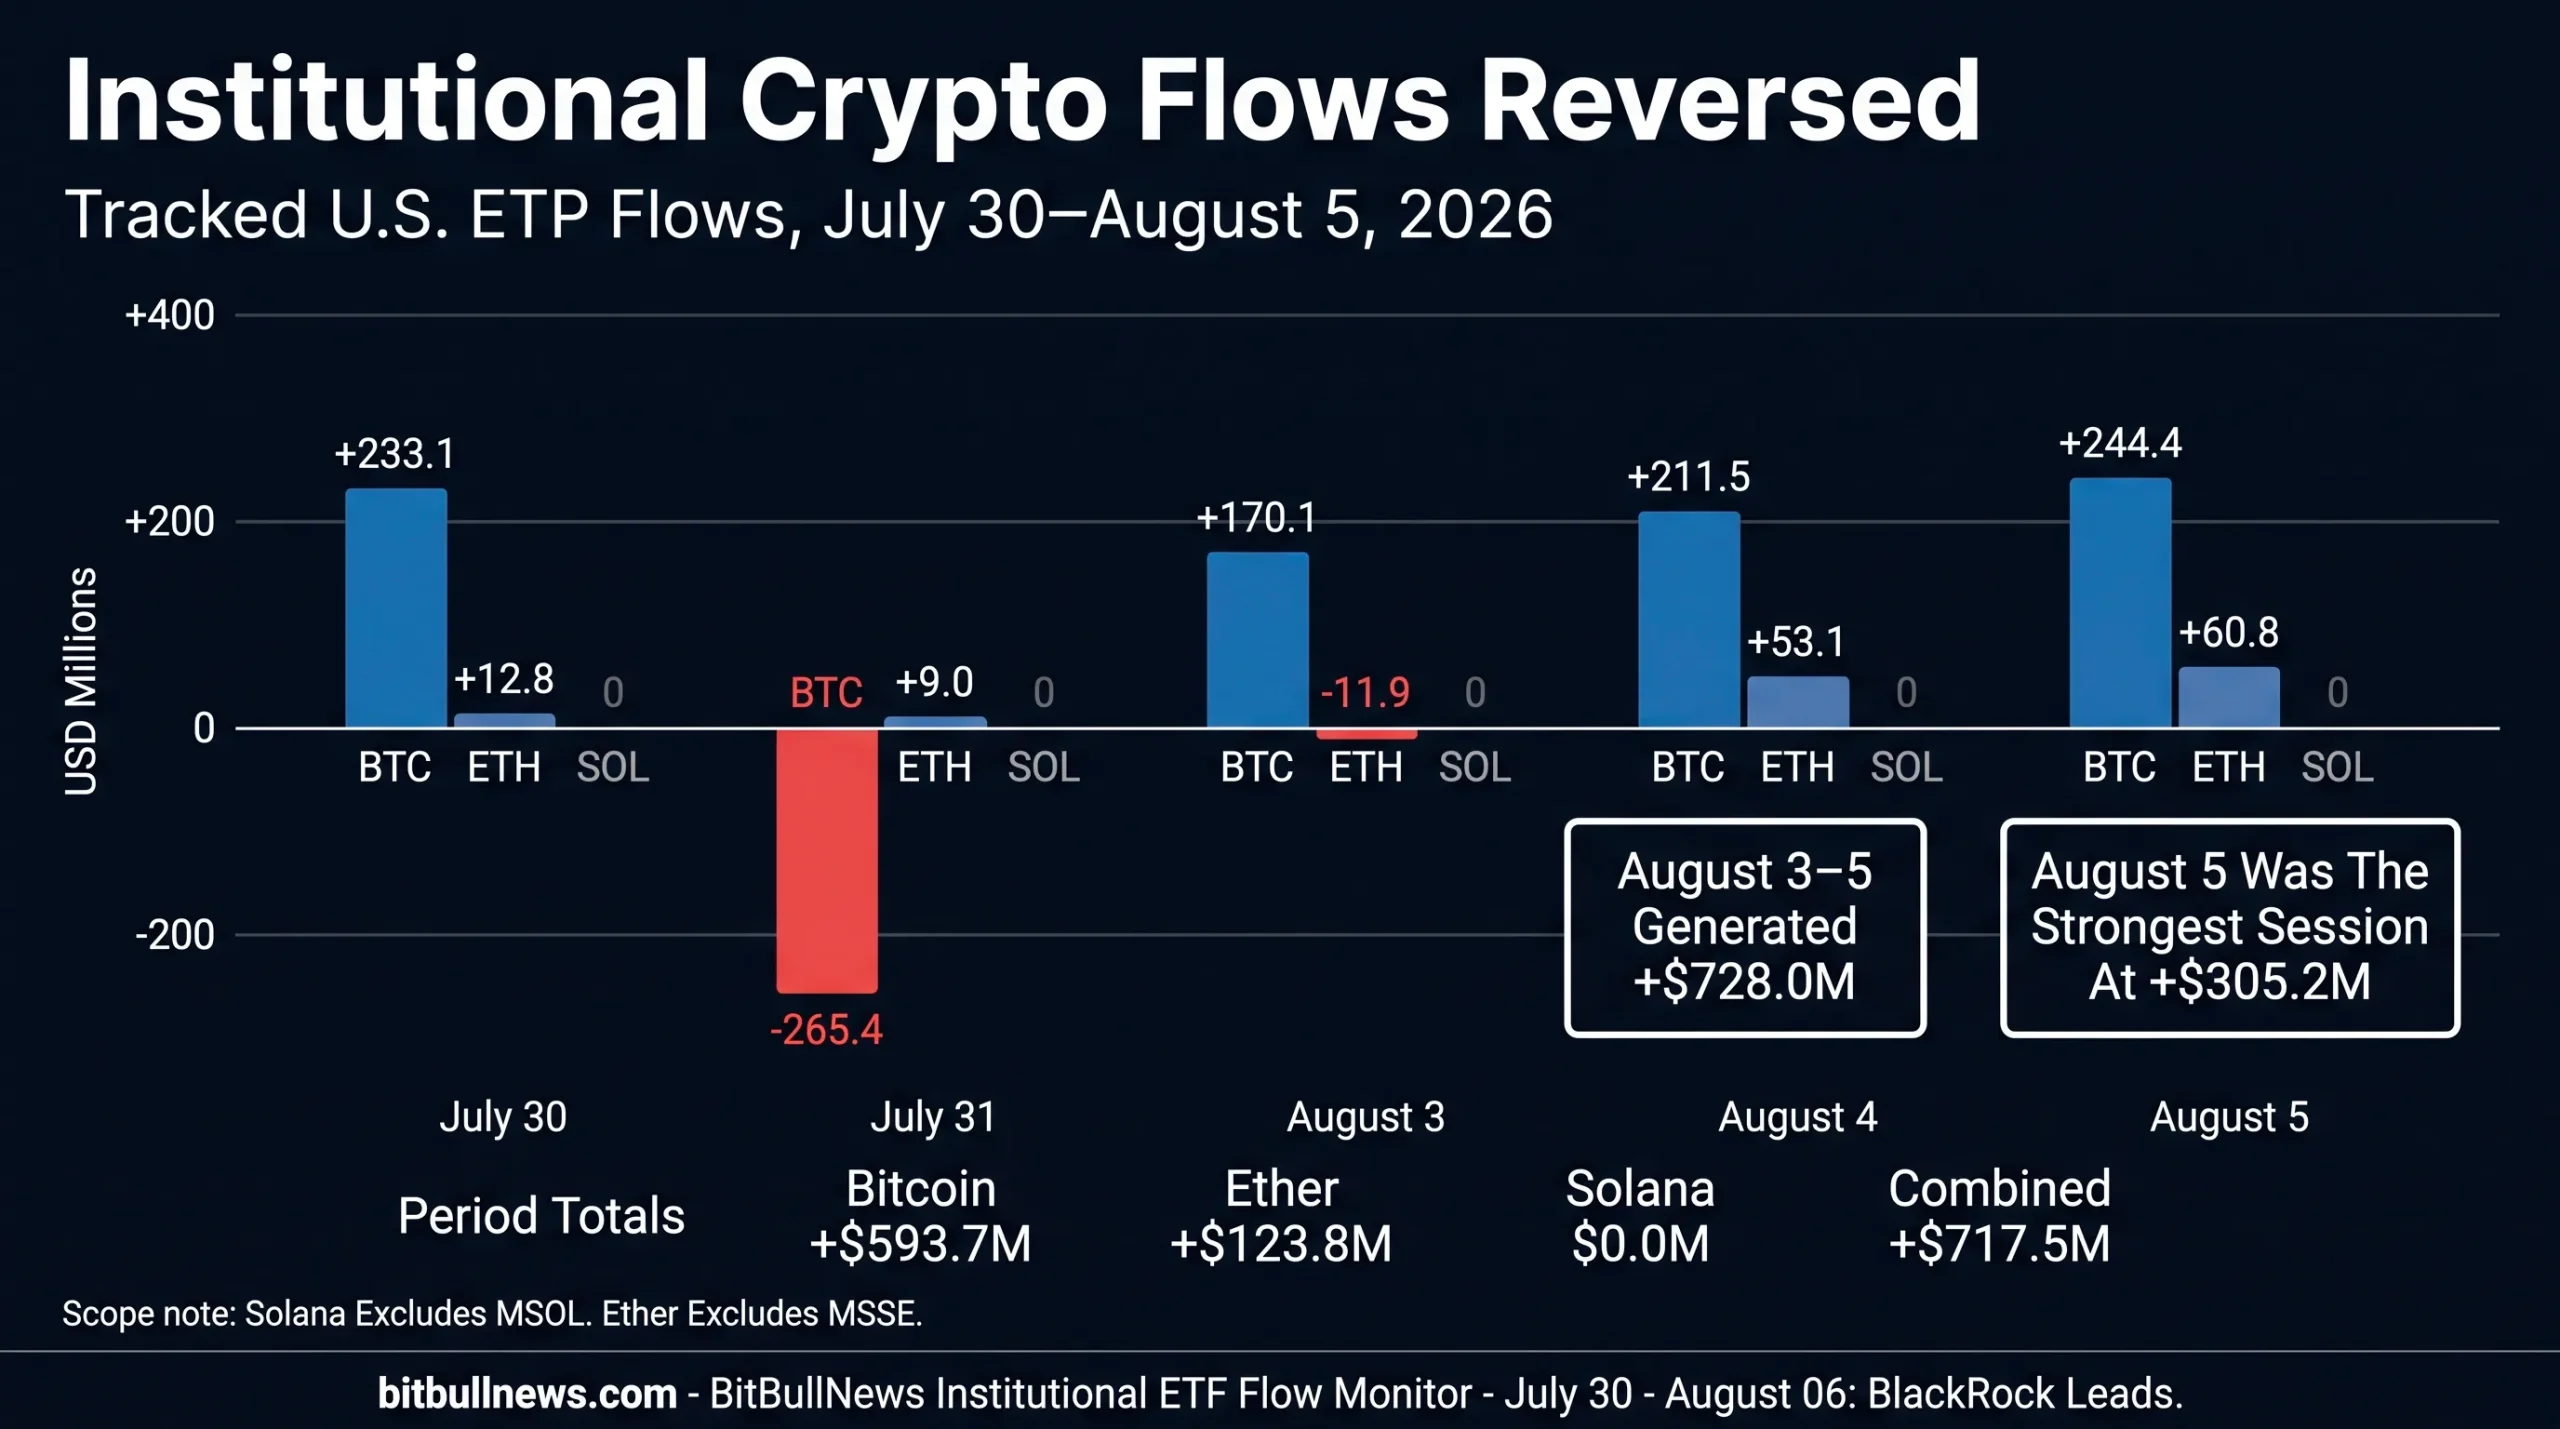
The sequence looks more constructive than one large launch-day or month-end allocation.
July 30 may have contained month-end positioning. The continued creations on August 3, 4 and 5 show that demand survived into the new month.
The strongest session was August 5, when Bitcoin funds attracted $244.4 million and Ether funds added $60.8 million. IBIT and ETHA generated most of that day’s demand.
The Five-Session Reversal Reached $1.29 Billion
The previous comparable block of five completed sessions was heavily negative.
From July 23 through July 29:
- Bitcoin funds lost $494.4 million.
- Ether funds lost $56.2 million.
- Tracked Solana funds lost $17.1 million.
- Combined redemptions reached $567.7 million.
The current period reversed all three category results.
Five-Session Flow Reversal
| Five-Session Period | Bitcoin Funds | Ether Funds | Solana Funds | Combined |
|---|---|---|---|---|
| July 23–29 | -$494.4M | -$56.2M | -$17.1M | -$567.7M |
| July 30–August 5 | +$593.7M | +$123.8M | $0.0M | +$717.5M |
| Flow Swing | +$1.088B | +$180.0M | +$17.1M | +$1.285B |
The comparison avoids overlapping July 30 between monitoring periods.
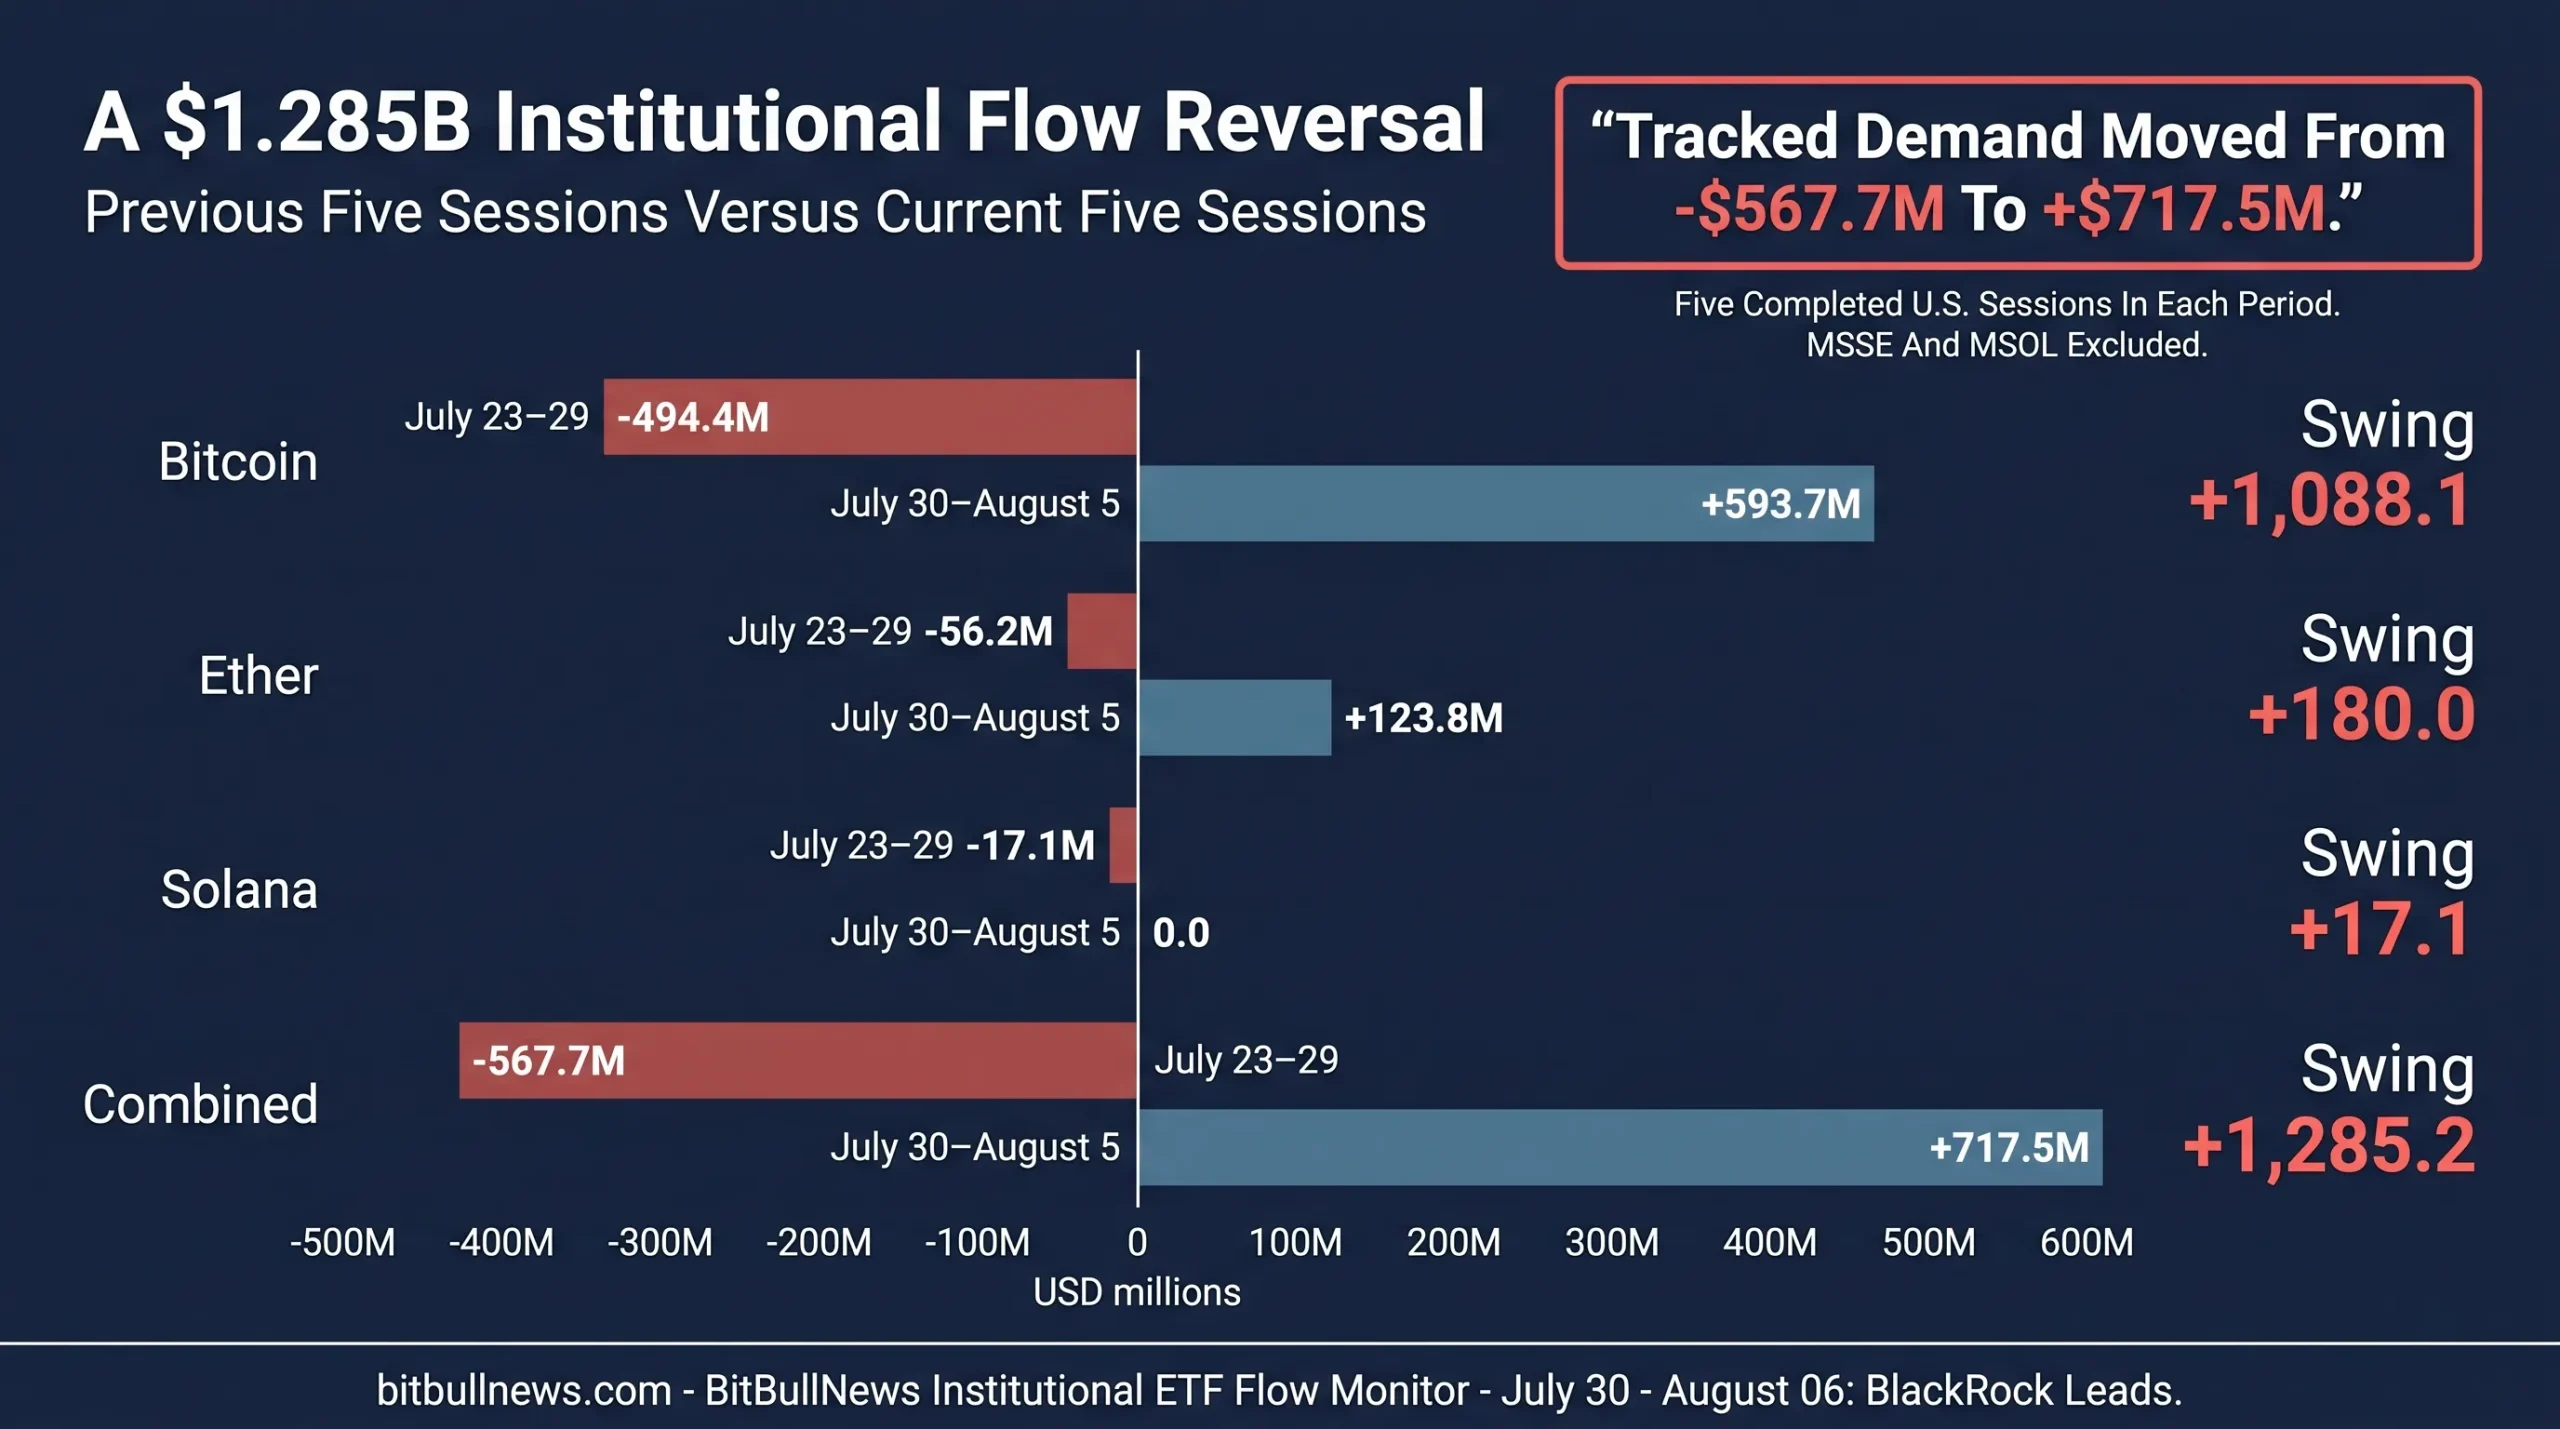
The reversal confirms that ETF demand remains tactical.
Institutions can move hundreds of millions of dollars into or out of crypto exposure within a few sessions. A strong inflow week does not invalidate the previous redemptions. It shows that the regulated wrappers are being used actively for allocation, hedging and portfolio adjustment.
BlackRock Controlled The Bitcoin Rebound
IBIT attracted $539.2 million during the period.
That was 90.8% of the entire Bitcoin category’s net inflow. The product finished positive on four of five sessions and generated $478.5 million across August 3–5 alone.
IBIT’s scale makes that concentration possible.
BlackRock reported $48.07 billion of net assets as of August 5, a 30-day average trading volume of 36.65 million shares and a median bid-ask spread of 0.03%. Those characteristics make IBIT the most scalable execution route in the category for large allocations.
The weekly inflow equalled approximately 1.12% of IBIT’s latest net assets.
That is meaningful, but not evidence that the fund’s entire asset base is turning over. Most assets remained in place while primary-market creations added incremental exposure.
Bitcoin Fund Flows By Product
| Bitcoin Product | Issuer | Net Flow, July 30–August 5 | Share Of Category Flow |
|---|---|---|---|
| IBIT | BlackRock | +$539.2M | 90.8% |
| ARKB | 21Shares | +$32.9M | 5.5% |
| FBTC | Fidelity | +$25.0M | 4.2% |
| BITB | Bitwise | +$25.0M | 4.2% |
| MSBT | Morgan Stanley | +$13.9M | 2.3% |
| EZBC | Franklin Templeton | +$9.2M | 1.5% |
| BTCO | Invesco | +$6.7M | 1.1% |
| BTC | Grayscale Bitcoin Mini Trust | +$2.3M | 0.4% |
| BRRR | Valkyrie | $0.0M | 0.0% |
| BTCW | WisdomTree | $0.0M | 0.0% |
| HODL | VanEck | -$7.9M | -1.3% |
| GBTC | Grayscale | -$52.6M | -8.9% |
| Total | — | +$593.7M | 100.0% |
Percentage contributions can exceed 100% in aggregate on the positive side because negative products reduced the final category total.
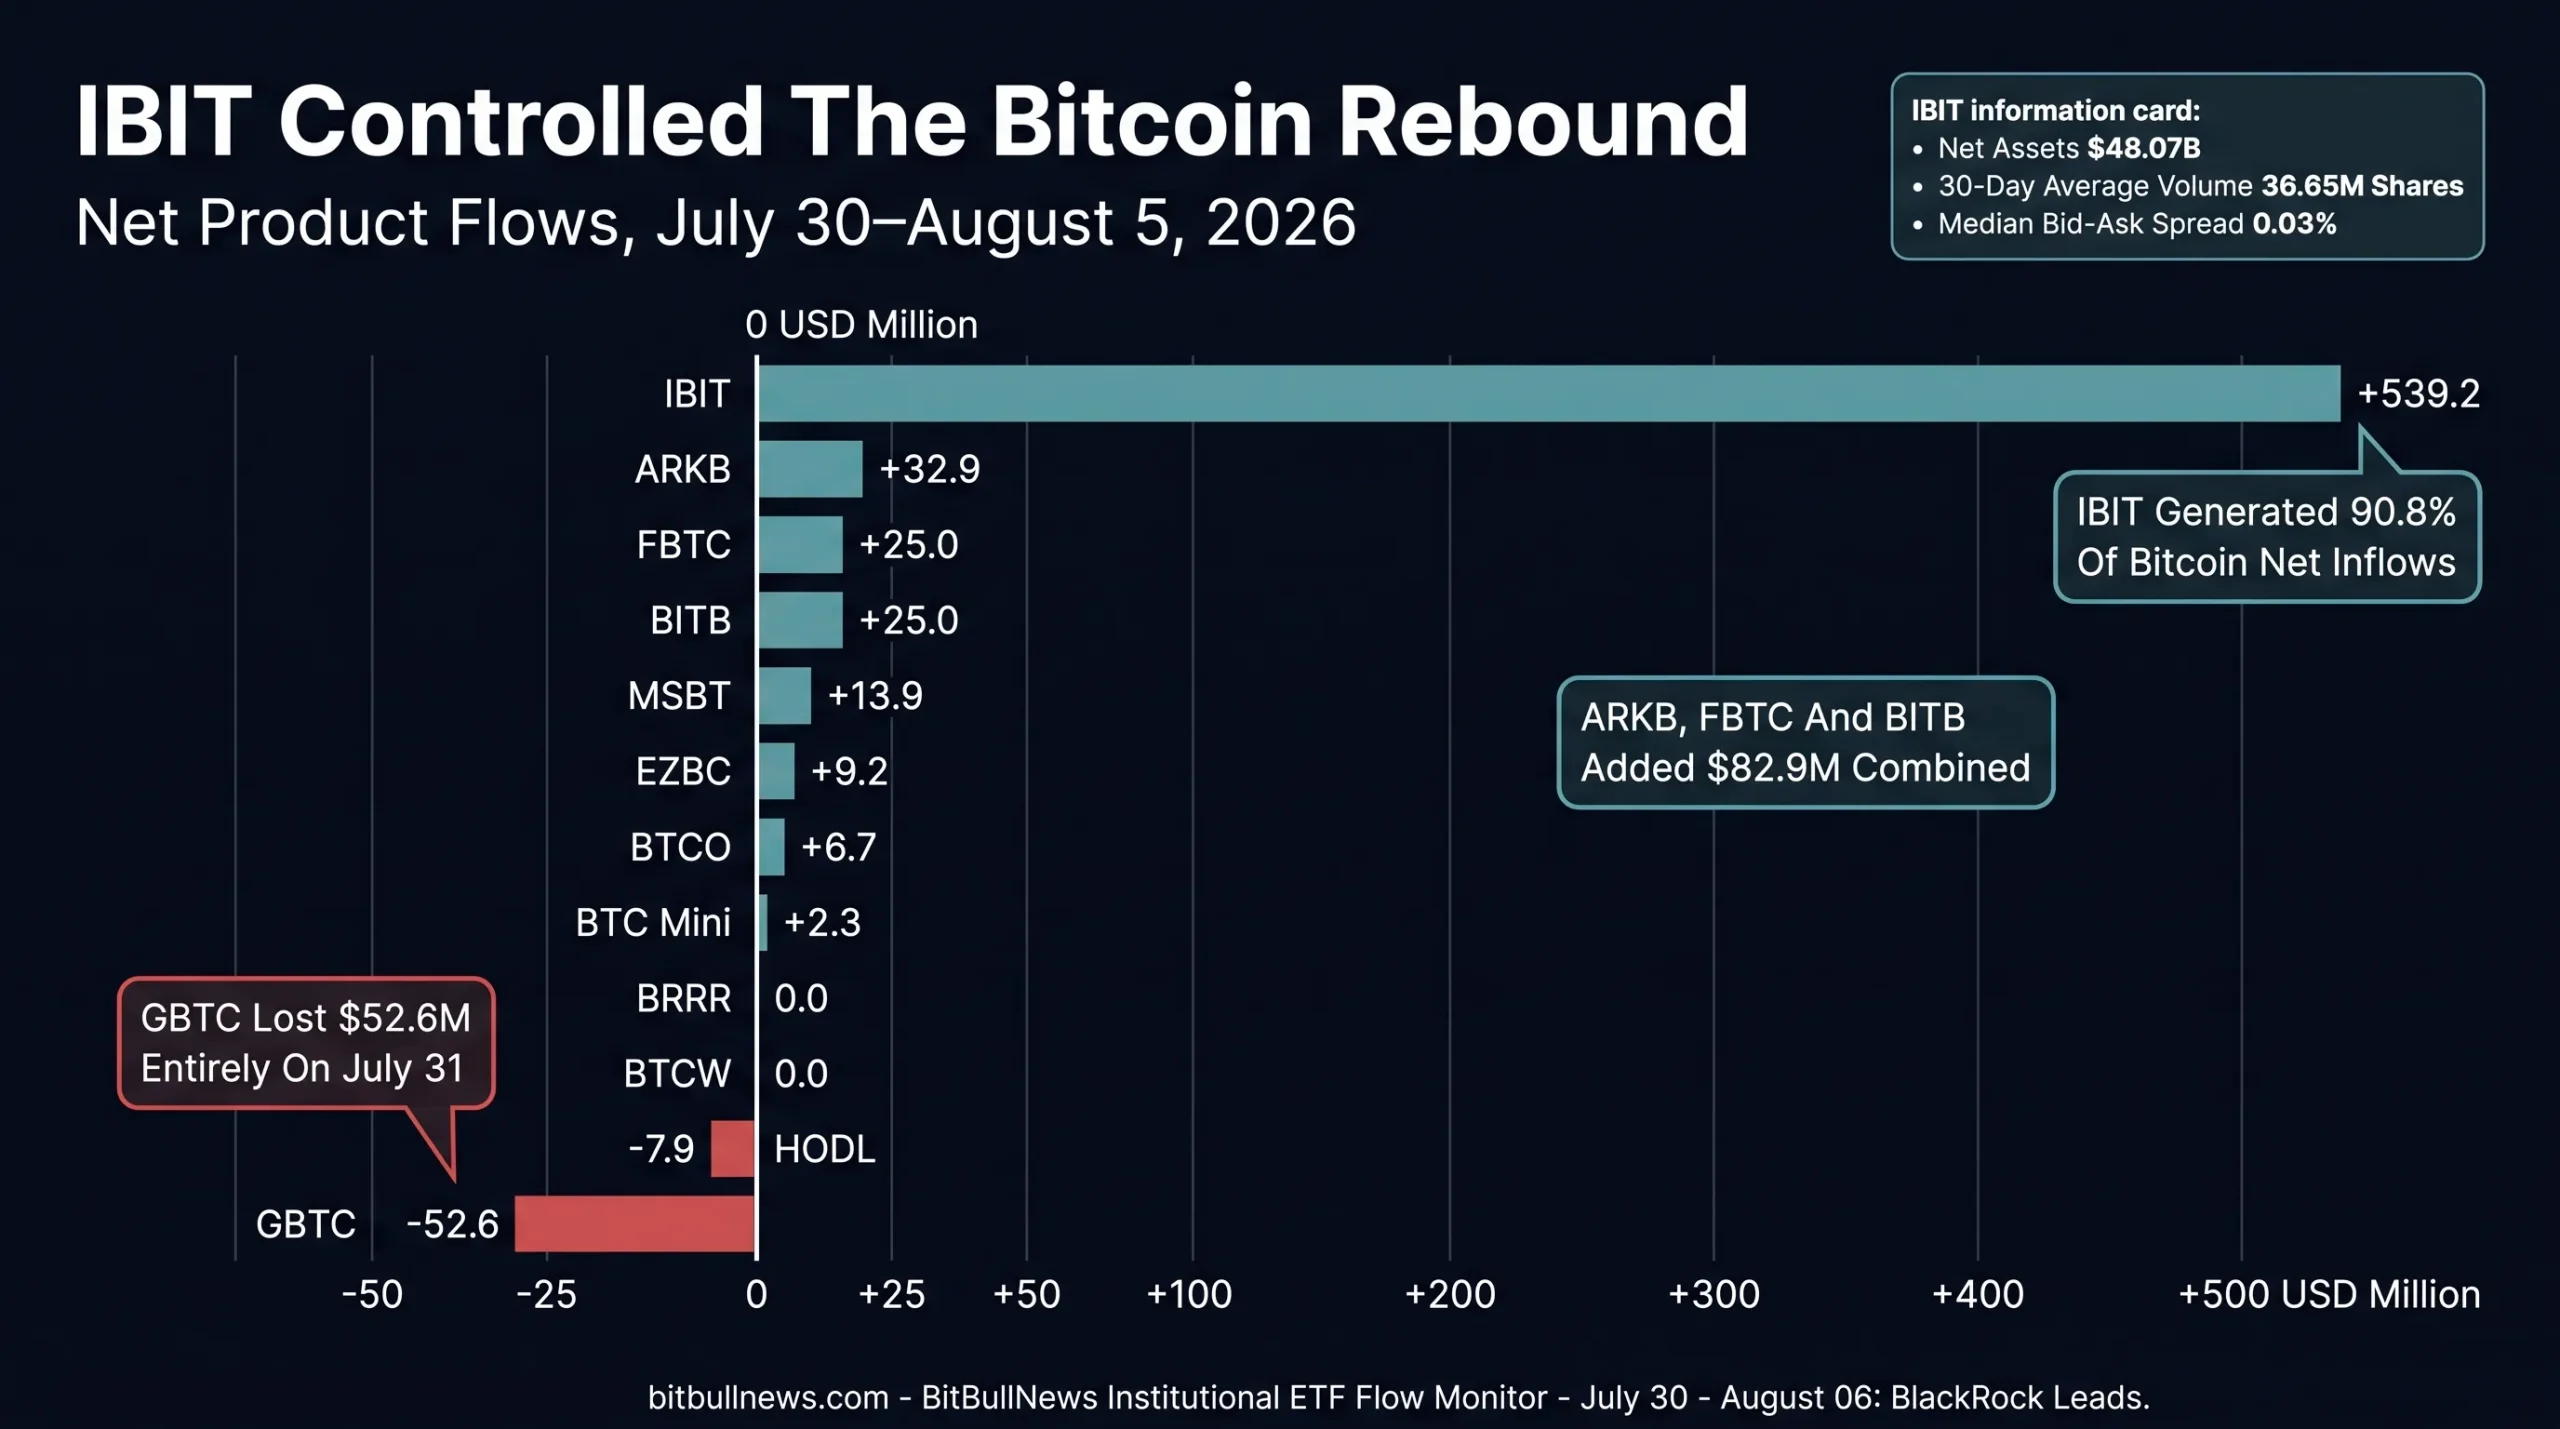
Bitcoin demand was concentrated but not completely isolated.
ARKB, FBTC and BITB each finished positive. Morgan Stanley’s MSBT added $13.9 million. Franklin Templeton and Invesco also recorded creations.
That distribution is healthier than a category result produced by IBIT alone.
GBTC remained the largest negative product at $52.6 million, but the outflow occurred entirely on July 31. It recorded no additional net movement during the following three sessions.
The Bitcoin Rebound Was Broader By The End Of The Period
August 5 supplied the strongest evidence of broader demand.
IBIT attracted $196.8 million, but ARKB added $37.6 million, FBTC gained $11.3 million and BITB received $10.6 million. MSBT added $2.8 million. VanEck’s HODL was the only listed product with a material outflow at $14.7 million.
The distribution reduced dependence on one fund for that session.
IBIT still generated 80.5% of the day’s Bitcoin total, but four other products attracted more than $60 million combined.
The next test is whether that breadth persists.
Ether Demand Moved Into Both Staked And Unstaked Products
Tracked Ether funds attracted $123.8 million.
BlackRock’s conventional ETHA product generated $100 million. Its staked ETHB wrapper added $26.1 million. The pair attracted $126.1 million, exceeding the category’s final result because Grayscale and VanEck products recorded net redemptions.
ETHB supplied 21.1% of total tracked Ether inflows.
That is a significant share for a product with $582.7 million of net assets and a 30-day average trading volume of roughly 347,000 shares. ETHB’s $26.1 million inflow equalled approximately 4.48% of its latest asset base.
ETHA’s $100 million represented about 1.78% of its $5.60 billion net asset base. The conventional product remains almost ten times larger and far more liquid.
The flow intensity favored the staking wrapper. Execution capacity still favors ETHA.
Ether Fund Flows By Product
| Ether Product | Issuer | Net Flow, July 30–August 5 | Share Of Category Flow |
|---|---|---|---|
| ETHA | BlackRock | +$100.0M | 80.8% |
| ETHB | BlackRock | +$26.1M | 21.1% |
| FETH | Fidelity | +$6.5M | 5.3% |
| TETH | 21Shares | +$1.7M | 1.4% |
| ETHW | Bitwise | +$1.6M | 1.3% |
| QETH | Invesco | $0.0M | 0.0% |
| EZET | Franklin Templeton | $0.0M | 0.0% |
| ETHV | VanEck | -$0.7M | -0.6% |
| ETH | Grayscale Ethereum Mini Trust | -$2.0M | -1.6% |
| ETHE | Grayscale | -$9.4M | -7.6% |
| Tracked Total | — | +$123.8M | 100.0% |
MSSE is not included because it was absent from Farside’s Ether table at the cutoff.
The category gained breadth on August 5.
ETHA added $50.3 million, ETHB gained $4.9 million, FETH attracted $2.9 million, ETHW received $1.4 million and TETH added $1.3 million. No tracked Ether product reported an outflow that day.
That was the strongest cross-issuer Ether session of the period.
ETHB Recorded The Highest Flow Intensity
BlackRock’s three primary crypto products produced different signals.
BlackRock Crypto Product Comparison
| Product | Exposure | Period Flow | Net Assets, August 5 | Flow As Share Of Net Assets | 30-Day Average Share Volume | Median Bid-Ask Spread | Additional Yield |
|---|---|---|---|---|---|---|---|
| IBIT | Bitcoin | +$539.2M | $48.07B | +1.12% | 36.65M | 0.03% | None |
| ETHA | Ether | +$100.0M | $5.60B | +1.78% | 28.75M | 0.07% | None |
| ETHB | Staked Ether | +$26.1M | $582.70M | +4.48% | 347,059 | 0.08% | 1.70% 30-Day Staking Rewards Rate |
Product statistics are issuer-reported. Flow data comes from Farside.
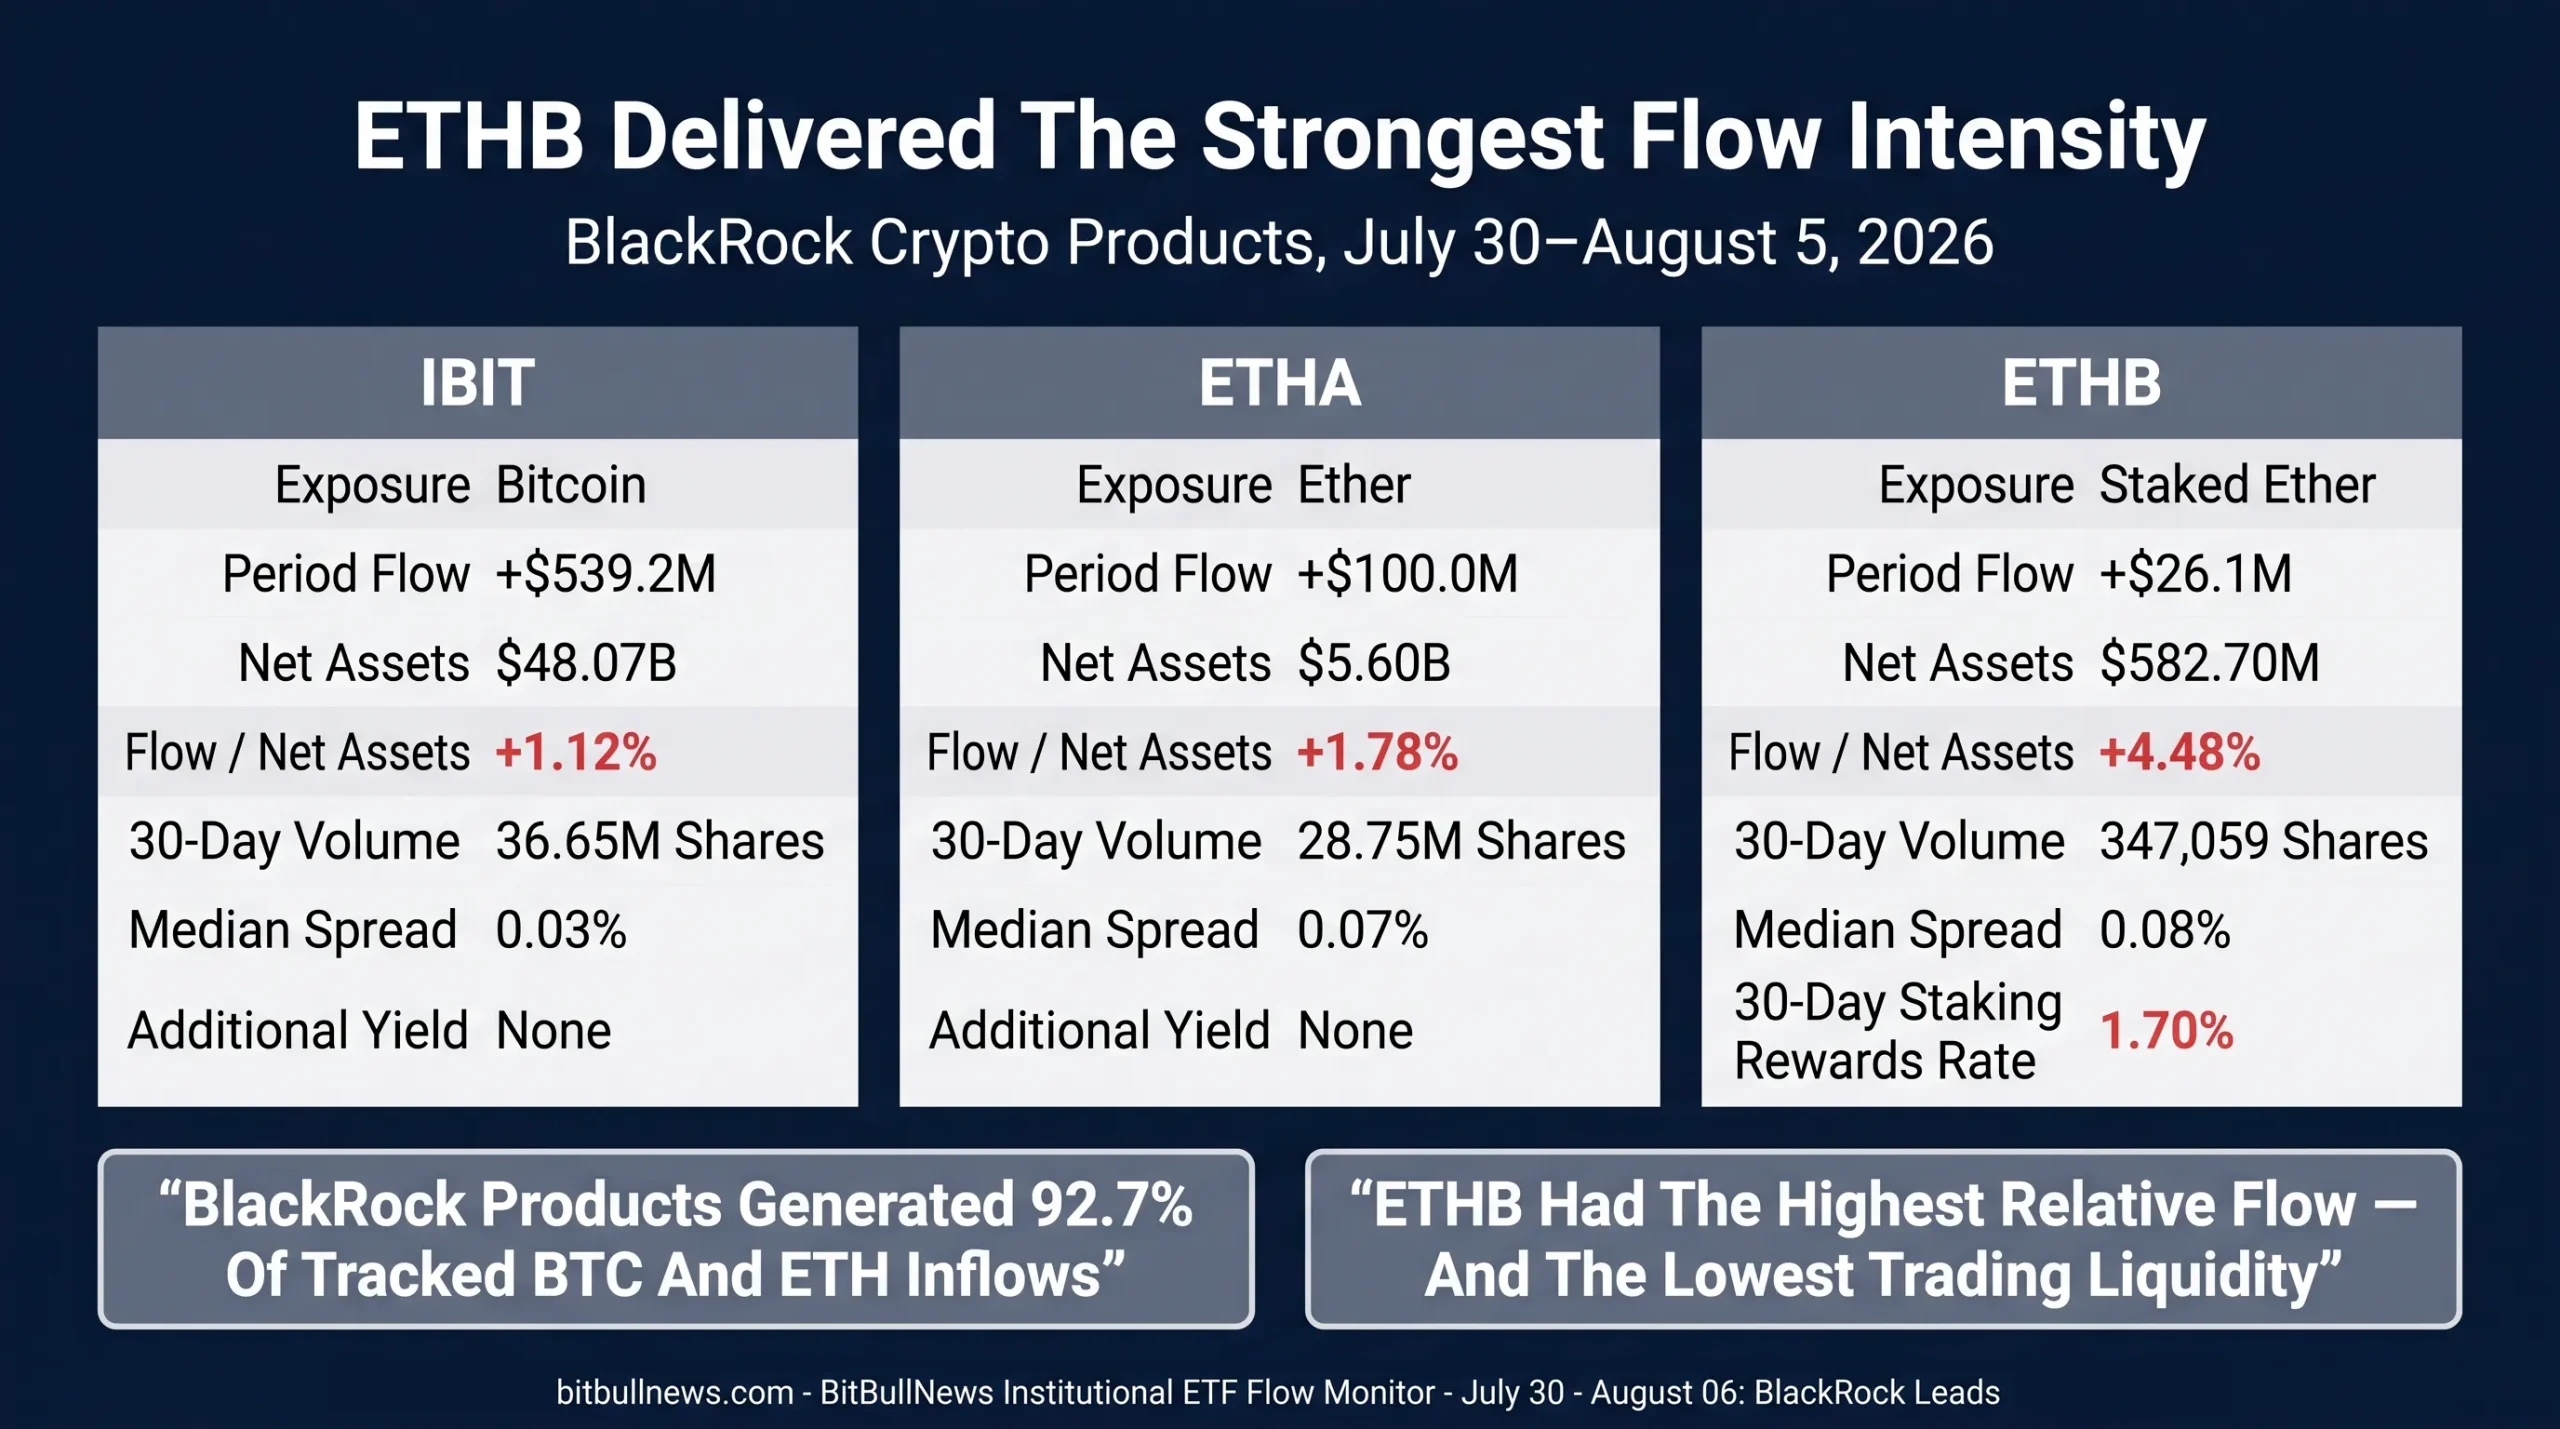
ETHB produced the smallest absolute inflow and the strongest flow relative to current assets.
The product also remains less liquid. Its median bid-ask spread was 0.08%, compared with 0.07% for ETHA, while its average share volume was a fraction of ETHA’s.
Allocators therefore face a clear trade-off:
- ETHA provides deeper secondary-market liquidity.
- ETHB adds staking rewards.
- ETHB currently has lower execution capacity.
- ETHB attracted stronger incremental demand relative to its size.
ETHA’s Reverse Split Is An Operational Change
BlackRock disclosed on August 4 that ETHA will undergo a reverse stock split after the close on October 5 and begin trading on a split-adjusted basis on October 6.
A reverse split changes the number and price of shares. It does not create new Ether exposure or alter the economic value of the trust’s assets by itself.
The timing is relevant because ETHA traded near $14 per share during the reporting period and carried a 0.07% median spread. Raising the per-share price can change trading mechanics and the relative impact of minimum price increments, but it should not be interpreted as an institutional inflow or an asset-allocation decision.
Flow analysis should treat the corporate action separately from creations and redemptions.
Solana Reported No Tracked Flow
Every Solana product in Farside’s table recorded zero net flow on each completed session from July 30 through August 5.
The listed universe consisted of BSOL, VSOL, FSOL, TSOL, SOEZ and GSOL. Historical cumulative net inflows remained approximately $1.12 billion.
That does not establish that the full U.S. Solana product market was inactive.
Morgan Stanley’s MSOL began trading on July 28 and was not included in Farside’s Solana table at the reporting cutoff. Its activity therefore sits outside the comparable series used for this report.
New-Product Data Coverage
| Product | Asset | Launch | Expense Ratio | Staking Design | Included In Farside Flow Total | Latest Primary-Source Asset Data |
|---|---|---|---|---|---|---|
| MSSE | Ether | July 28, 2026 | 0.14% | Intends To Stake Part Of Holdings | No | $21.18M As Of August 4 |
| MSOL | Solana | July 28, 2026 | 0.14% | Intends To Stake Part Of Holdings | No | Not Available In Primary Sources Reviewed |
| ETHB | Ether | February 2026 | 0.12% Introductory / 0.25% Standard | Actively Stakes Part Of Holdings | Yes | $582.70M As Of August 5 |
MSSE and MSOL are discussed separately rather than inserted into the Farside series using a different data provider.
This is a measurement problem that will persist as new crypto products launch.
Institutional research should not combine one provider’s daily flow series with another provider’s net-asset estimate and label the result as a single comparable flow total.
The cleaner approach is to preserve a consistent product universe and disclose what is missing.
Strong Flows Did Not Produce A Breakout
Bitcoin and Ether both finished slightly below their July 30 closing prices despite positive ETF demand.
ETF Flow Versus Underlying Price
| Asset | Tracked Product Flow | July 30 Close | August 5 Close | Period Price Return | Flow-Price Read |
|---|---|---|---|---|---|
| Bitcoin | +$593.7M | $64,725.31 | $64,597.50 | -0.20% | Inflows absorbed supply but did not force a breakout |
| Ether | +$123.8M | $1,917.37 | $1,906.53 | -0.57% | Product demand improved while spot performance remained weak |
| Solana | $0.0M In Farside Dataset | $74.47 On July 30 | Not Used | Not Calculated | Tracked flow series was incomplete after MSOL’s launch |
Bitcoin and Ether prices use CoinMarketCap daily closes. Solana performance is not compared because the tracked flow dataset excludes MSOL.
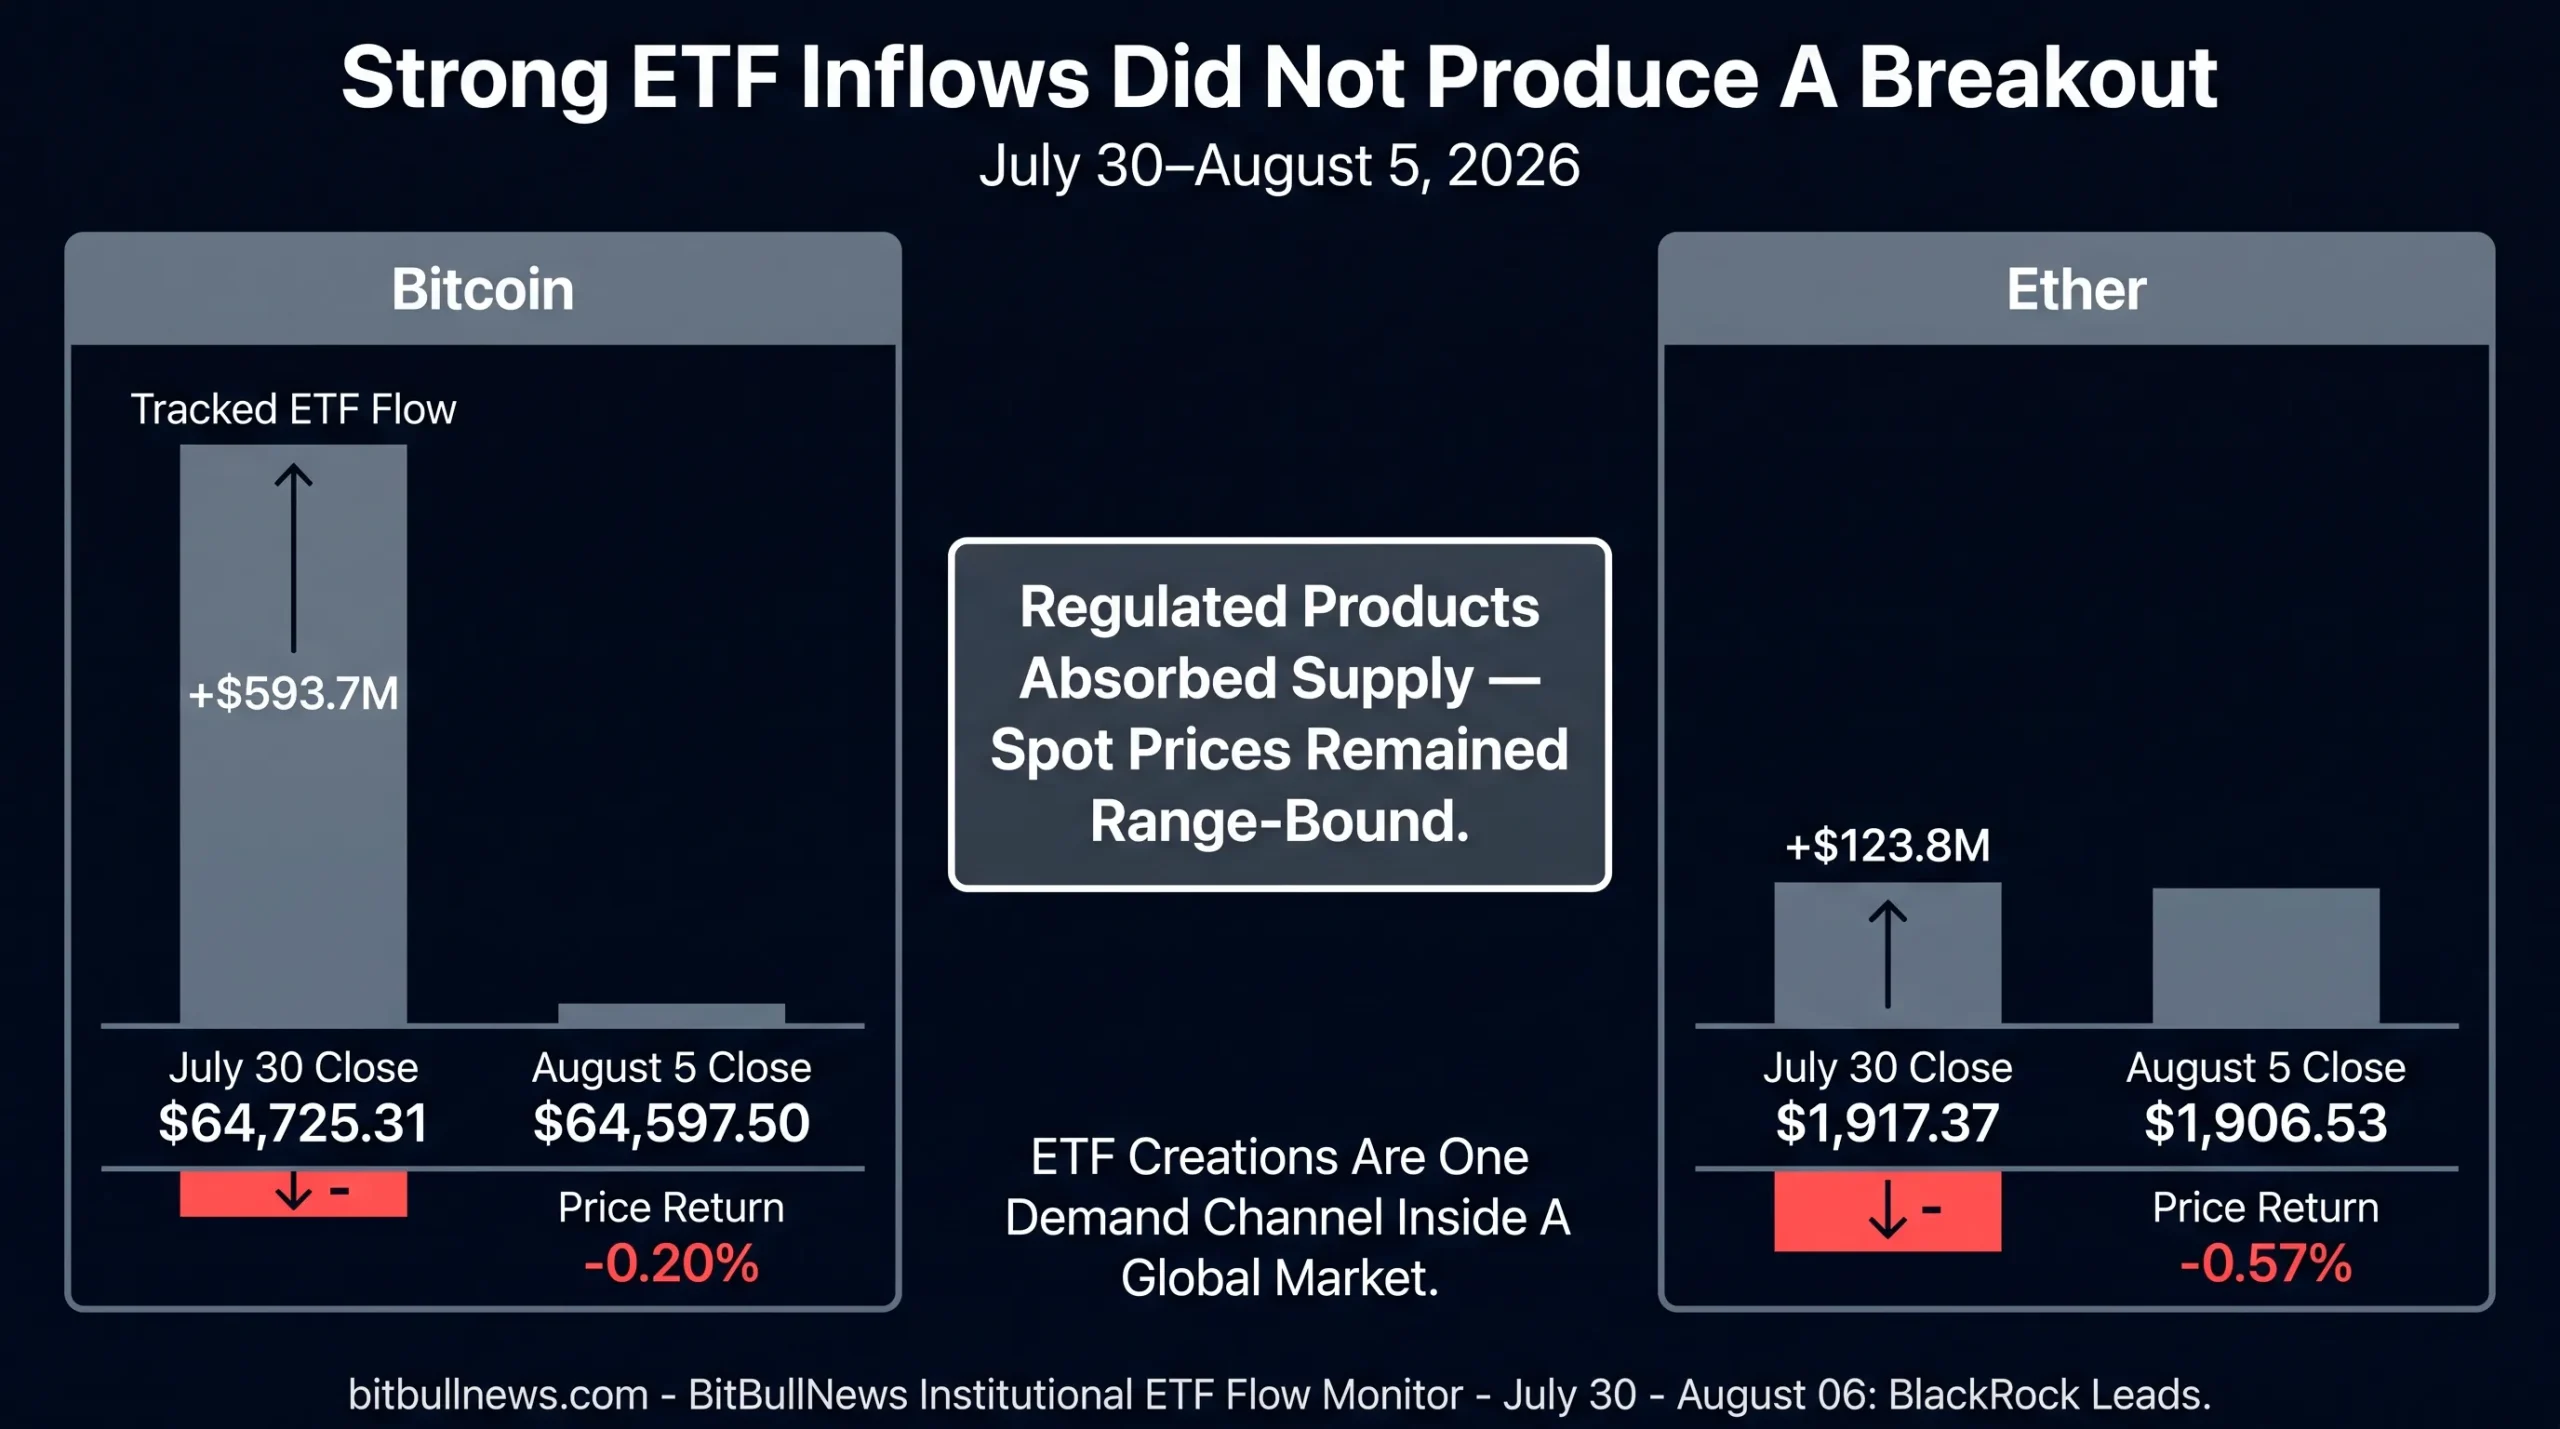
The mismatch does not make ETF flow irrelevant.
The global crypto market also absorbed supply from:
- Offshore exchanges.
- Long-term holders.
- Corporate treasuries.
- Miners and validators.
- Derivatives hedging.
- Non-U.S. investment products.
- Direct institutional accounts.
ETF flows represent one transparent demand channel. They do not measure the entire market.
The current result suggests that regulated products absorbed meaningful selling pressure without yet shifting the price regime.
BlackRock’s Share Creates A Concentration Risk
BlackRock products generated $665.3 million of the $717.5 million tracked Bitcoin and Ether inflow.
That concentration has two interpretations.
The constructive reading is that the world’s largest asset manager continues to provide scalable, liquid and operationally familiar access to crypto exposure.
The risk is that aggregate flow momentum depends heavily on one issuer.
IBIT, ETHA and ETHB supplied 92.7% of the combined result. A reversal across those products could change the weekly market total even if every competing issuer remained stable.
The August 5 data showed some improvement in breadth, particularly for Bitcoin. It did not remove BlackRock’s dominance.
What Institutional Allocators Should Watch Next
Whether Bitcoin Inflows Continue After Three Strong Sessions
Bitcoin funds attracted $626 million across August 3–5.
A fourth positive session would strengthen the case that demand has moved beyond month-end positioning. A sharp reversal would show that the current rebound remains tactical.
Whether IBIT’s Share Falls Without Weakening Total Flow
IBIT supplied 90.8% of the period’s Bitcoin inflow.
A healthier market would maintain positive aggregate flow while FBTC, ARKB, BITB, MSBT and other products capture a larger share.
Whether Ether Demand Broadens Beyond BlackRock
ETHA and ETHB generated more than the category’s net result.
Continued FETH, ETHW and TETH creations would make Ether demand less dependent on one product family.
Whether ETHB Maintains Its Flow Intensity
ETHB’s $26.1 million inflow equalled approximately 4.48% of current assets.
The next question is whether staking demand persists after the initial allocation wave and whether secondary-market liquidity improves with fund size.
Whether MSSE And MSOL Enter The Major Datasets
The missing Morgan Stanley products limit the completeness of current Ether and Solana totals.
Analysts should watch for Farside or another consistent provider to add both products with restated historical data.
Whether ETF Demand Gains Price Confirmation
Bitcoin and Ether remained slightly negative despite inflows.
The stronger signal would be sustained creations accompanied by higher spot volume and a break above the period’s trading range.
Whether GBTC Outflows Return
GBTC lost $52.6 million on July 31 and remained flat afterward.
Repeated redemptions would become a renewed drag. Continued stability would leave the category’s direction more dependent on current-generation products.
Whether ETHA’s Corporate Action Changes Trading Quality
The reverse split should not change underlying exposure.
Allocators should monitor whether ETHA’s bid-ask spread and effective execution cost improve after split-adjusted trading begins in October.
Institutional ETF Risk Dashboard
| Signal | Current Reading | Interpretation | Confirmation Needed |
|---|---|---|---|
| Tracked Combined Flow | +$717.5M | Institutional wrapper demand reversed strongly | Positive follow-through after August 5 |
| Five-Session Flow Swing | +$1.285B | Previous redemption cycle reversed | Stability across multiple monitoring periods |
| Bitcoin Flow | +$593.7M | BTC supplied 82.7% of tracked demand | Broader issuer participation |
| Ether Flow | +$123.8M | ETH demand improved materially | Continued non-BlackRock creations |
| Solana Tracked Flow | $0.0M | Established products were inactive | Complete data including MSOL |
| Positive Sessions | Four Of Five | Demand was persistent after July 31 | Additional positive sessions |
| August 3–5 Combined Flow | +$728.0M | New-month demand strengthened | Inflows continue outside month-end effects |
| IBIT Flow | +$539.2M | Main driver of Bitcoin demand | Category remains positive with lower IBIT concentration |
| IBIT Share Of BTC Flow | 90.8% | Bitcoin allocation remained highly concentrated | FBTC, ARKB and BITB gain share |
| GBTC Flow | -$52.6M | Legacy product remained a drag on one session | No renewed redemption streak |
| ETHA Flow | +$100.0M | Conventional BlackRock wrapper led Ether | Demand broadens across issuers |
| ETHB Flow | +$26.1M | Staking exposure attracted incremental capital | Continued growth with improved liquidity |
| ETHB Flow Intensity | +4.48% Of Net Assets | Strongest relative demand among BlackRock products | Multiweek persistence |
| ETHA Reverse Split | Effective In October | Operational change, not new exposure | Tighter effective trading spreads |
| BlackRock Share Of BTC And ETH Flow | 92.7% | One issuer dominated institutional demand | More balanced product competition |
| BTC Price Return | -0.20% | Strong flow did not create a breakout | Price and spot volume confirm |
| ETH Price Return | -0.57% | Ether demand improved without positive performance | Stronger underlying-market demand |
| Data Coverage | MSSE And MSOL Missing From Farside | ETH and SOL totals are incomplete | Consistent provider coverage |
| IBIT Liquidity | $48.07B AUM, 0.03% Median Spread | Deepest institutional execution route | Liquidity remains resilient during outflows |
| ETHB Liquidity | $582.70M AUM, 0.08% Median Spread | Smaller product carries execution constraints | Higher volume and tighter spread |
Flow Without Momentum: The BlackRock Dependency Test
Institutional crypto demand returned this week.
The products tracked by Farside attracted $717.5 million across five completed U.S. sessions. Bitcoin funds added $593.7 million. Ether products gained $123.8 million. Tracked Solana funds reported no net movement.
The reversal from the previous five-session period reached approximately $1.29 billion.
BlackRock controlled the result.
IBIT attracted $539.2 million and supplied 90.8% of Bitcoin’s inflow. ETHA gained $100 million. ETHB added $26.1 million. Together, the three products generated 92.7% of all tracked Bitcoin and Ether demand.
The concentration did not mean every other issuer was inactive.
ARKB, FBTC, BITB and MSBT finished positive. Ether gained support from Fidelity, Bitwise and 21Shares. August 5 produced the broadest cross-issuer allocation of the period.
Staking remained the most important product-level trend.
ETHB attracted more than one-fifth of tracked Ether inflows and added capital equal to approximately 4.48% of its current assets. ETHA still provides much deeper liquidity, but the flow intensity shows that investors are willing to accept a smaller trading venue for access to staking income.
The data remains incomplete.
Morgan Stanley’s MSSE and MSOL were not included in Farside’s tables. MSSE already held more than $21 million of assets as of August 4, meaning the published Ether total does not capture every active U.S. product. Solana’s zero-flow reading should be interpreted with even more caution because MSOL is missing from the series.
Price was the weakest confirmation.
Bitcoin and Ether both finished slightly lower despite the positive flows. The wrappers absorbed supply, but they did not produce a new spot-market trend.
That leaves a clear test for the next report.
Institutional demand has returned. The market now needs broader issuer participation, complete coverage of new products and price confirmation that does not depend almost entirely on BlackRock.
Data Sources & References
- Farside Investors — Bitcoin ETF Flows
- Farside Investors — Ethereum ETF Flows
- Farside Investors — Solana ETF Flows
- BlackRock — iShares Bitcoin Trust ETF
- BlackRock — iShares Ethereum Trust ETF
- BlackRock — iShares Staked Ethereum Trust ETF
- Morgan Stanley — MSSE Product Page
- Morgan Stanley — MSSE And MSOL Launch
- CoinMarketCap — Bitcoin Historical Data
- CoinMarketCap — Ethereum Historical Data