



Content
Bitcoin finished the monitoring period almost unchanged. The derivatives market underneath it was anything but static.

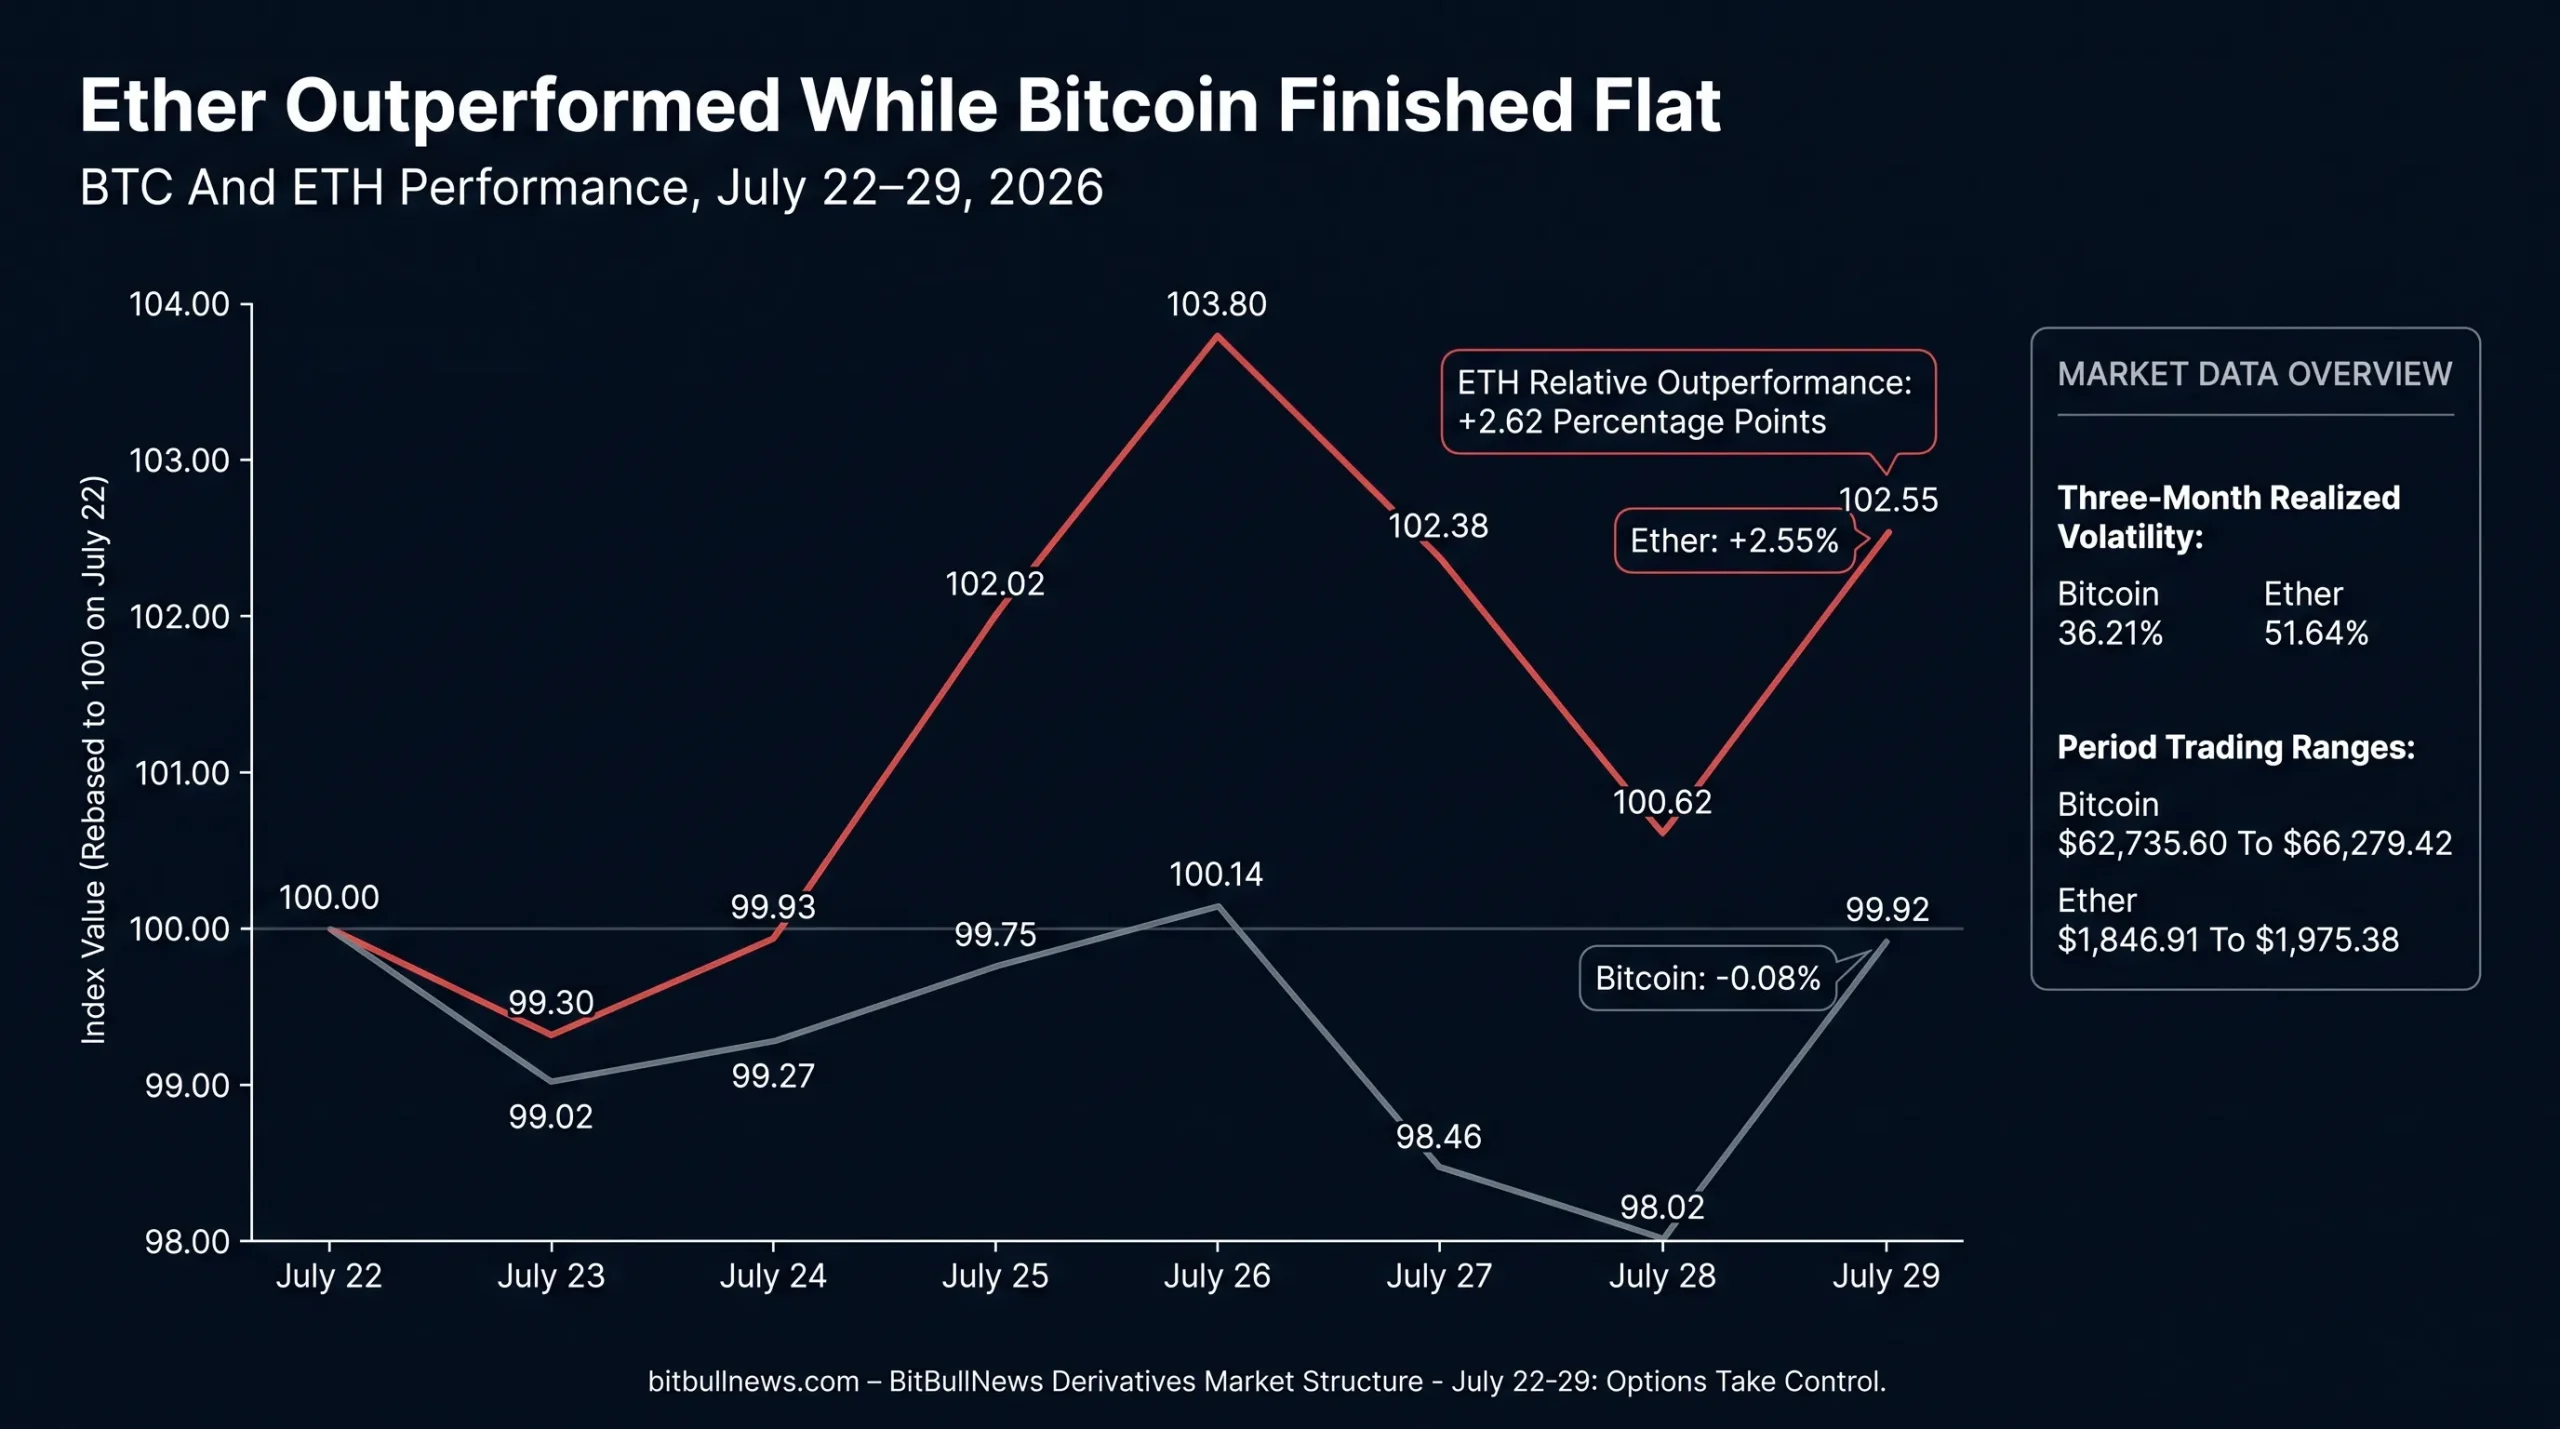
BTC closed July 29 at $64,754.98, only 0.08% below its July 22 close. Ether gained 2.55% to $1,922.33, outperforming Bitcoin by 2.62 percentage points. ETH delivered the stronger return despite carrying substantially higher realized volatility and receiving only $16.5 million of net U.S. ETF inflows.
Bitcoin’s linear derivatives market remained subdued. K33 measured total futures and perpetual open interest at approximately $32.1 billion, down 2.1% over seven days. The annualized CME basis slipped below 5%, perpetual funding largely stayed between 5% and 7% annualized, and July remained on course for Bitcoin’s weakest average daily spot volume since November 2023.
The risk migrated into options.
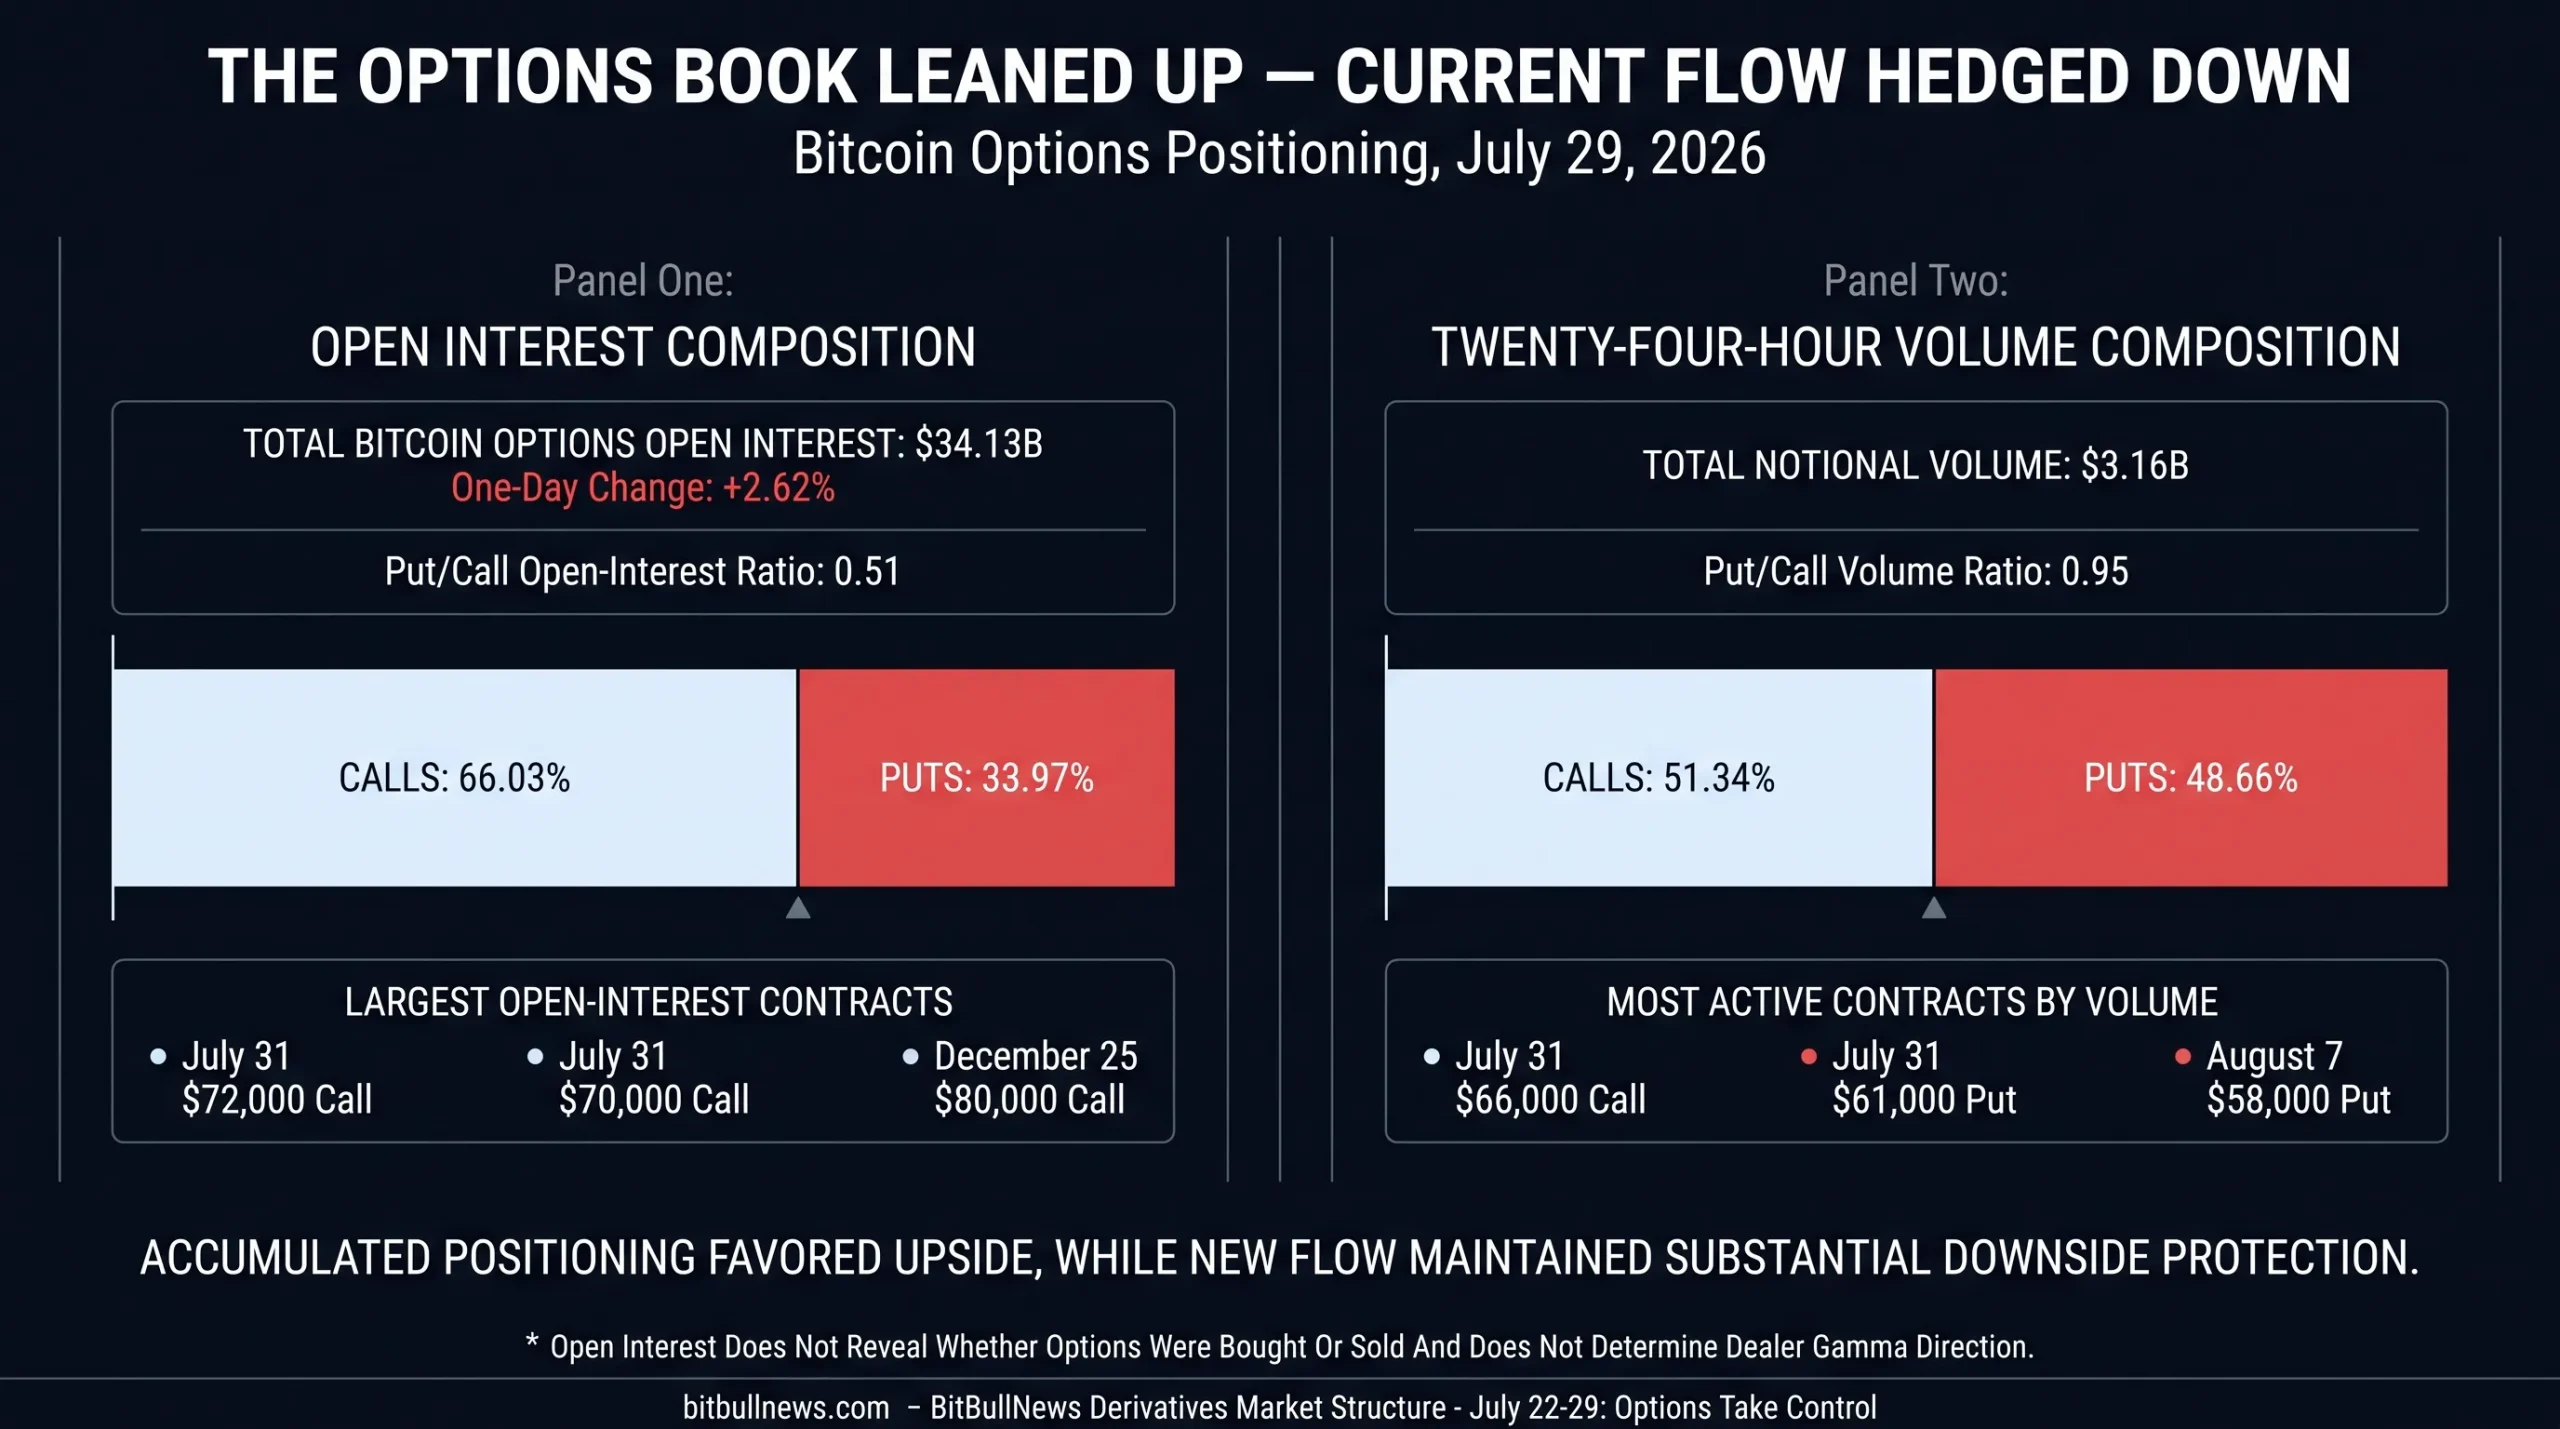
Bitcoin options open interest reached $34.13 billion on July 29, exceeding the $32.1 billion of combined futures and perpetual exposure measured in K33’s separate market universe. Calls represented 66.03% of options open interest, but 24-hour trading volume was almost evenly divided between calls and puts. The accumulated book leaned toward upside. Current flow was much more defensive.
That distinction defined the week. Directional leverage was not expanding aggressively, but strike concentration, ETF redemptions and short-dated hedging left the market vulnerable to sharp moves around the July 31 options expiry.
Market Structure Scorecard
| Metric | Bitcoin | Ether | Market Read |
|---|---|---|---|
| Period Return | -0.08% | +2.55% | ETH outperformed by 2.62 percentage points |
| July 29 New York Close | $64,754.98 | $1,922.33 | BTC returned to its starting level; ETH held a weekly gain |
| Period Trading Range | $62,735.60–$66,279.42 | $1,846.91–$1,975.38 | Both assets experienced wider intraperiod moves than closing returns suggest |
| Three-Month Realized Volatility | 36.21% | 51.64% | ETH remained the higher-beta market |
| U.S. Spot ETF Flow | -$425.3M | +$16.5M | Regulated wrapper demand favored ETH at the margin |
| Standard CME Open Interest | 20,527 Contracts | 23,667 Contracts | Both contracts added open interest through July 21 |
| CME Asset-Manager Net Position | +2,727 Contracts | -2,420 Contracts | Institutional positioning diverged sharply |
| CME Leveraged-Fund Net Position | -7,949 Contracts | -7,053 Contracts | Leveraged funds remained net short in both markets |
| Bitcoin Futures And Perpetual OI | $32.1B | Not Used | BTC linear leverage fell 2.1% over seven days |
| Bitcoin Options Open Interest | $34.13B | Not Used | Options became the larger visible concentration of BTC derivatives exposure |
Price and volatility figures use Coin Metrics benchmarks. ETF flows cover the six completed U.S. sessions from July 22 through July 29. CFTC positions were held on July 21 and released during the monitoring period. Futures and options totals use different provider universes and should not be mechanically combined.
Bitcoin Went Nowhere — Ether Did Not
Bitcoin’s closing return understates the amount of movement inside the period.
BTC traded as high as $66,279.42 on July 22 and as low as $62,735.60 on July 27. The peak-to-trough difference was roughly 5.3%, yet the asset finished less than $50 below its starting close.
Ether followed a stronger path. ETH fell below $1,850 on July 23, rallied to an intraperiod high of $1,975.38 on July 26 and finished the period at $1,922.33.
Daily BTC And ETH Performance
| Date | BTC Close | BTC Index | ETH Close | ETH Index |
|---|---|---|---|---|
| July 22 | $64,804.36 | 100.00 | $1,874.60 | 100.00 |
| July 23 | $64,171.00 | 99.02 | $1,861.56 | 99.30 |
| July 24 | $64,330.32 | 99.27 | $1,873.20 | 99.93 |
| July 25 | $64,644.86 | 99.75 | $1,912.38 | 102.02 |
| July 26 | $64,896.30 | 100.14 | $1,945.89 | 103.80 |
| July 27 | $63,804.75 | 98.46 | $1,919.19 | 102.38 |
| July 28 | $63,520.81 | 98.02 | $1,886.26 | 100.62 |
| July 29 | $64,754.98 | 99.92 | $1,922.33 | 102.55 |
Each index begins at 100 on July 22. Closing prices use the Coin Metrics New York benchmark close.
The divergence did not come with lower risk.
Ether’s three-month realized volatility stood at 51.64%, compared with 36.21% for Bitcoin. ETH generated a higher return, but investors still absorbed substantially more historical price variability to obtain it.
The stronger ETH close also cannot be explained by ETF demand alone. Ether funds attracted only $16.5 million during the period. Offshore spot markets, futures positioning and native crypto demand therefore carried most of the price move.
Bitcoin Lost Its ETF Support
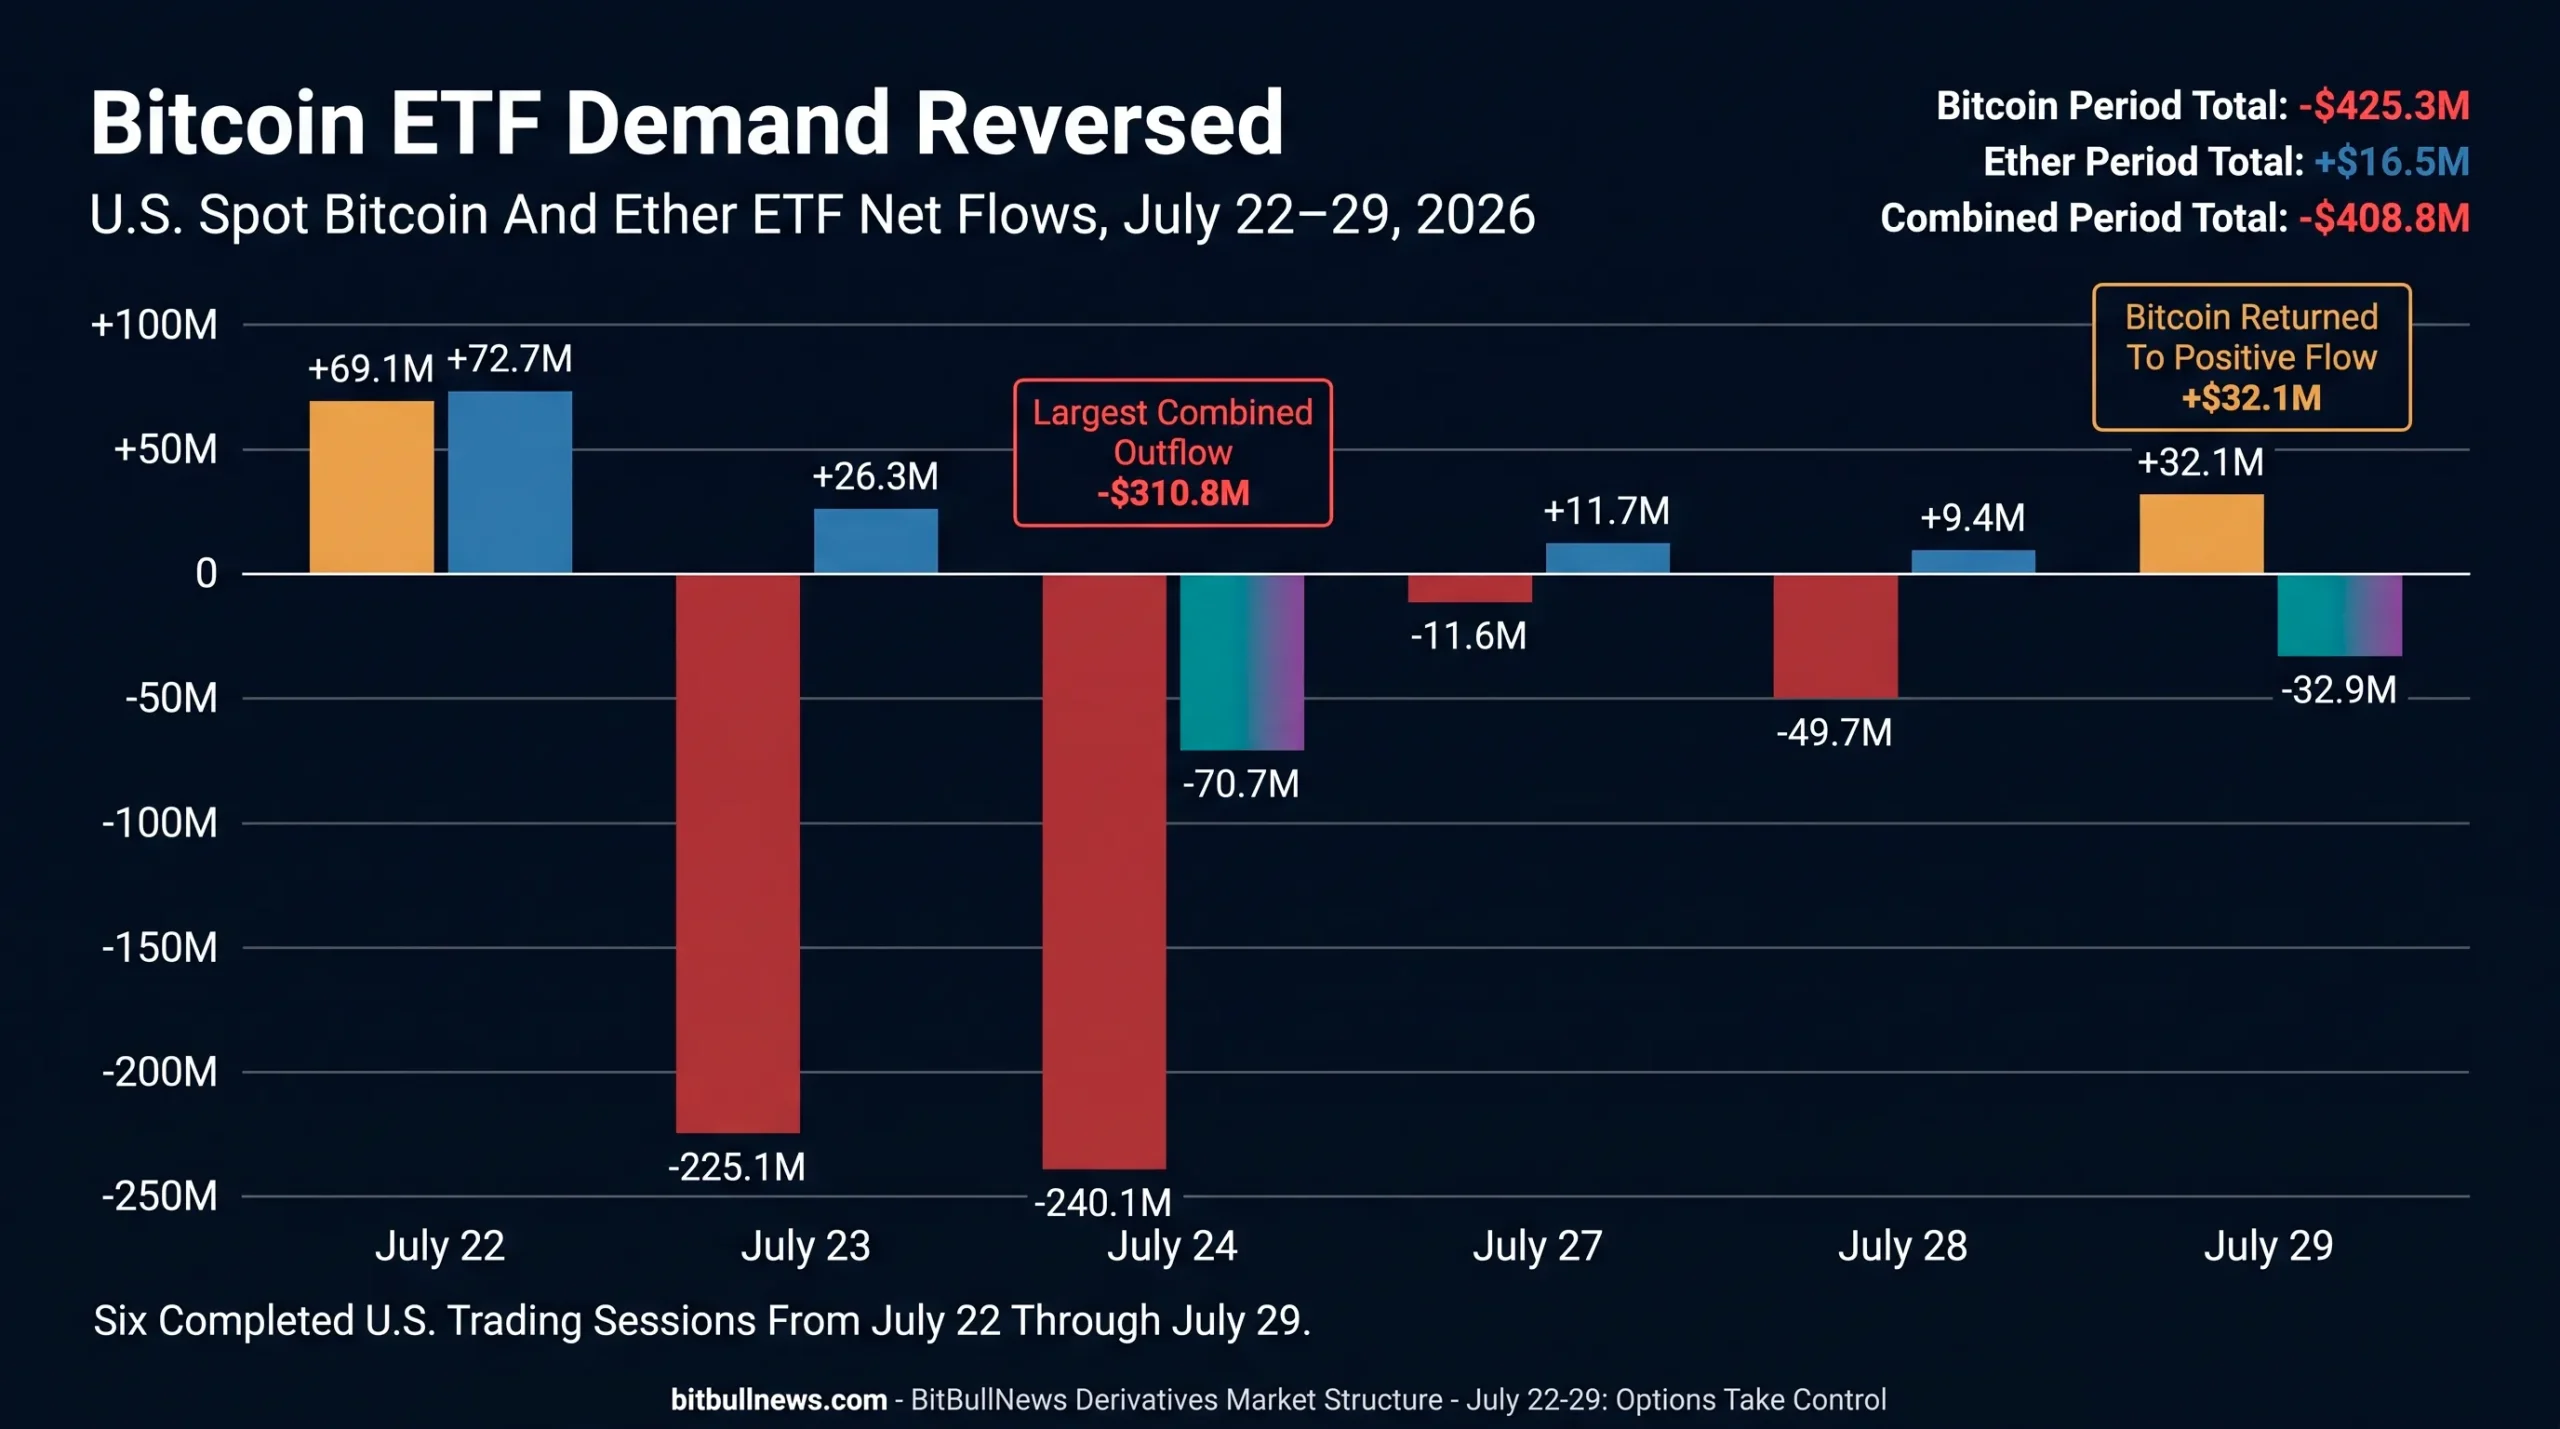
U.S. spot Bitcoin ETFs recorded $425.3 million of net redemptions across the six completed sessions from July 22 through July 29.
The damage was concentrated on July 23 and July 24, when the funds lost $225.1 million and $240.1 million. Bitcoin returned to a modest $32.1 million inflow on July 29, but that final session offset less than 8% of the period’s redemptions.
Ether funds finished slightly positive at $16.5 million. Their path was unstable: $99 million entered during the first two sessions, $70.7 million left on July 24 and another $32.9 million was redeemed on July 29.
Daily Bitcoin And Ether ETF Flows
| Trading Date | Bitcoin ETF Flow | Ether ETF Flow | Combined Flow |
|---|---|---|---|
| July 22 | +$69.1M | +$72.7M | +$141.8M |
| July 23 | -$225.1M | +$26.3M | -$198.8M |
| July 24 | -$240.1M | -$70.7M | -$310.8M |
| July 27 | -$11.6M | +$11.7M | +$0.1M |
| July 28 | -$49.7M | +$9.4M | -$40.3M |
| July 29 | +$32.1M | -$32.9M | -$0.8M |
| Period Total | -$425.3M | +$16.5M | -$408.8M |
Flows cover completed U.S. trading sessions inside the July 22–29 monitoring period.
The issuer breakdown made the Bitcoin reversal more significant.
IBIT lost a net $349.7 million during the period. Fidelity’s FBTC lost $57.9 million, ARKB lost $18.9 million and GBTC lost $38.3 million. Grayscale’s lower-fee Bitcoin Mini Trust attracted $43 million, while Morgan Stanley’s MSBT added $8.8 million. The positive contributions were too small to offset redemptions from the larger products.
ETHA remained the main source of Ether demand, adding $29.6 million. BlackRock’s staked ETHB product added $8.8 million. Fidelity’s FETH lost $9.8 million, while Grayscale’s two Ether products produced a combined $7.9 million outflow.
The contrast helps explain the relative performance.
Bitcoin had to absorb more than $400 million of regulated-wrapper supply while trading in its weakest spot-volume month since late 2023. Ether faced no equivalent ETF drag and still had enough marginal demand to maintain a weekly gain.
Bitcoin’s Spot Market Remained Thin
K33 measured July’s average daily Bitcoin spot volume at approximately $2.2 billion across its tracked exchanges. That placed the month on course for the lowest average since November 2023.
The seven-day average stood at $2.1 billion, down 4% from the previous week.
Low volume does not automatically predict lower prices. It makes price discovery less reliable.
A rally built on shallow turnover can move quickly because less capital is required to clear available offers. The same condition makes the move easier to reverse when ETF redemptions, options hedging or macro events create new selling pressure.
Bitcoin’s flat closing return should therefore not be interpreted as equilibrium. It was a narrow balance between weak spot participation, ETF outflows and a derivatives market that had not committed heavily in either direction.
Linear Bitcoin Leverage Cooled
K33’s July 27 report showed that Bitcoin’s futures and perpetual markets were not expanding alongside the options book.
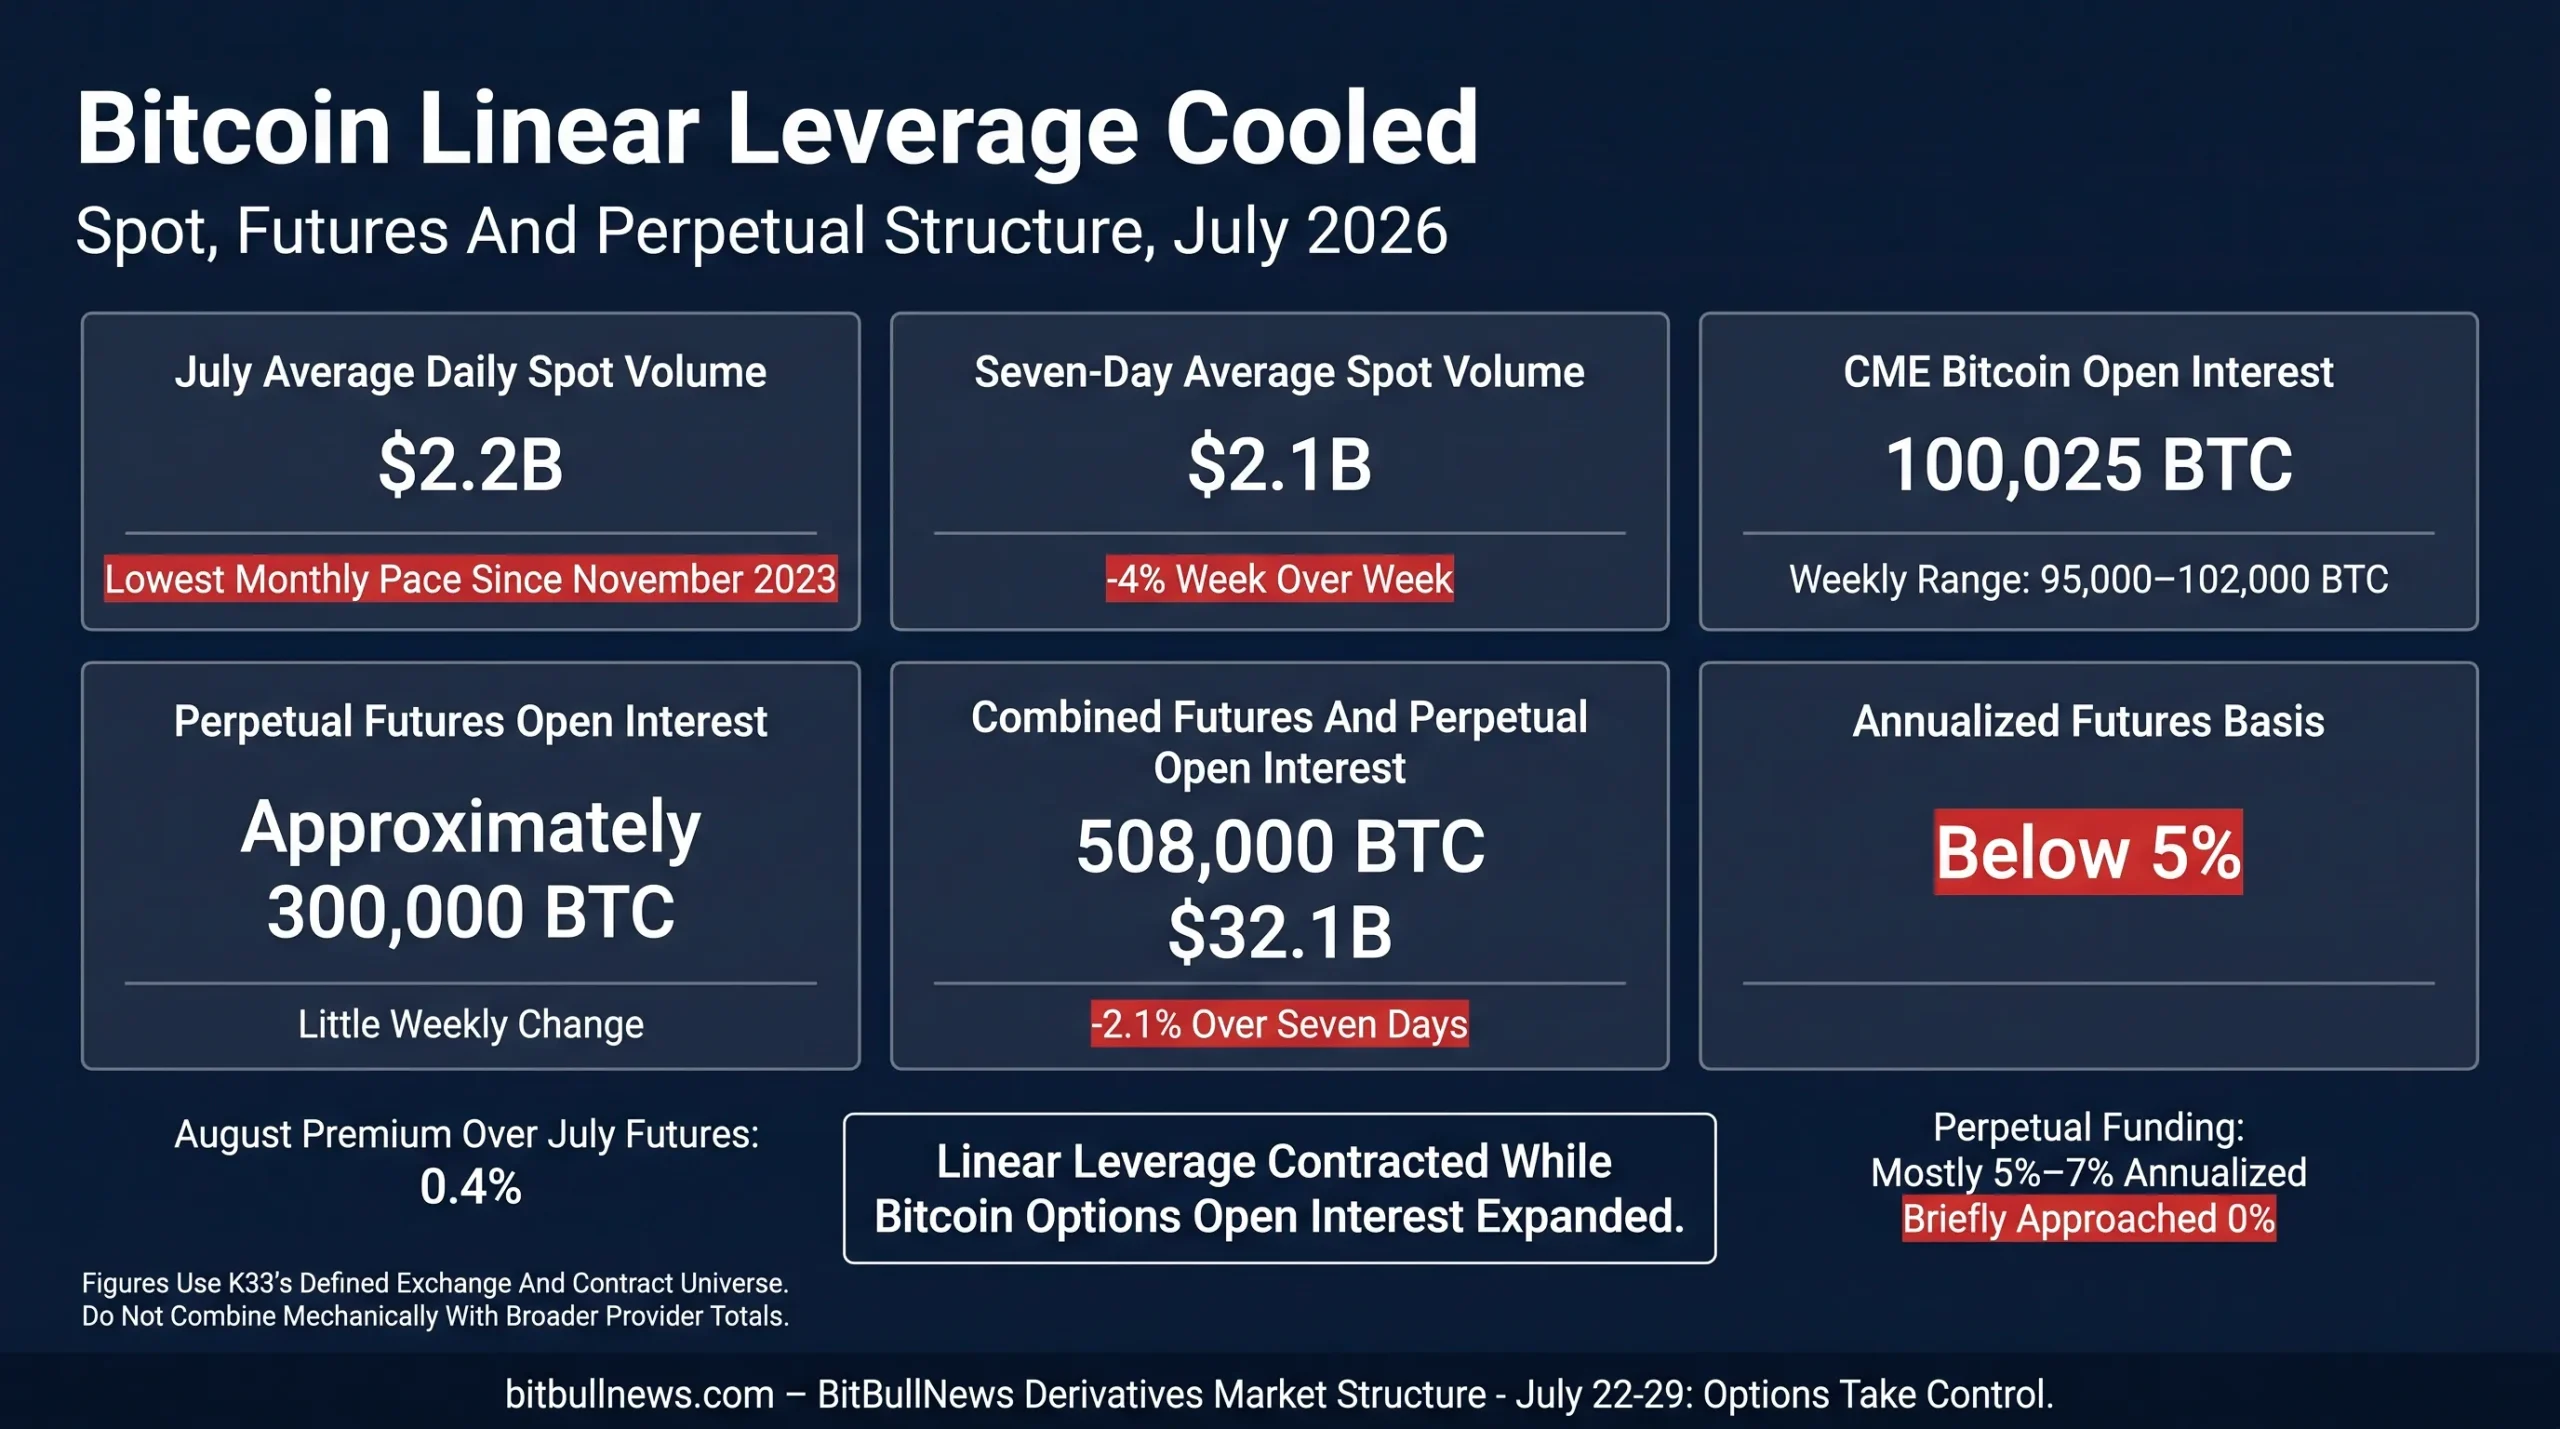
Combined futures and perpetual open interest stood at approximately 508,000 BTC, valued at $32.1 billion. That was down 2.1% over seven days. Perpetual open interest remained near 300,000 BTC, while CME open interest stood at 100,025 BTC ahead of the July futures expiry.
Bitcoin Linear Derivatives Snapshot
| Metric | Current Reading | Weekly Or Historical Context | Interpretation |
|---|---|---|---|
| July Average Daily Spot Volume | $2.2B | Lowest Monthly Pace Since November 2023 | Underlying liquidity remained weak |
| Seven-Day Average Spot Volume | $2.1B | -4% Week Over Week | Participation slowed further |
| CME Bitcoin Open Interest | 100,025 BTC | Weekly Range Of 95,000–102,000 BTC | Regulated futures exposure remained subdued |
| Perpetual Futures Open Interest | Approximately 300,000 BTC | Little Weekly Change | Offshore leverage was stable rather than accelerating |
| Total Futures And Perpetual OI | 508,000 BTC / $32.1B | -2.1% Over Seven Days | Linear leverage contracted |
| Annualized Futures Basis | Below 5% | Drifted Lower During The Week | Cash-and-carry demand was restrained |
| August Premium Over July Futures | 0.4% | Measured Ahead Of July Expiry | The curve remained modestly upward sloping |
| Perpetual Funding | Mostly 5%–7% Annualized | Briefly Approached 0% | Long positioning was positive but not crowded |
The figures use K33’s defined exchange and instrument universe. They should not be compared directly with broader dashboards that cover different venues, contract types or collateral conventions.
This was not the structure of a market overwhelmed by leveraged longs.
Funding remained positive, but the 5%–7% annualized range was restrained. The futures basis below 5% also offered limited evidence of aggressive demand for leveraged long exposure.
The cleaner interpretation is that Bitcoin’s linear market was waiting. Traders maintained exposure, but they did not expand it enough to generate a decisive breakout or a broad liquidation chain.
The risk was accumulating elsewhere.
CME Positioning Diverged Between Bitcoin And Ether
The CFTC’s report for positions held on July 21 showed rising open interest in both standard CME contracts.
Bitcoin open interest increased by 1,142 contracts to 20,527. Ether open interest rose by 1,128 contracts to 23,667. The category-level positioning moved in opposite directions.
CME Standard Futures Positioning
| Contract | Open Interest | Weekly OI Change | Asset-Manager Net | Weekly Net Change | Leveraged-Fund Net | Weekly Net Change |
|---|---|---|---|---|---|---|
| Bitcoin Futures | 20,527 | +1,142 | +2,727 | -88 | -7,949 | -458 |
| Ether Futures | 23,667 | +1,128 | -2,420 | -1,014 | -7,053 | +908 |
Net position equals reported long contracts minus reported short contracts. Positive weekly changes represent movement toward a larger net long or smaller net short. Bitcoin contracts represent five BTC; Ether contracts use a different contract size, so raw contract totals should not be compared as equivalent notional exposure.
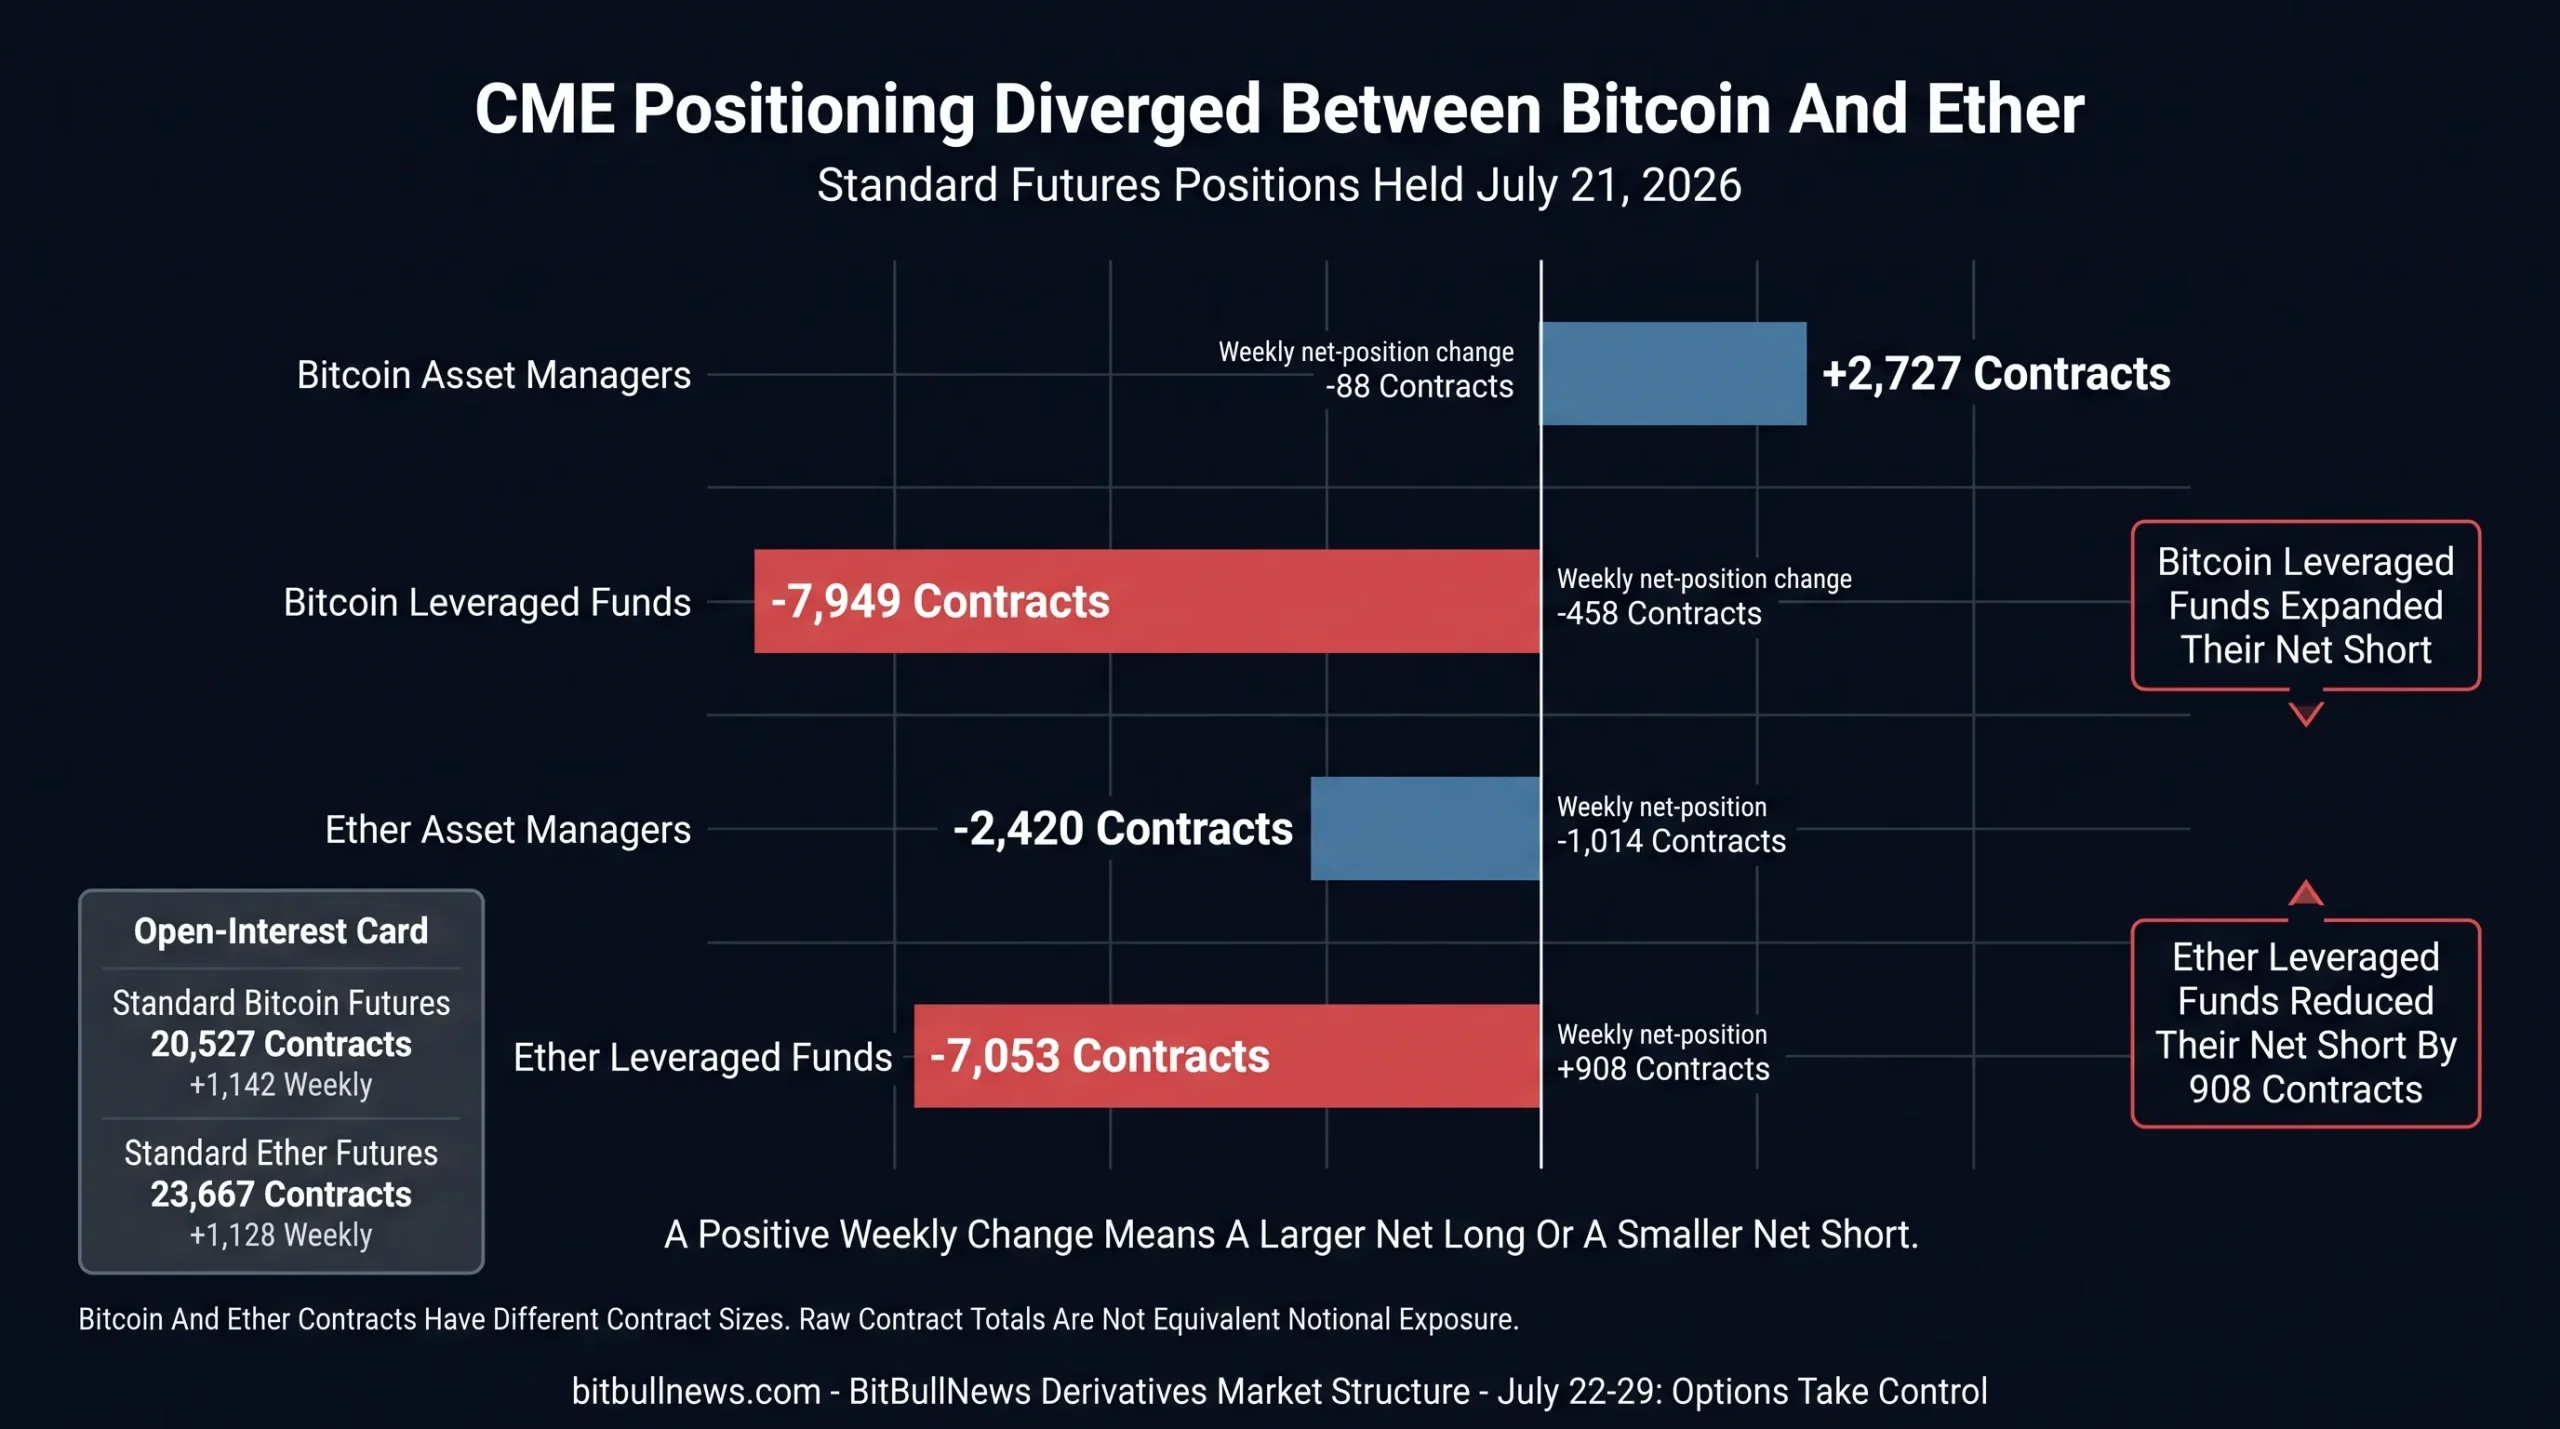
Bitcoin asset managers remained net long, but their position weakened slightly. Leveraged funds increased their net short by 458 contracts to -7,949.
Ether moved differently.
Asset managers increased their net short by 1,014 contracts, reaching -2,420. Leveraged funds reduced their net short by 908 contracts to -7,053.
That split does not support a simple institutional-bullish or institutional-bearish narrative.
Leveraged-fund shorts can hedge spot holdings, ETFs, options or cross-market basis trades. Asset managers may also use futures to reduce risk held elsewhere. The report identifies positioning by category, not the economic purpose behind every contract.
The relative change is still useful. Leveraged funds became more defensive in Bitcoin while reducing part of their bearish imbalance in Ether. That direction was consistent with ETH’s subsequent relative outperformance.
Options Became The Main Concentration Of Bitcoin Risk
CoinGlass data reported on July 29 placed total Bitcoin options open interest at $34.13 billion, up 2.62% from the previous day. Twenty-four-hour notional options volume reached approximately $3.16 billion.
The accumulated book was heavily call-weighted. Recent trading was not.
Bitcoin Options Structure
| Options Metric | July 29 Reading | Market Interpretation |
|---|---|---|
| Total Options Open Interest | $34.13B | Large accumulated options exposure |
| One-Day Open Interest Change | +2.62% | New or rolled positions entered before expiry |
| Twenty-Four-Hour Notional Volume | $3.16B | Short-dated repositioning remained active |
| Calls As Share Of Open Interest | 66.03% | Outstanding contracts were strongly call-heavy |
| Puts As Share Of Open Interest | 33.97% | Downside exposure remained smaller in the accumulated book |
| Put/Call Open-Interest Ratio | Approximately 0.51 | Roughly one put for every two calls |
| Calls As Share Of Daily Volume | 51.34% | Current call flow was only marginally larger |
| Puts As Share Of Daily Volume | 48.66% | Near-term hedging demand was substantial |
| Put/Call Volume Ratio | Approximately 0.95 | Recent trading was nearly balanced |
| Largest OI Concentrations | July 31 $72K Call; July 31 $70K Call; December 25 $80K Call | Upside strikes dominated the largest outstanding contracts |
| Most Active Contracts By Volume | July 31 $66K Call; July 31 $61K Put; August 7 $58K Put | Traders combined rebound exposure with lower-strike protection |
Options open interest does not reveal whether calls or puts were purchased or sold. It also does not determine the direction of dealer gamma without additional position data.
The difference between stock and flow matters.
A call-heavy open-interest book can reflect outright upside bets, call spreads, covered-call selling or structured products. Near-equal daily call and put volume shows that traders were not simply adding unhedged upside exposure.
They were protecting it.
The market entered the final two days before the July 31 expiry with substantial accumulated call exposure above spot and active put trading below it. That structure creates a wider range of potential hedging behavior.
If dealers were short the concentrated calls, a rally toward $66,000–$70,000 could require additional buying to maintain hedges. If dealers were long those calls through customer overwriting, the same area could generate selling that suppresses the move.
Public open-interest data cannot identify which scenario dominates.
Volatility Looked Cheap Until Protection Returned
At the beginning of the monitoring period, Block Scholes described short-dated BTC and ETH options skew as neutral after recovering from a bearish put premium earlier in July.
BTC one-month at-the-money implied volatility traded around 30%, close to its 2026 lows. Short-dated ETH implied volatility remained near 40%, also close to its year-to-date low.
The calm did not hold uniformly.
K33 reported that Bitcoin’s one-month 25-delta skew reached 6.28 on July 23, its lowest level in six months under K33’s convention, before returning to double digits after BTC pulled back. The shift showed that downside protection became more expensive again as spot weakened.
This was a repricing of distribution risk, not necessarily a forecast of a sustained decline.
Bitcoin’s realized volatility remained at 36.21% over three months, above the roughly 30% short-dated implied-volatility level reported at the beginning of the period. Ether’s realized volatility stood at 51.64%, above the roughly 40% short-dated implied level cited by Block Scholes.
The horizons and calculation methods are not identical, so the figures should not be treated as a direct arbitrage signal. They do show that short-dated options entered the week pricing less movement than the assets had recently realized.
That made protection vulnerable to rapid repricing when BTC approached its weekly low.
Long Liquidations Revealed Hidden Fragility
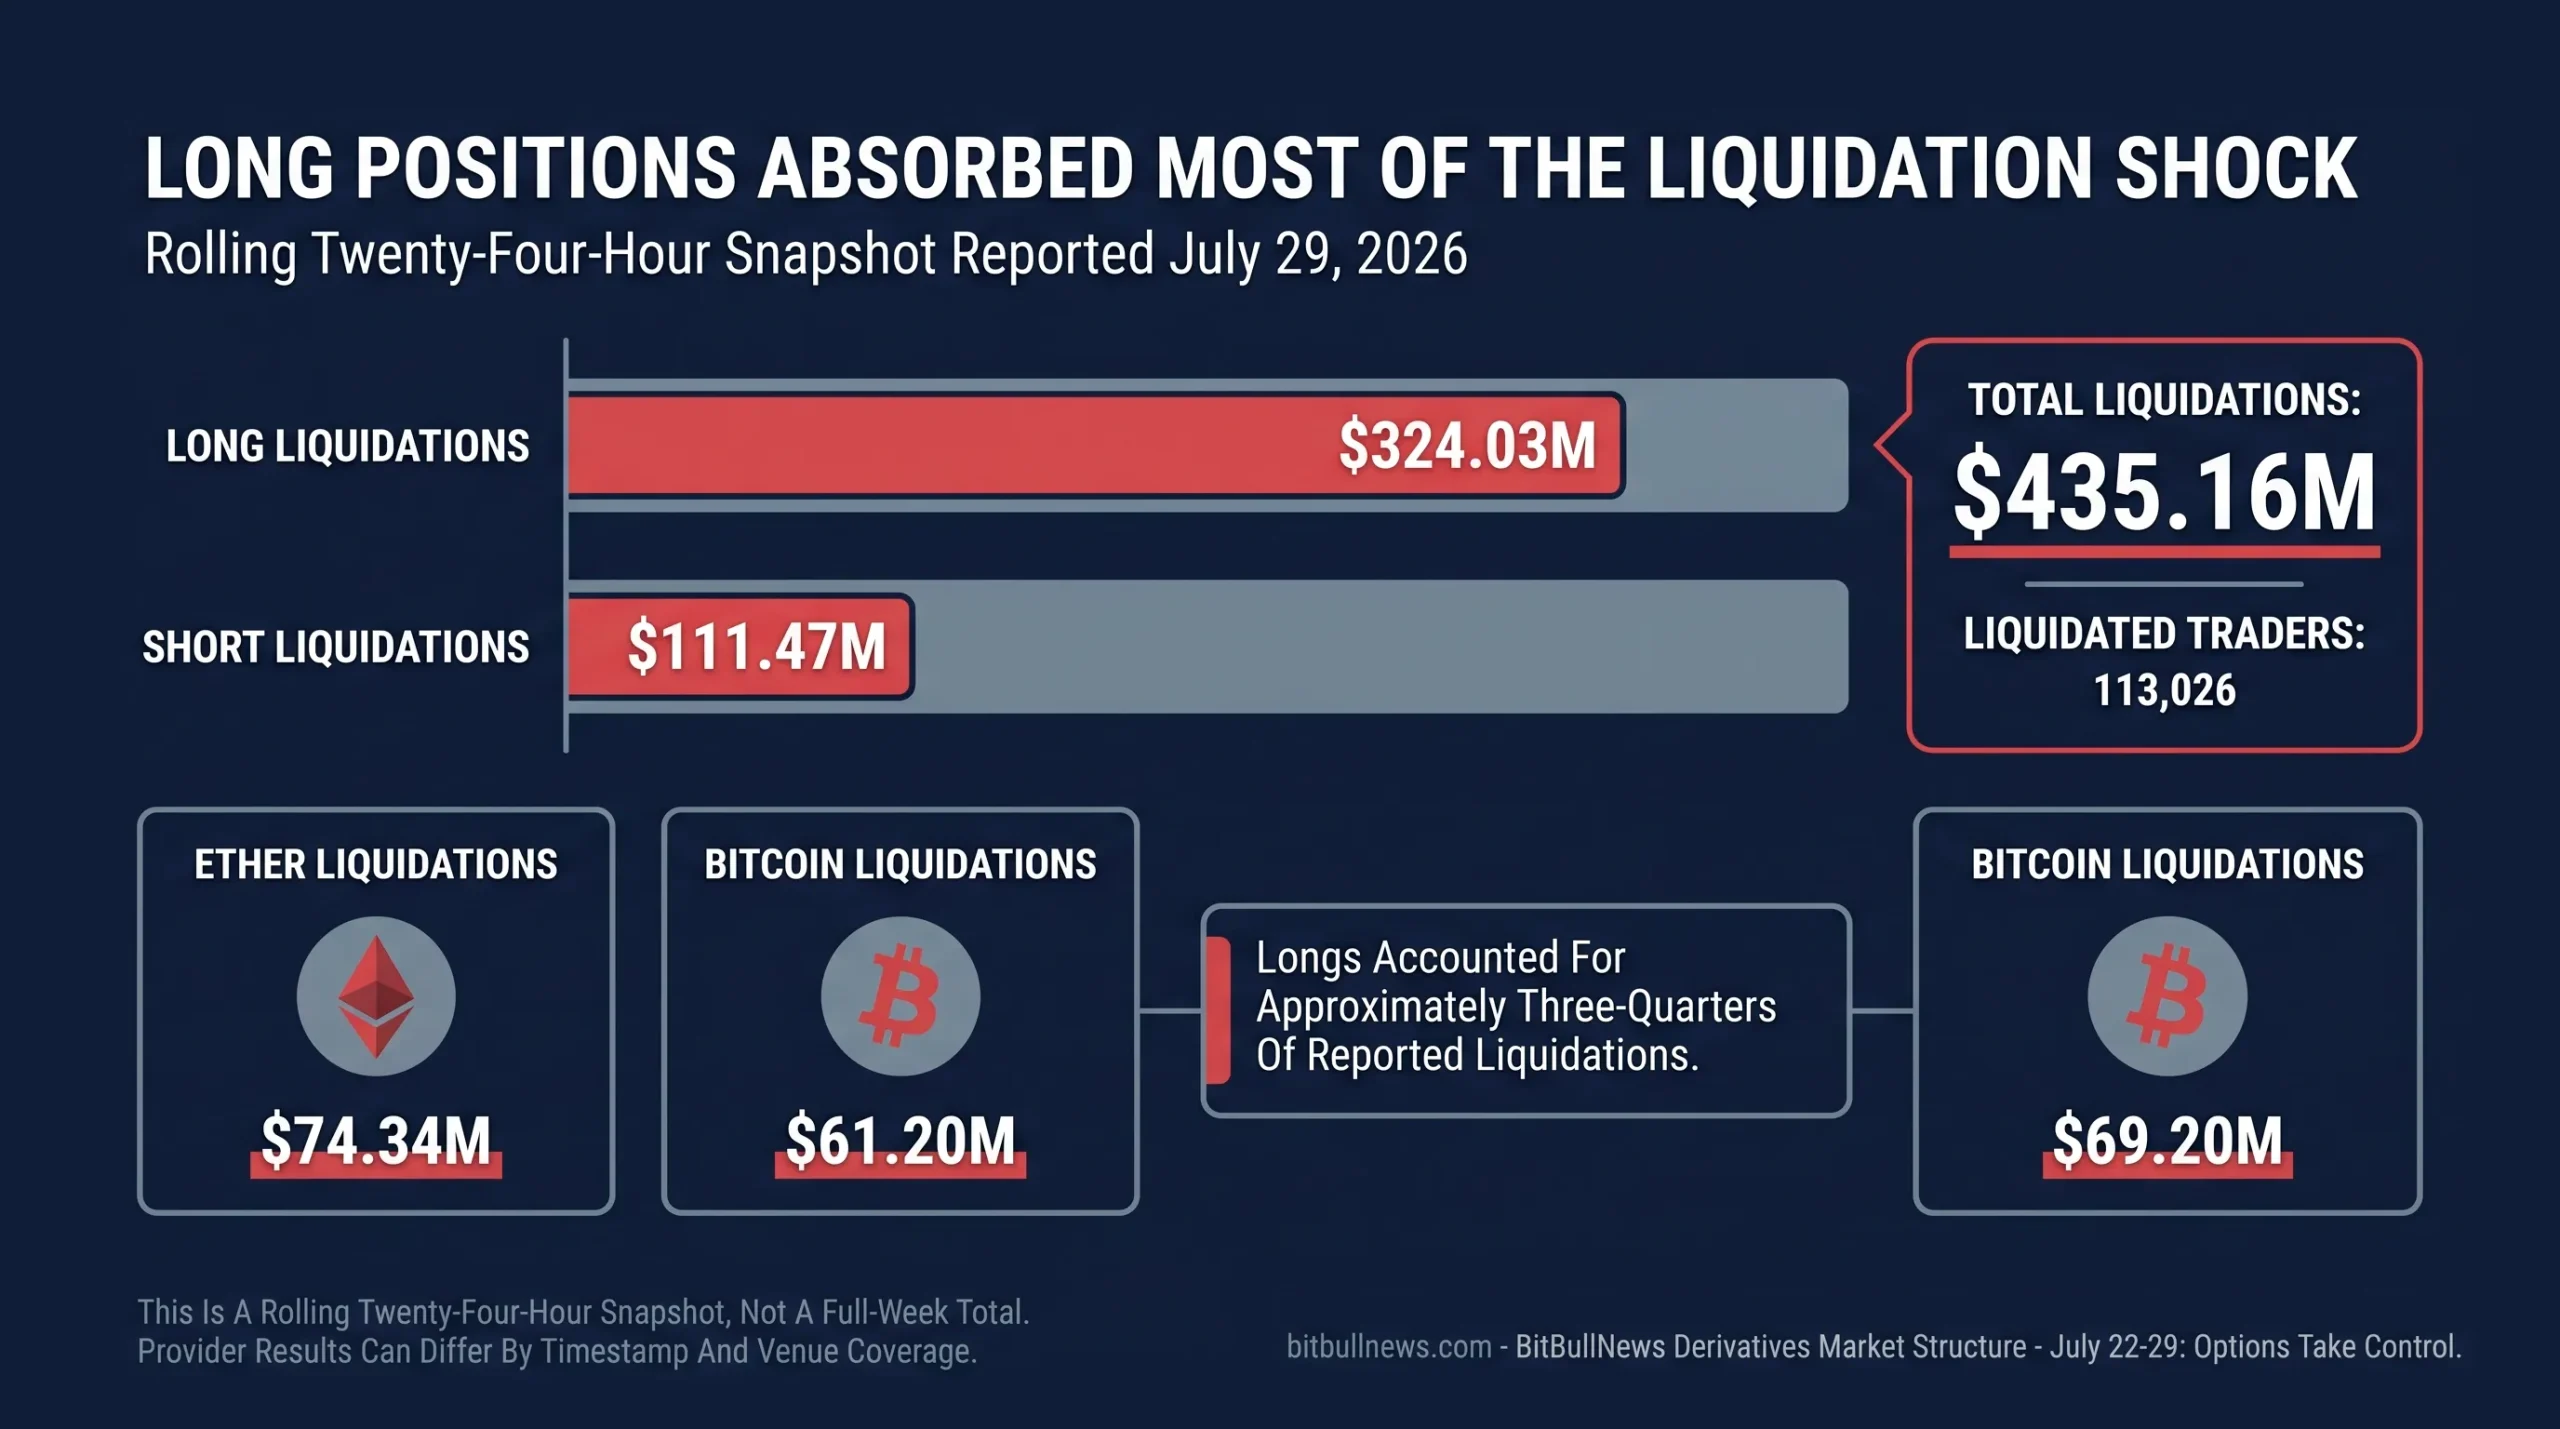
A July 29 CoinGlass snapshot reported $435.16 million of liquidations across 113,026 traders during the preceding 24 hours.
Long positions accounted for $324.03 million. Shorts accounted for $111.47 million. Ether produced the largest asset-level liquidation total at $74.34 million, followed by Bitcoin at $61.20 million.
Twenty-Four-Hour Liquidation Snapshot
| Liquidation Metric | Reported Value | Interpretation |
|---|---|---|
| Total Liquidations | $435.16M | Material forced deleveraging across the broader crypto market |
| Liquidated Traders | 113,026 | Stress was distributed across a large number of accounts |
| Long Liquidations | $324.03M | Longs absorbed roughly three-quarters of the reported losses |
| Short Liquidations | $111.47M | Short covering remained meaningful but secondary |
| Ether Liquidations | $74.34M | ETH produced the largest asset-level total |
| Bitcoin Liquidations | $61.20M | BTC remained a major source of forced position closure |
The values represent a rolling 24-hour CoinGlass snapshot reported at 07:00 EDT on July 29, not cumulative liquidations for the full monitoring period. Provider totals can differ by timestamp, venue coverage and contract classification.
The liquidation total was large relative to the period’s flat Bitcoin close.
That is not a contradiction. Intraday declines can eliminate leveraged positions even when the asset later recovers. A market can finish unchanged after inflicting substantial losses on traders whose liquidation thresholds were crossed along the way.
The long-heavy split confirms that leverage remained vulnerable despite moderate aggregate funding and declining Bitcoin open interest. Stress was concentrated in individual positions rather than visible as an unchecked market-wide buildup.
Ether’s larger liquidation total also fits its higher-volatility profile. ETH outperformed over the full period, but the path included enough downside movement to remove overextended longs.
The Federal Reserve Added Event Risk Without Resolving Direction
The Federal Reserve kept its policy-rate target at 3.50%–3.75% on July 29.
The decision passed by a 9–3 vote. Beth Hammack, Neel Kashkari and Lorie Logan dissented in favor of a 25-basis-point increase. The unusually hawkish dissent structure kept rate uncertainty alive even though the committee left the target range unchanged.
Bitcoin closed July 29 at $64,754.98 after touching $63,209.66 during the session. Ether closed at $1,922.33 after trading as low as $1,873.60. The assets recovered into the New York close, but the daily data does not isolate the Fed decision as the sole cause. Crypto trades continuously and responds to several liquidity, geopolitical and positioning inputs at once.
The macro significance lies in timing.
The rate decision arrived while:
- Bitcoin spot volume was unusually weak.
- BTC ETFs were net sellers over the period.
- Options open interest was expanding.
- July 31 call strikes were concentrated above spot.
- Short-dated put activity was rising.
- Leveraged funds remained net short on CME.
A macro surprise inside that structure could produce a larger price response than the underlying spot market would otherwise generate.
What Traders Should Watch Next
Whether Bitcoin Rebuilds Open Interest Above $65,000
A price recovery accompanied by moderate open-interest growth would show that traders are rebuilding exposure after the latest deleveraging.
A rapid open-interest expansion with weak spot volume and continued ETF redemptions would create a less stable rally.
Whether ETF Demand Returns
Bitcoin ETFs lost $425.3 million during the monitoring period.
The July 29 inflow was constructive but too small to reverse the weekly result. Sustained creations would give the market a stronger source of spot demand. Renewed IBIT and FBTC redemptions would leave price more dependent on offshore liquidity and derivatives positioning.
How July 31 Options Exposure Rolls
The largest outstanding contracts included the $70,000 and $72,000 July 31 calls.
Traders should monitor whether those positions expire, close or migrate into August and September maturities. A large roll would preserve options-market exposure even if headline open interest falls temporarily around expiry.
Whether Put Demand Remains Elevated
Call-heavy open interest coexisted with nearly balanced daily options volume.
If puts continue taking close to half of turnover after the expiry, the market is maintaining downside protection rather than merely hedging a single event.
Whether CME Bitcoin Shorts Cover
Leveraged funds increased their net short in standard Bitcoin futures to 7,949 contracts through July 21.
A higher BTC price with continued short growth would increase squeeze potential. Lower prices without short covering would suggest those positions are working as intended or remain part of broader hedged trades.
Whether Ether’s Relative Strength Gains Spot Confirmation
ETH gained 2.55% while U.S. Ether ETFs added only $16.5 million.
The next confirmation would be broader spot and ETF participation. A continuation driven mainly by futures or options would carry more reversal risk.
Whether Funding Remains Controlled
Bitcoin funding was positive but generally moderate.
A sudden increase in funding while spot volume remains weak would show that leveraged longs are beginning to chase a market that lacks equivalent underlying demand.
Derivatives Risk Dashboard
| Signal | Current Reading | Interpretation | Confirmation Needed |
|---|---|---|---|
| BTC Period Return | -0.08% | Closing price concealed a wide intraperiod range | Break and hold outside the $63K–$66K zone |
| ETH Period Return | +2.55% | Ether regained the relative-performance lead | Broader spot and ETF participation |
| BTC Three-Month Volatility | 36.21% | Realized movement remained material | Short-dated implied volatility reprices sustainably |
| ETH Three-Month Volatility | 51.64% | ETH remained the higher-beta asset | Return remains sufficient to compensate for risk |
| BTC ETF Flow | -$425.3M | Regulated spot demand reversed sharply | Multi-session return to net creations |
| ETH ETF Flow | +$16.5M | Marginally positive but not enough to explain the rally alone | Broader issuer participation |
| Bitcoin Spot Volume | $2.2B Daily July Average | Lowest monthly pace since November 2023 | Volume expansion on a directional breakout |
| Bitcoin Linear OI | $32.1B, -2.1% Weekly | Futures and perpetual leverage cooled | Healthy rebuilding alongside spot demand |
| Bitcoin Basis | Below 5% Annualized | Institutional carry demand remained restrained | Basis rises without excessive leverage |
| Bitcoin Funding | Mostly 5%–7% Annualized | Positive but not crowded | Funding stays controlled near resistance |
| BTC Options OI | $34.13B | Options held the larger visible risk concentration | Orderly post-expiry roll or reduction |
| Call Share Of BTC OI | 66.03% | Outstanding book leaned toward upside | Strike exposure remains balanced after expiry |
| Put Share Of BTC Volume | 48.66% | Current flow showed substantial hedging | Put demand normalizes without a volatility shock |
| CME BTC Leveraged Funds | Net Short 7,949 Contracts | Short base can amplify an upside break | Next CFTC report shows covering or continued buildup |
| CME ETH Leveraged Funds | Net Short 7,053 Contracts | Bearish imbalance narrowed during the latest report | Continued covering with spot confirmation |
| Twenty-Four-Hour Liquidations | $435.16M | Intraday volatility removed substantial leverage | Forced selling remains contained after expiry |
| Long Share Of Liquidations | Approximately Three-Quarters | Overextended long positions carried the immediate risk | Funding and open interest remain moderate |
| Federal Funds Rate | 3.50%–3.75% | Fed held rates with three hawkish dissents | Inflation and rate expectations stabilize |
The Quiet Shift: From Linear Leverage to Concentrated Optionality
Bitcoin’s flat weekly return hid a major shift in derivatives risk.
The linear market cooled. Combined Bitcoin futures and perpetual open interest fell 2.1% to $32.1 billion. Funding largely remained between 5% and 7% annualized, the CME basis slipped below 5% and spot volume moved toward its weakest monthly average since late 2023.
Bitcoin ETF demand also reversed. U.S. funds lost $425.3 million, with IBIT accounting for most of the decline.
Options moved in the opposite direction.
Bitcoin options open interest climbed to $34.13 billion. Calls represented two-thirds of outstanding exposure, but daily trading volume was almost evenly split between calls and puts. The existing book was positioned toward upside strikes. New flow was buying or trading substantial downside protection.
That is not a complacent bullish market. It is a market trying to retain upside while controlling expiry and macro risk.
Ether delivered the stronger result. ETH gained 2.55% and outperformed Bitcoin by 2.62 percentage points, even though Ether ETFs attracted only $16.5 million. CME leveraged funds reduced their ETH net short, while Bitcoin leveraged funds increased theirs.
The week ended with $435.16 million in reported 24-hour liquidations, roughly three-quarters of them longs. That stress occurred despite Bitcoin finishing close to its starting price.
The market did not carry excessive linear leverage into July 29. It carried concentrated optionality, weak spot depth and conflicting institutional positioning.
The next move will depend less on headline open interest than on what happens after the July 31 expiry: whether call exposure rolls forward, whether puts remain active, whether ETF demand returns and whether new futures leverage is supported by genuine spot participation.
Data Sources & References
- Coin Metrics — CMBI Bitcoin Benchmark
- Coin Metrics — CMBI Ethereum Benchmark
- K33 Research — Ahead Of The Curve
- The Block — K33 July Spot And Derivatives Summary
- Farside Investors — Bitcoin ETF Flows
- Farside Investors — Ethereum ETF Flows
- CFTC — Traders In Financial Futures Report
- Deribit Insights — Crypto Derivatives Analytics Report, Week 30
- TokenPost — CoinGlass Bitcoin Options Snapshot
- AMBCrypto — CoinGlass Liquidation Snapshot
- Federal Reserve — July 29 FOMC Statement