


The biggest structural shift in crypto right now is not that everything is growing together. It is that growth has become highly selective.
Across the on-chain economy covered in the uploaded report, stablecoins and derivatives are expanding faster than DeFi TVL, while RWA has grown large enough to function as a distinct macro segment. At the same time, security losses remain a real tax on adoption, and consumer sectors such as GameFi and NFTs still show activity but weaker monetization quality than in prior cycles. The result is a market that is no longer driven by one unified “crypto bull market” narrative. It is being pulled by a few infrastructure-heavy segments and held back by fragmentation, compliance, and security drag.
The clearest numbers in the report make that divergence hard to ignore. As of 2026-03-24, USD-pegged stablecoin circulating value stood at about $314.7B, up roughly 35.0% YoY. DeFi TVL, by contrast, was about $170.4B, down roughly 1.7% YoY. On-chain perpetuals were running at about $35.15B in 24-hour notional and $694.5B in 30-day notional, while the same source implies roughly $7.92T in total 2025 on-chain perps volume and $2.29T YTD in 2026. RWA dashboards showed about $26.44B in distributed on-chain value, $370.41B in represented asset value, and roughly 690,086 asset holders. Those are not random sector statistics. Together, they describe a market where trading, settlement, and tokenized cash-like instruments are gaining ground faster than traditional “lock capital in DeFi” models.
The practical read is simple. The crypto market has moved into a selective maturity phase. Stablecoins, on-chain derivatives, and tokenized real-world assets are the strongest growth engines. DeFi remains large, but its growth is now constrained by exploit risk and by the fact that capital increasingly prefers liquid, yield-bearing, and settlement-oriented structures over static collateral pools. GameFi and NFTs are not dead, but they are no longer the center of gravity. Token sales still exist, but the market structure has shifted toward private rounds, structured fundraising, and compliance-routed distribution.
Market Structure Snapshot
| Sector | Primary metric used here | Latest observed value | Growth signal | Direction |
|---|---|---|---|---|
| Token sales | Web3 VC deal-count proxy | 1,179 deals in 2025 | -29.6% YoY | Structurally weaker / more private |
| DeFi | TVL | $170.4B | -1.7% YoY | Flat to slightly down |
| GameFi | Daily unique active wallets | 4.66M in Q3 2025 | -4.4% QoQ | Activity high, momentum softer |
| NFTs | Trading volume / sales | $1.6B volume; 18.1M sold in Q3 2025 | Higher unit count, lower average value | Active, lower monetization density |
| Stablecoins | USD-pegged circulating value | $314.7B | +35.0% YoY | Strong growth |
| RWA | Distributed on-chain value | $26.44B | +5.11% vs 30d | Strong growth |
| Derivatives | On-chain perp notional | $35.15B (24h), $694.5B (30d) | +201.46% (1m) | Very strong growth |
| Emerging sectors | Narrative/category tracking | AI, AI Agents, DePIN, Rollup, DID, RWA | Not a single metric | Early but expanding |
This table makes the cycle easy to read. The best-performing parts of crypto in 2026 are not the sectors most associated with the 2020–2021 retail mania. They are the sectors most closely tied to liquidity, trading throughput, tokenized cash, and institutional-grade market structure.
Token Sales: ICO, IEO, IDO, and the Move Away From Mass Retail
The first thing to say clearly is that the open-data market still does not provide a clean, audited, global time series for ICO, IEO, and IDO issuance volumes. That is not a side note. It is one of the most important methodological realities in this space. The report explicitly treats token sales through structure proxies rather than pretending to have a full issuance ledger.
What the data does show is a structural shift away from the old mass-retail token-sale model. A 2025 fundraising recap cited in the report recorded 1,179 Web3 VC deals in 2025, down 29.6% YoY, with deal activity still 2–3x lower than in 2021–2022. That is not an ICO chart, but it is a very strong indicator of how the primary market has changed: more private, more structured, more intermediated, and less dependent on unrestricted global retail distribution.
The regulatory piece matters here too. In the EU, MiCA entered into force in June 2023, with ART/EMT stablecoin provisions applying from 2024-06-30 and CASP provisions from 2024-12-30. That means the infrastructure around token distribution now sits inside a much more explicit authorization regime. In practice, that pushes IEO-style mechanics closer to regulated distribution and makes fully open, borderless token sales harder to sustain at scale.
Token sales are not “back.” The launch market is alive, but it has changed shape. The center of gravity is moving toward private rounds, region-gated public access, points systems, community distributions, and compliance-managed venue launches, not classic 2017-style open ICOs. That is a structural downgrade in openness, but arguably an upgrade in survivability.
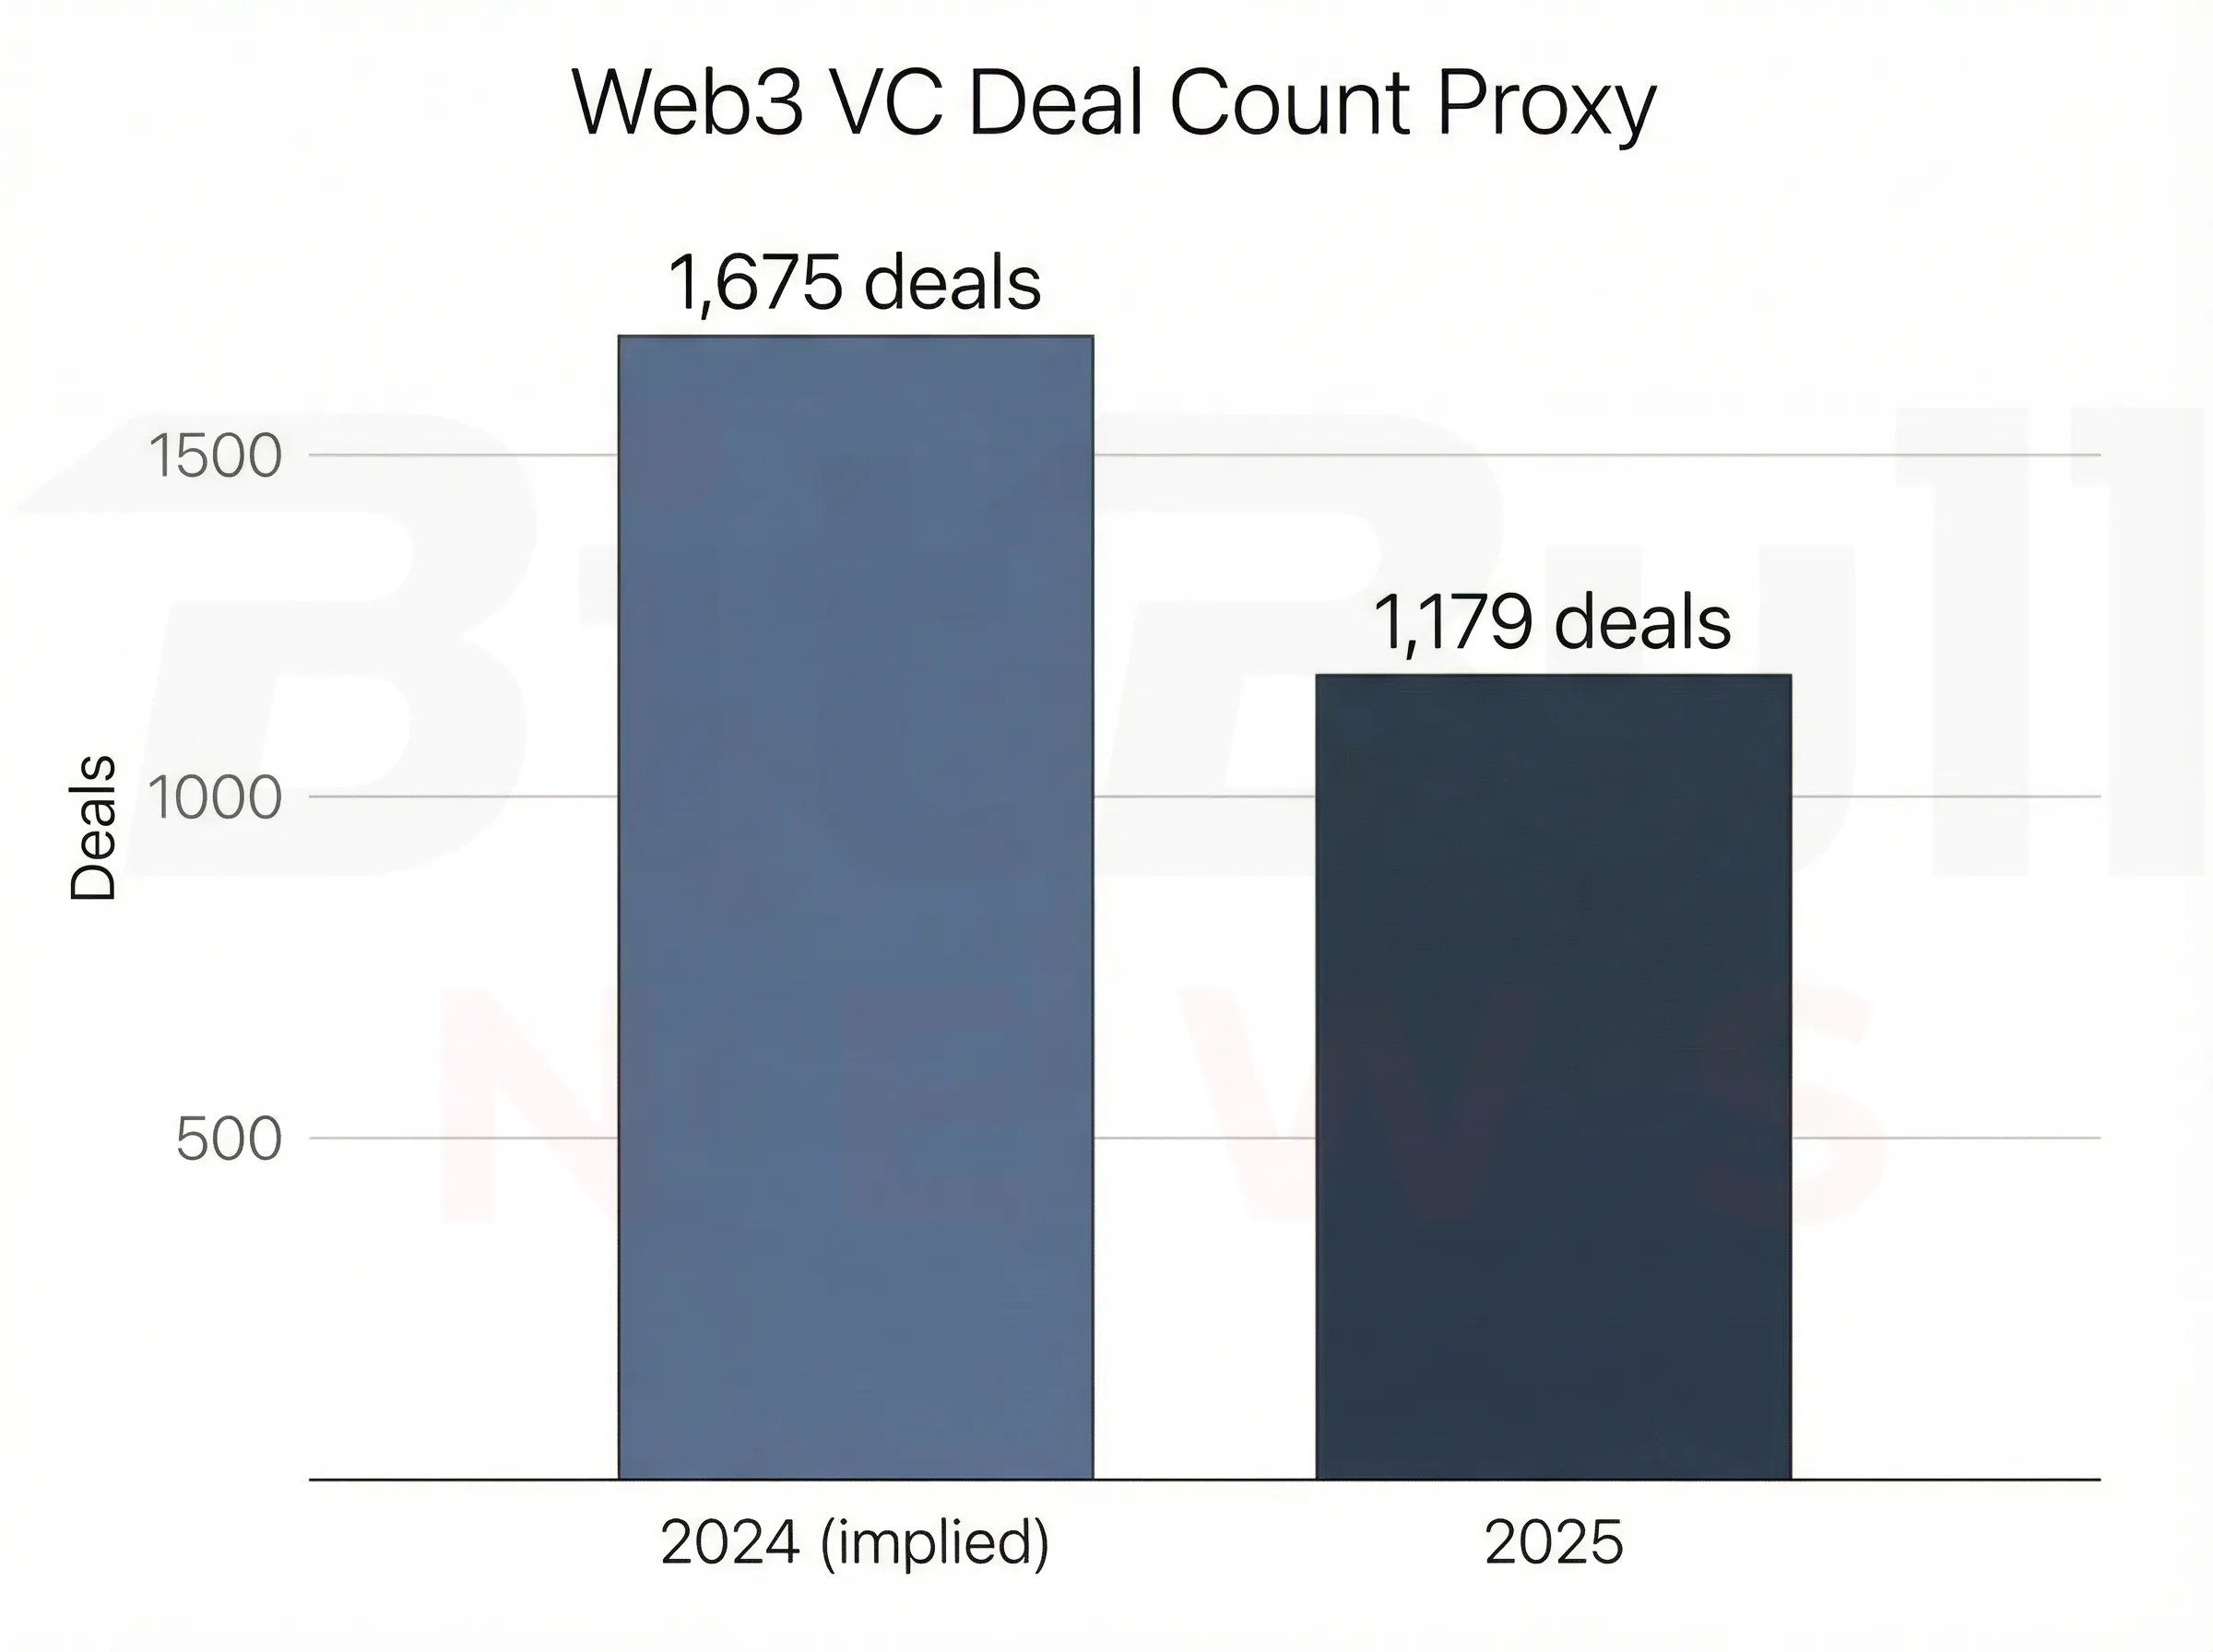
Chart 1: Web3 VC deal count proxy
DeFi: Large, Still Important, but No Longer the Fastest-Growing Core
DeFi is not collapsing. But it is no longer the cleanest growth story in crypto.
The report’s TVL series shows DeFi rising from almost nothing in 2017–2019 to about $220.09B at the 2021 year-end peak, then falling sharply in 2022, rebounding through 2023–2024, and standing at about $170.36B YTD in 2026. On a YoY basis, that is roughly -1.7%, which is better described as plateaued than booming.
The more important point is not just the level of TVL. It is the divergence between TVL and the rest of the on-chain economy. Stablecoin supply is growing quickly. On-chain perps are growing even faster. But TVL is flat to slightly down. That suggests capital is increasingly preferring trading, settlement, and cash-like yield instruments over pure lock-up models. In earlier cycles, TVL itself was the growth story. In this cycle, TVL is more a measure of the sector’s installed base than its strongest forward engine.
The second major issue is security. The report’s exploit dataset attributes about $7.103B of historical losses to “DeFi Protocol” targets and roughly $2.905B to bridge hacks. The trailing 12 months to 2026-03-24 show about $725M lost in DeFi protocol incidents, up roughly 55% YoY. That means DeFi has not yet solved the one problem that matters most to serious capital: reliable reduction of catastrophic loss frequency.
Selected large DeFi / bridge incidents highlighted in the report
| Date | Event | Approx. loss |
|---|---|---|
| 2021-08-10 | Poly Network | ~$611M |
| 2022-02-02 | Portal | ~$326M |
| 2022-03-23 | Ronin Bridge | ~$624M |
| 2022-10-06 | Binance Bridge | ~$570M |
| 2023-03-13 | Euler V1 | ~$197M |
| 2025-05-22 | Cetus CLMM | ~$223M |
DeFi remains essential infrastructure, but the market has become less willing to pay a premium multiple for TVL alone. The next leg depends on whether DeFi can convert from “capital locked” to cash-flow-generating financial rails, while also reducing exploit severity enough to make large allocators trust it more than they do today.
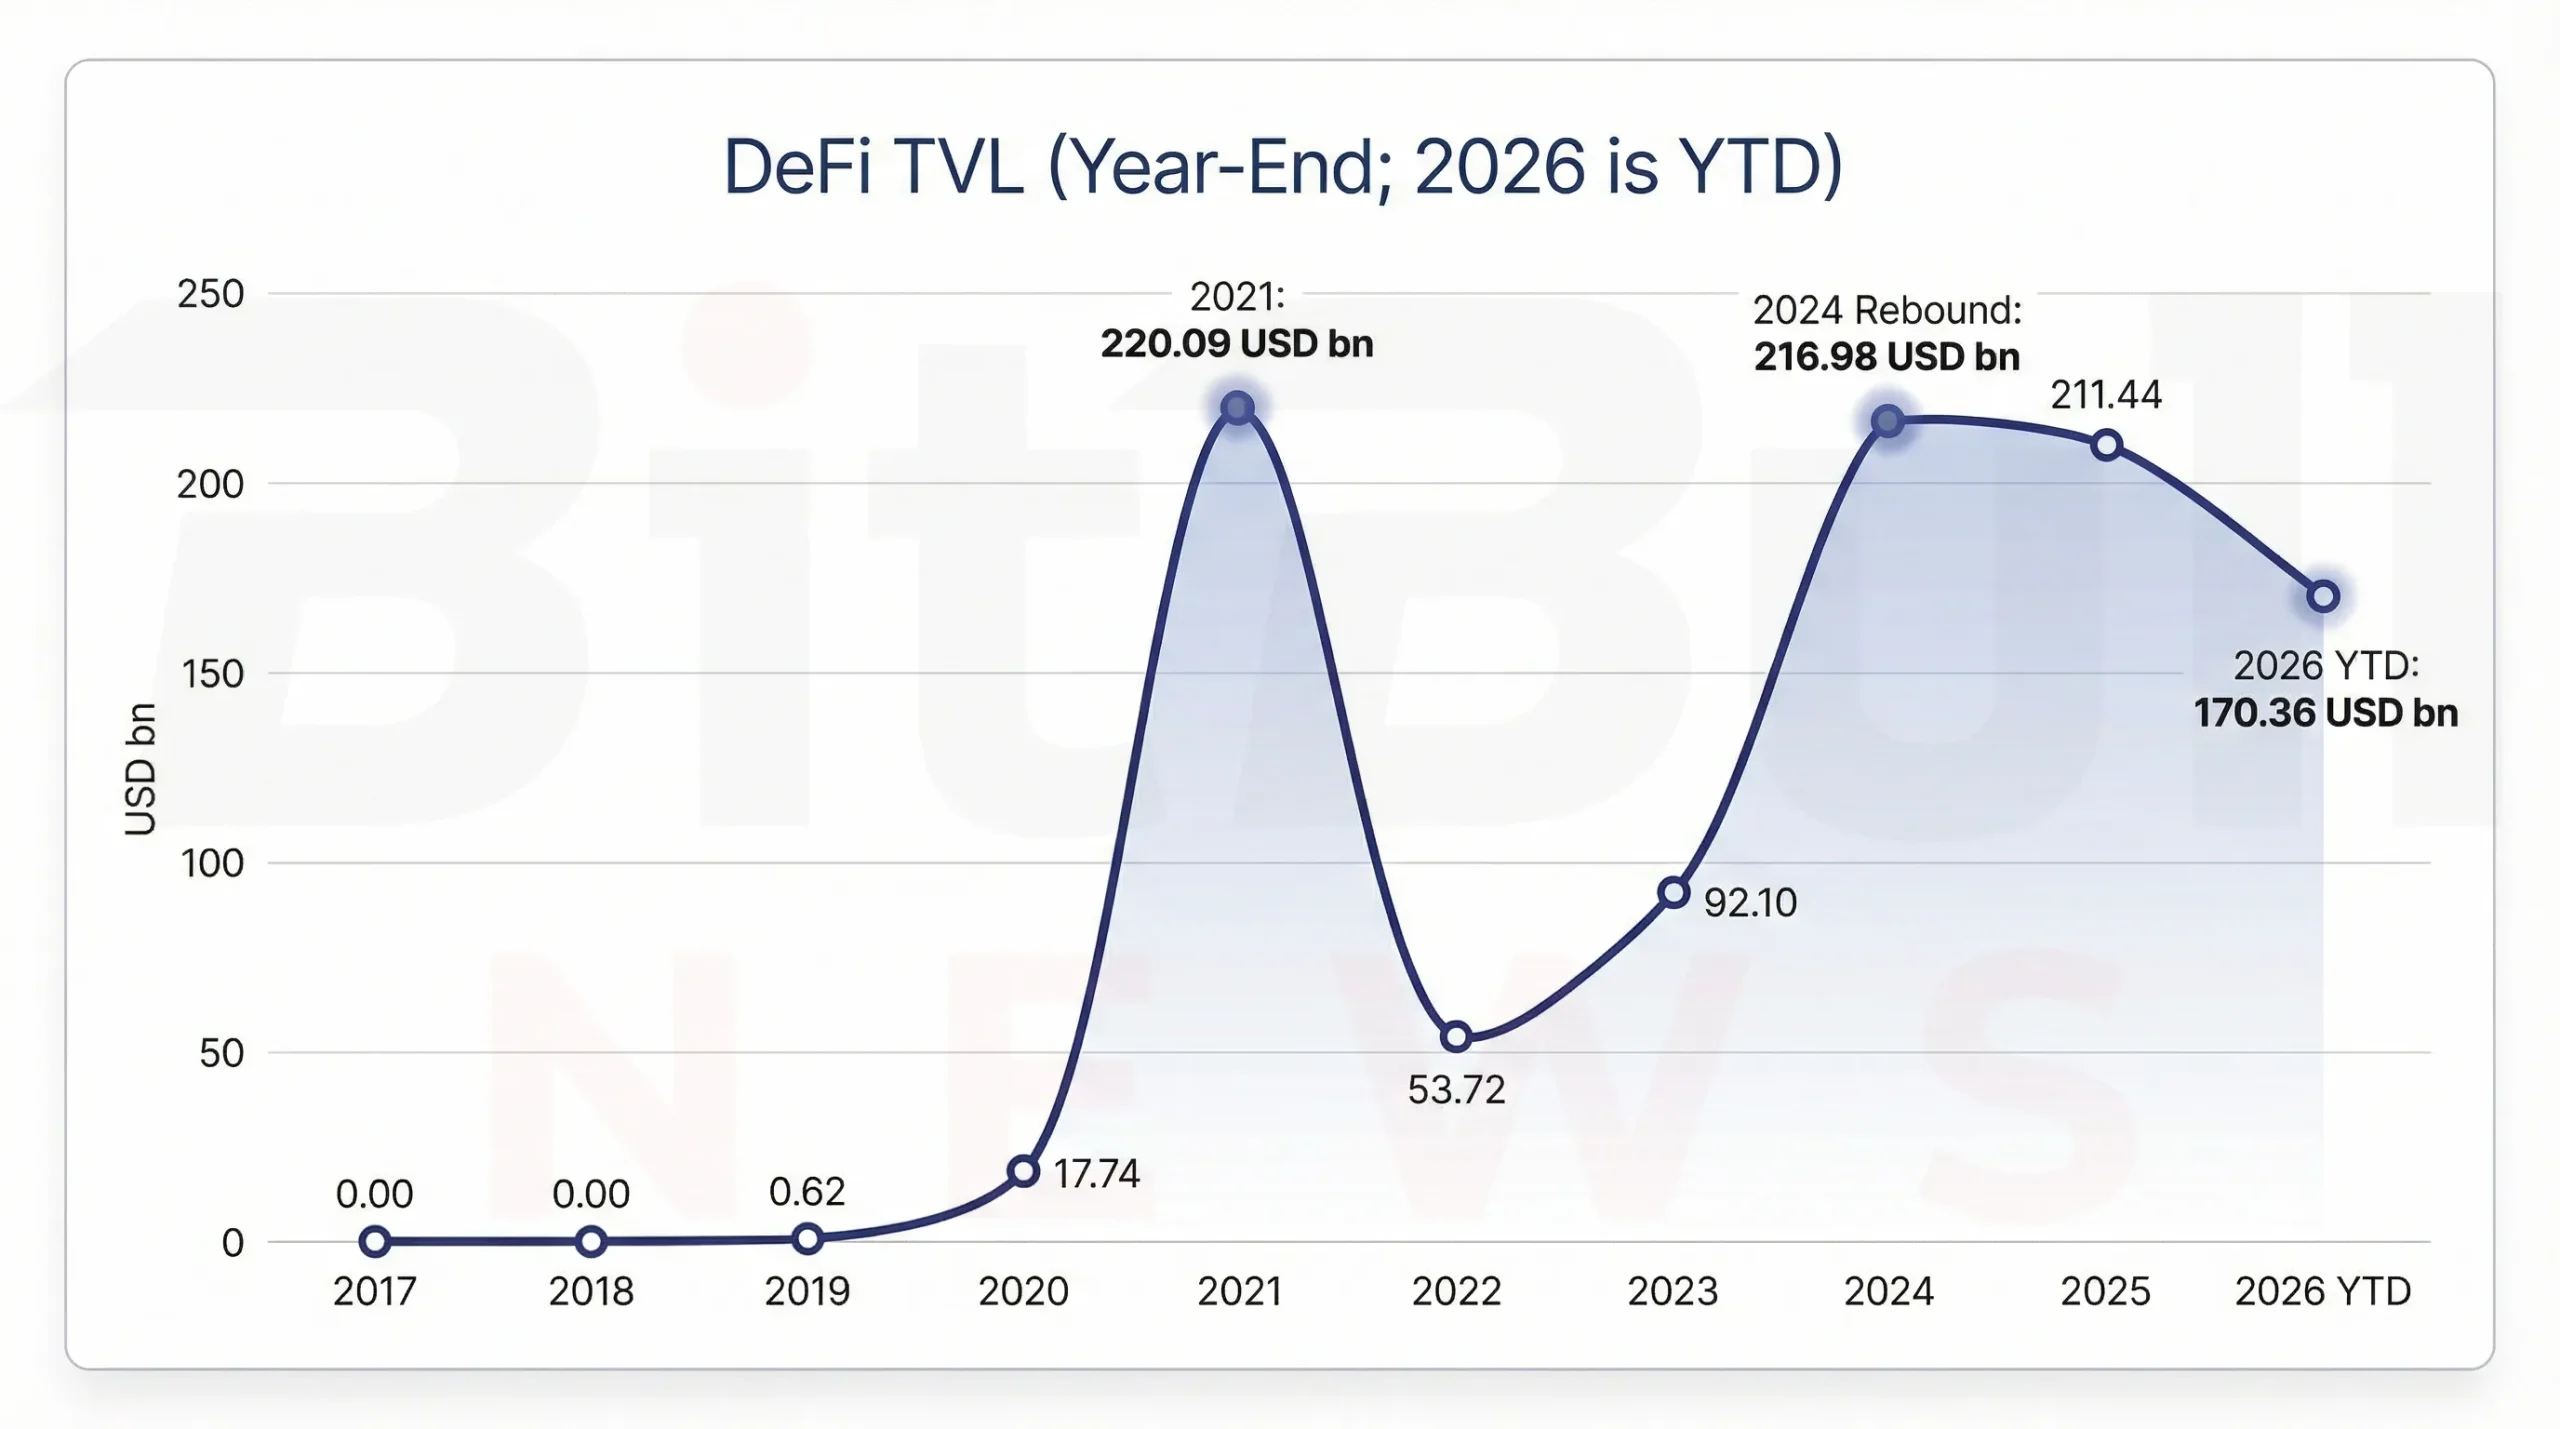
Chart 2: DeFi TVL (year-end; 2026 is YTD)
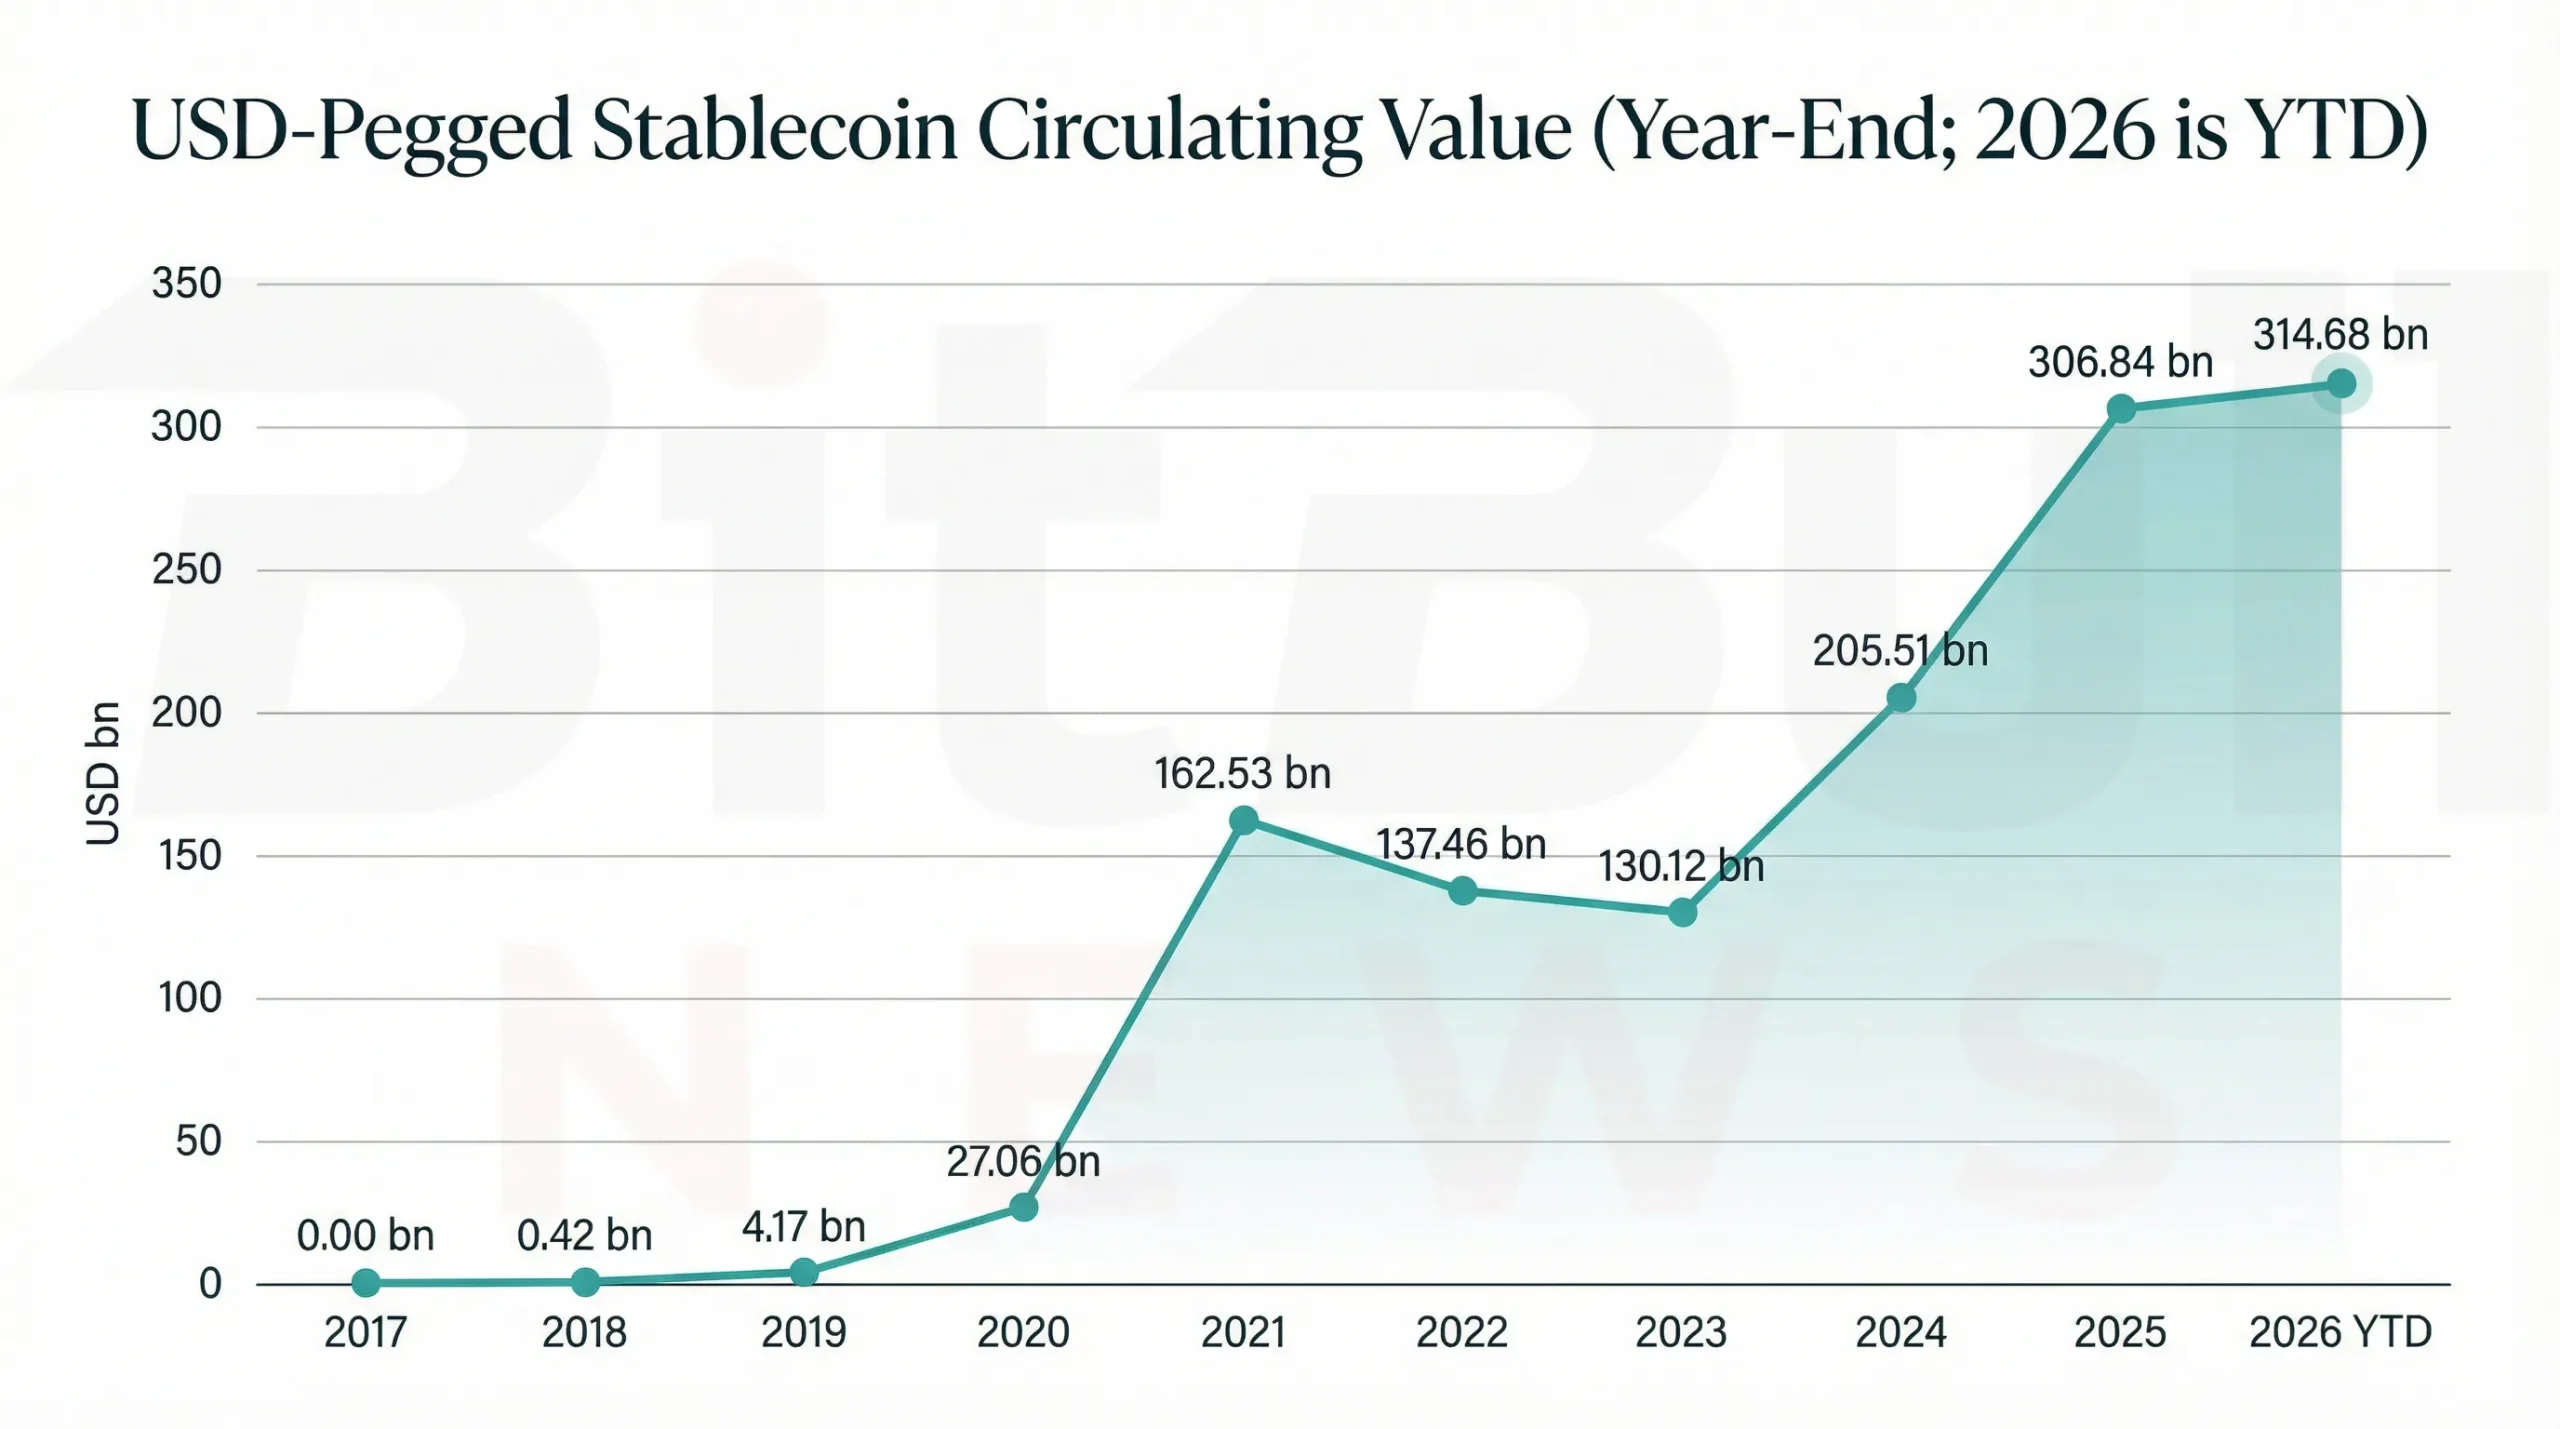
Chart 3: DeFi protocol exploits: yearly value lost
GameFi: Activity Is Still Real, but the Sector Has Not Reproven Its Economic Model
The GameFi sector remains much more active than many people assume. The report cites 4.66M daily unique active wallets in blockchain gaming in Q3 2025, which is not a trivial number by any standard. But that figure was still down 4.4% QoQ, and the sector remains heavily concentrated in a few chains and incumbents. The same report noted that opBNB led gaming activity in Q3 2025 with about 1.05M active wallets, while Kaia grew 229%, and WAX logged 687M transactions despite what the source itself described as a lack of new gaming products.
That is the central contradiction in GameFi. Usage is still there. But the sector has not yet fully proved that it can convert usage into sustainable economic value without leaning heavily on incentives, emissions, or chain-specific user loops. The report is honest about this: there is no standardized, open, sector-wide tokenomic P&L in the accessible dataset. So the right interpretation is not “GameFi failed.” It is “GameFi stayed active, but the monetization question remains unresolved.”
GameFi has passed the “is anyone using this?” test, but not yet the “does this scale economically without subsidy?” test. The next winners will likely be titles that can sustain engagement with better gameplay, better identity loops, and stronger retention mechanics than pure play-to-earn systems delivered in the last cycle.
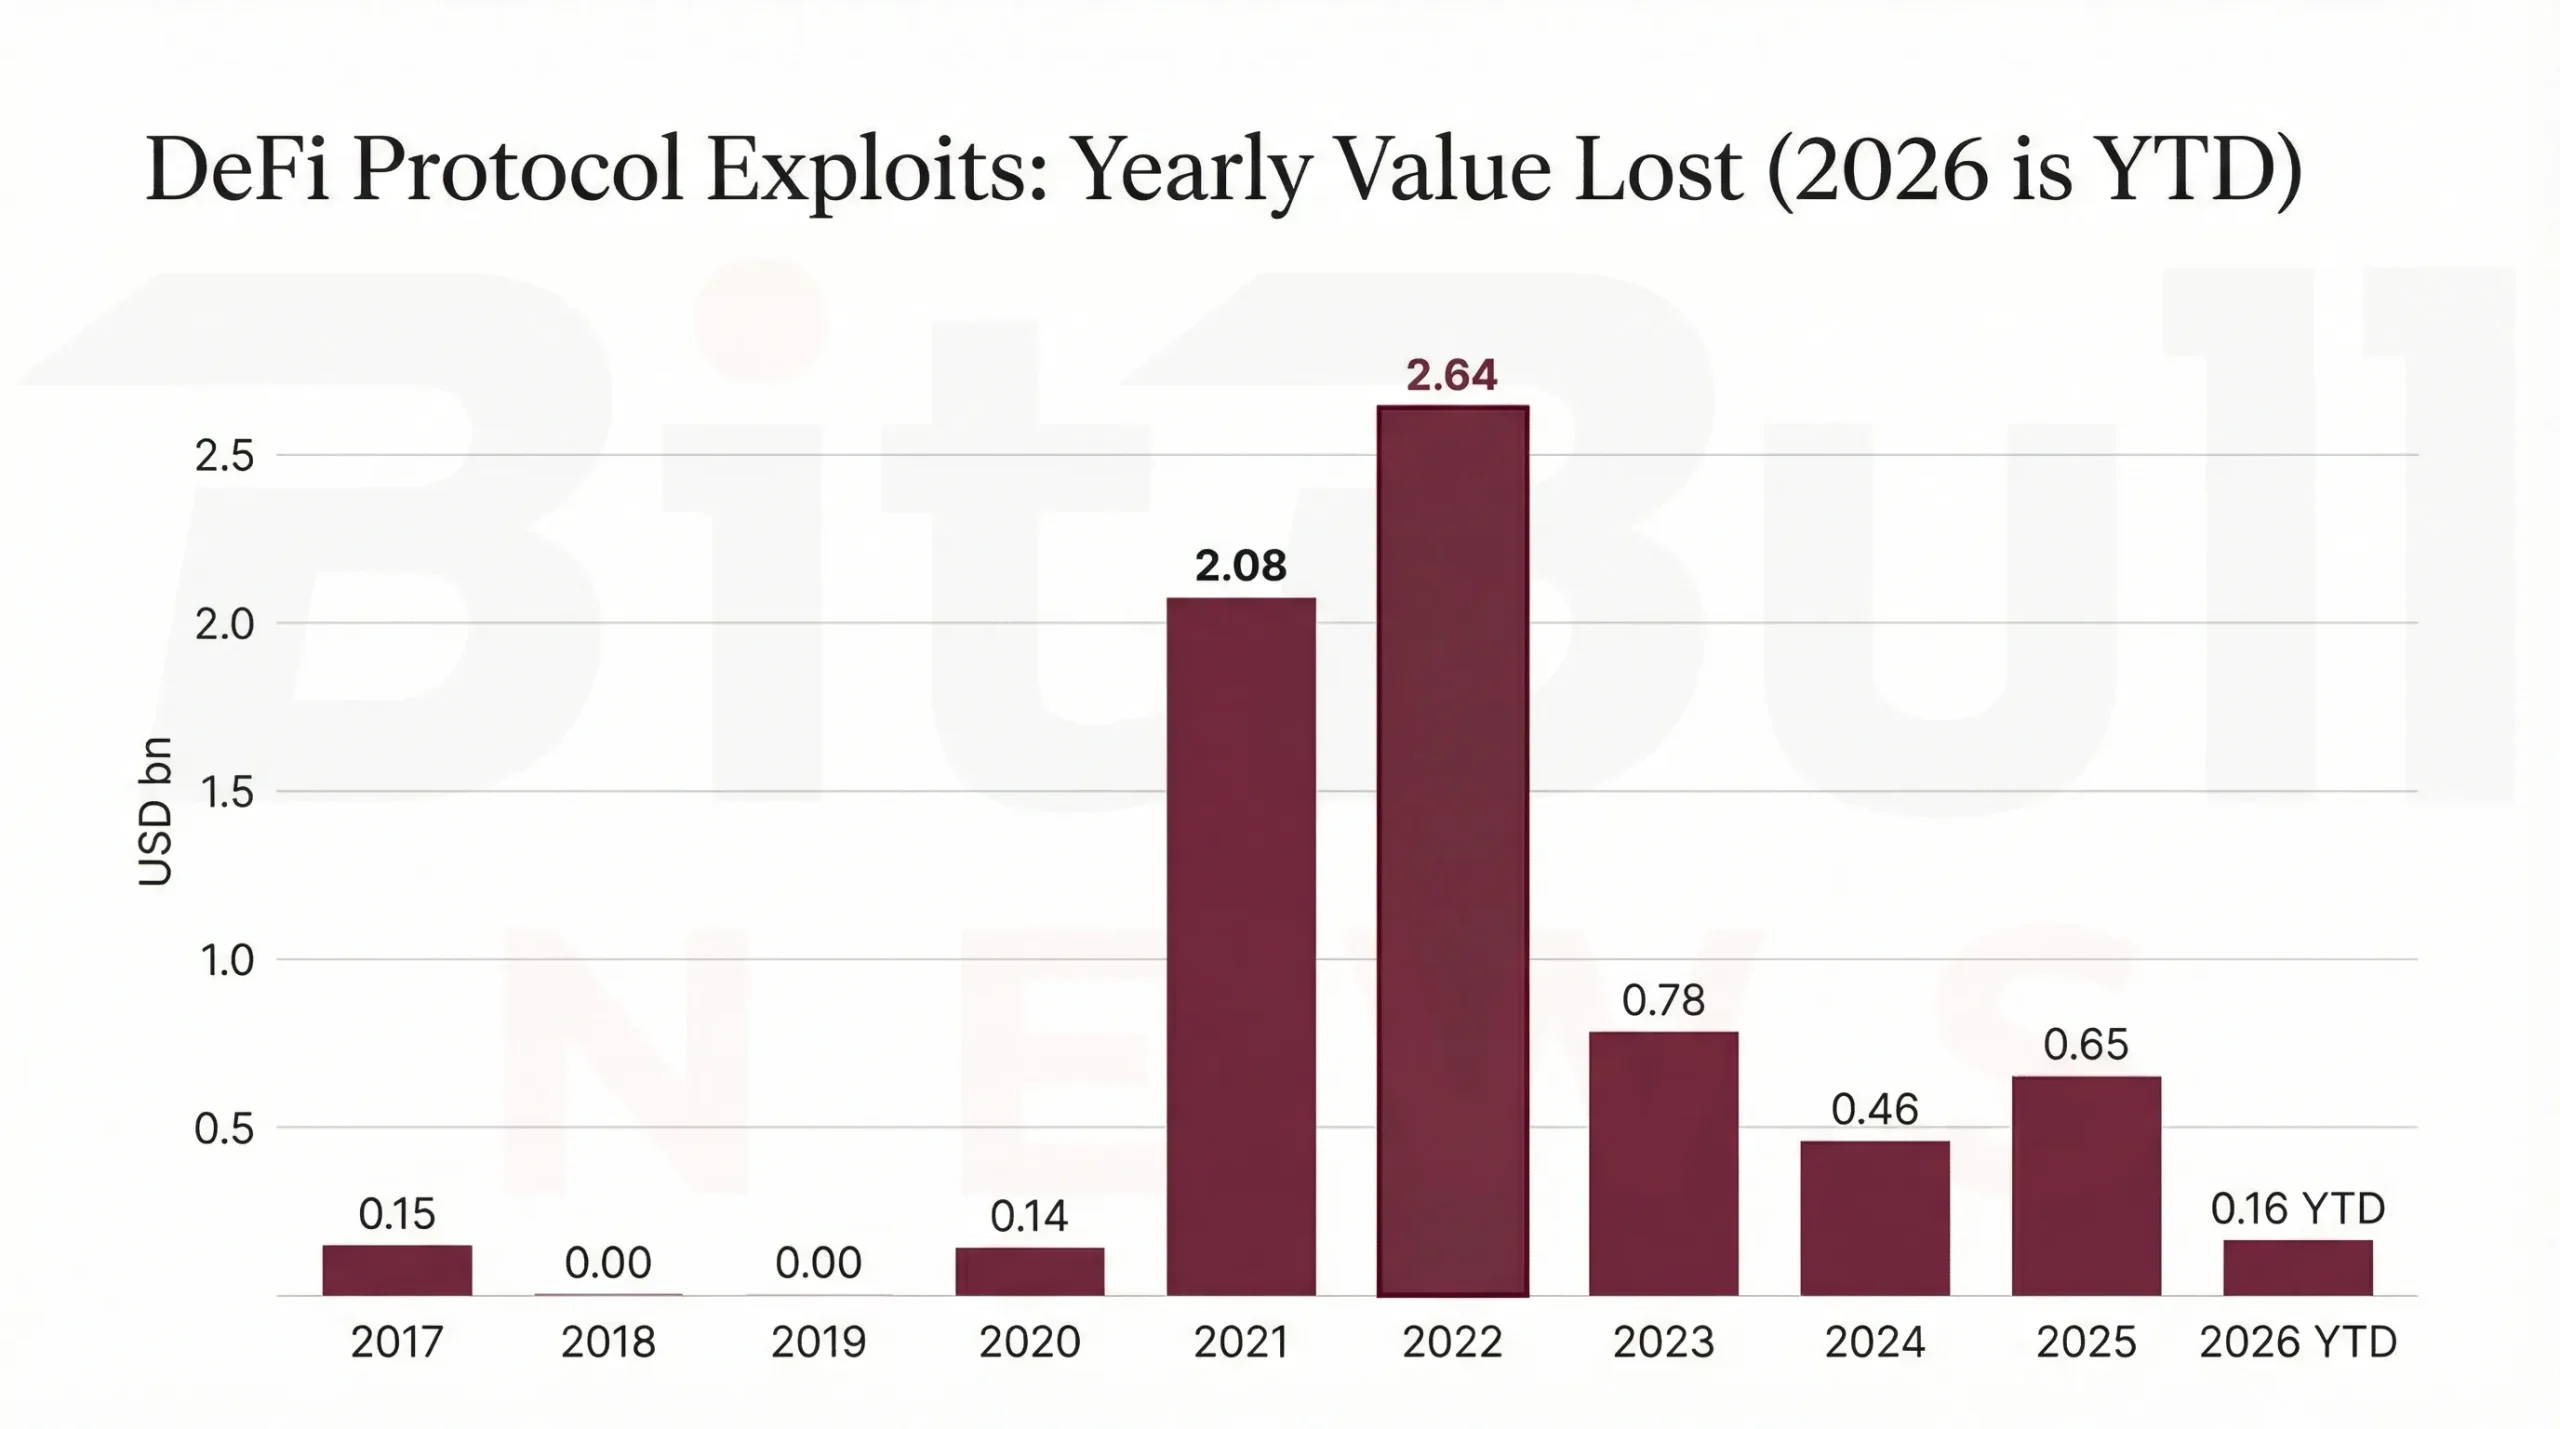
Chart 4: GameFi activity: Q2 to Q3 2025
NFTs: More Transactions, Lower Value Per Trade
The NFT market is no longer centered on ultra-high-ticket speculation. The report’s numbers make that very clear.
In Q3 2025, the cited industry report recorded 18.1M NFTs sold and $1.6B in trading volume. The same research framed 2025 as a year with more transactions at lower average values. That interpretation is reinforced by Q2 2025, where NFT trading volume fell 45% to about $867M even as sales rose sharply. The pattern is straightforward: unit activity proved more resilient than average value.
That means the NFT market is not dead, but its function has changed. The speculative phase dominated by a small set of iconic collections and very high average ticket sizes has weakened. What remains is a busier but less lucrative market, one that looks more like an always-on digital goods layer than a pure asset bubble. Collections such as CryptoPunks and BAYC still matter as benchmarks, but the macro takeaway is broader: NFT activity is surviving through throughput, not through premium pricing.
NFTs are shifting from “luxury speculation” toward higher-frequency, lower-ticket digital ownership. That is healthier for long-run utility, but it also means the sector is less likely to dominate headlines the way it did in 2021. Future upside depends on whether NFTs become embedded into gaming, identity, creator monetization, and tokenized rights rather than just collection trading.
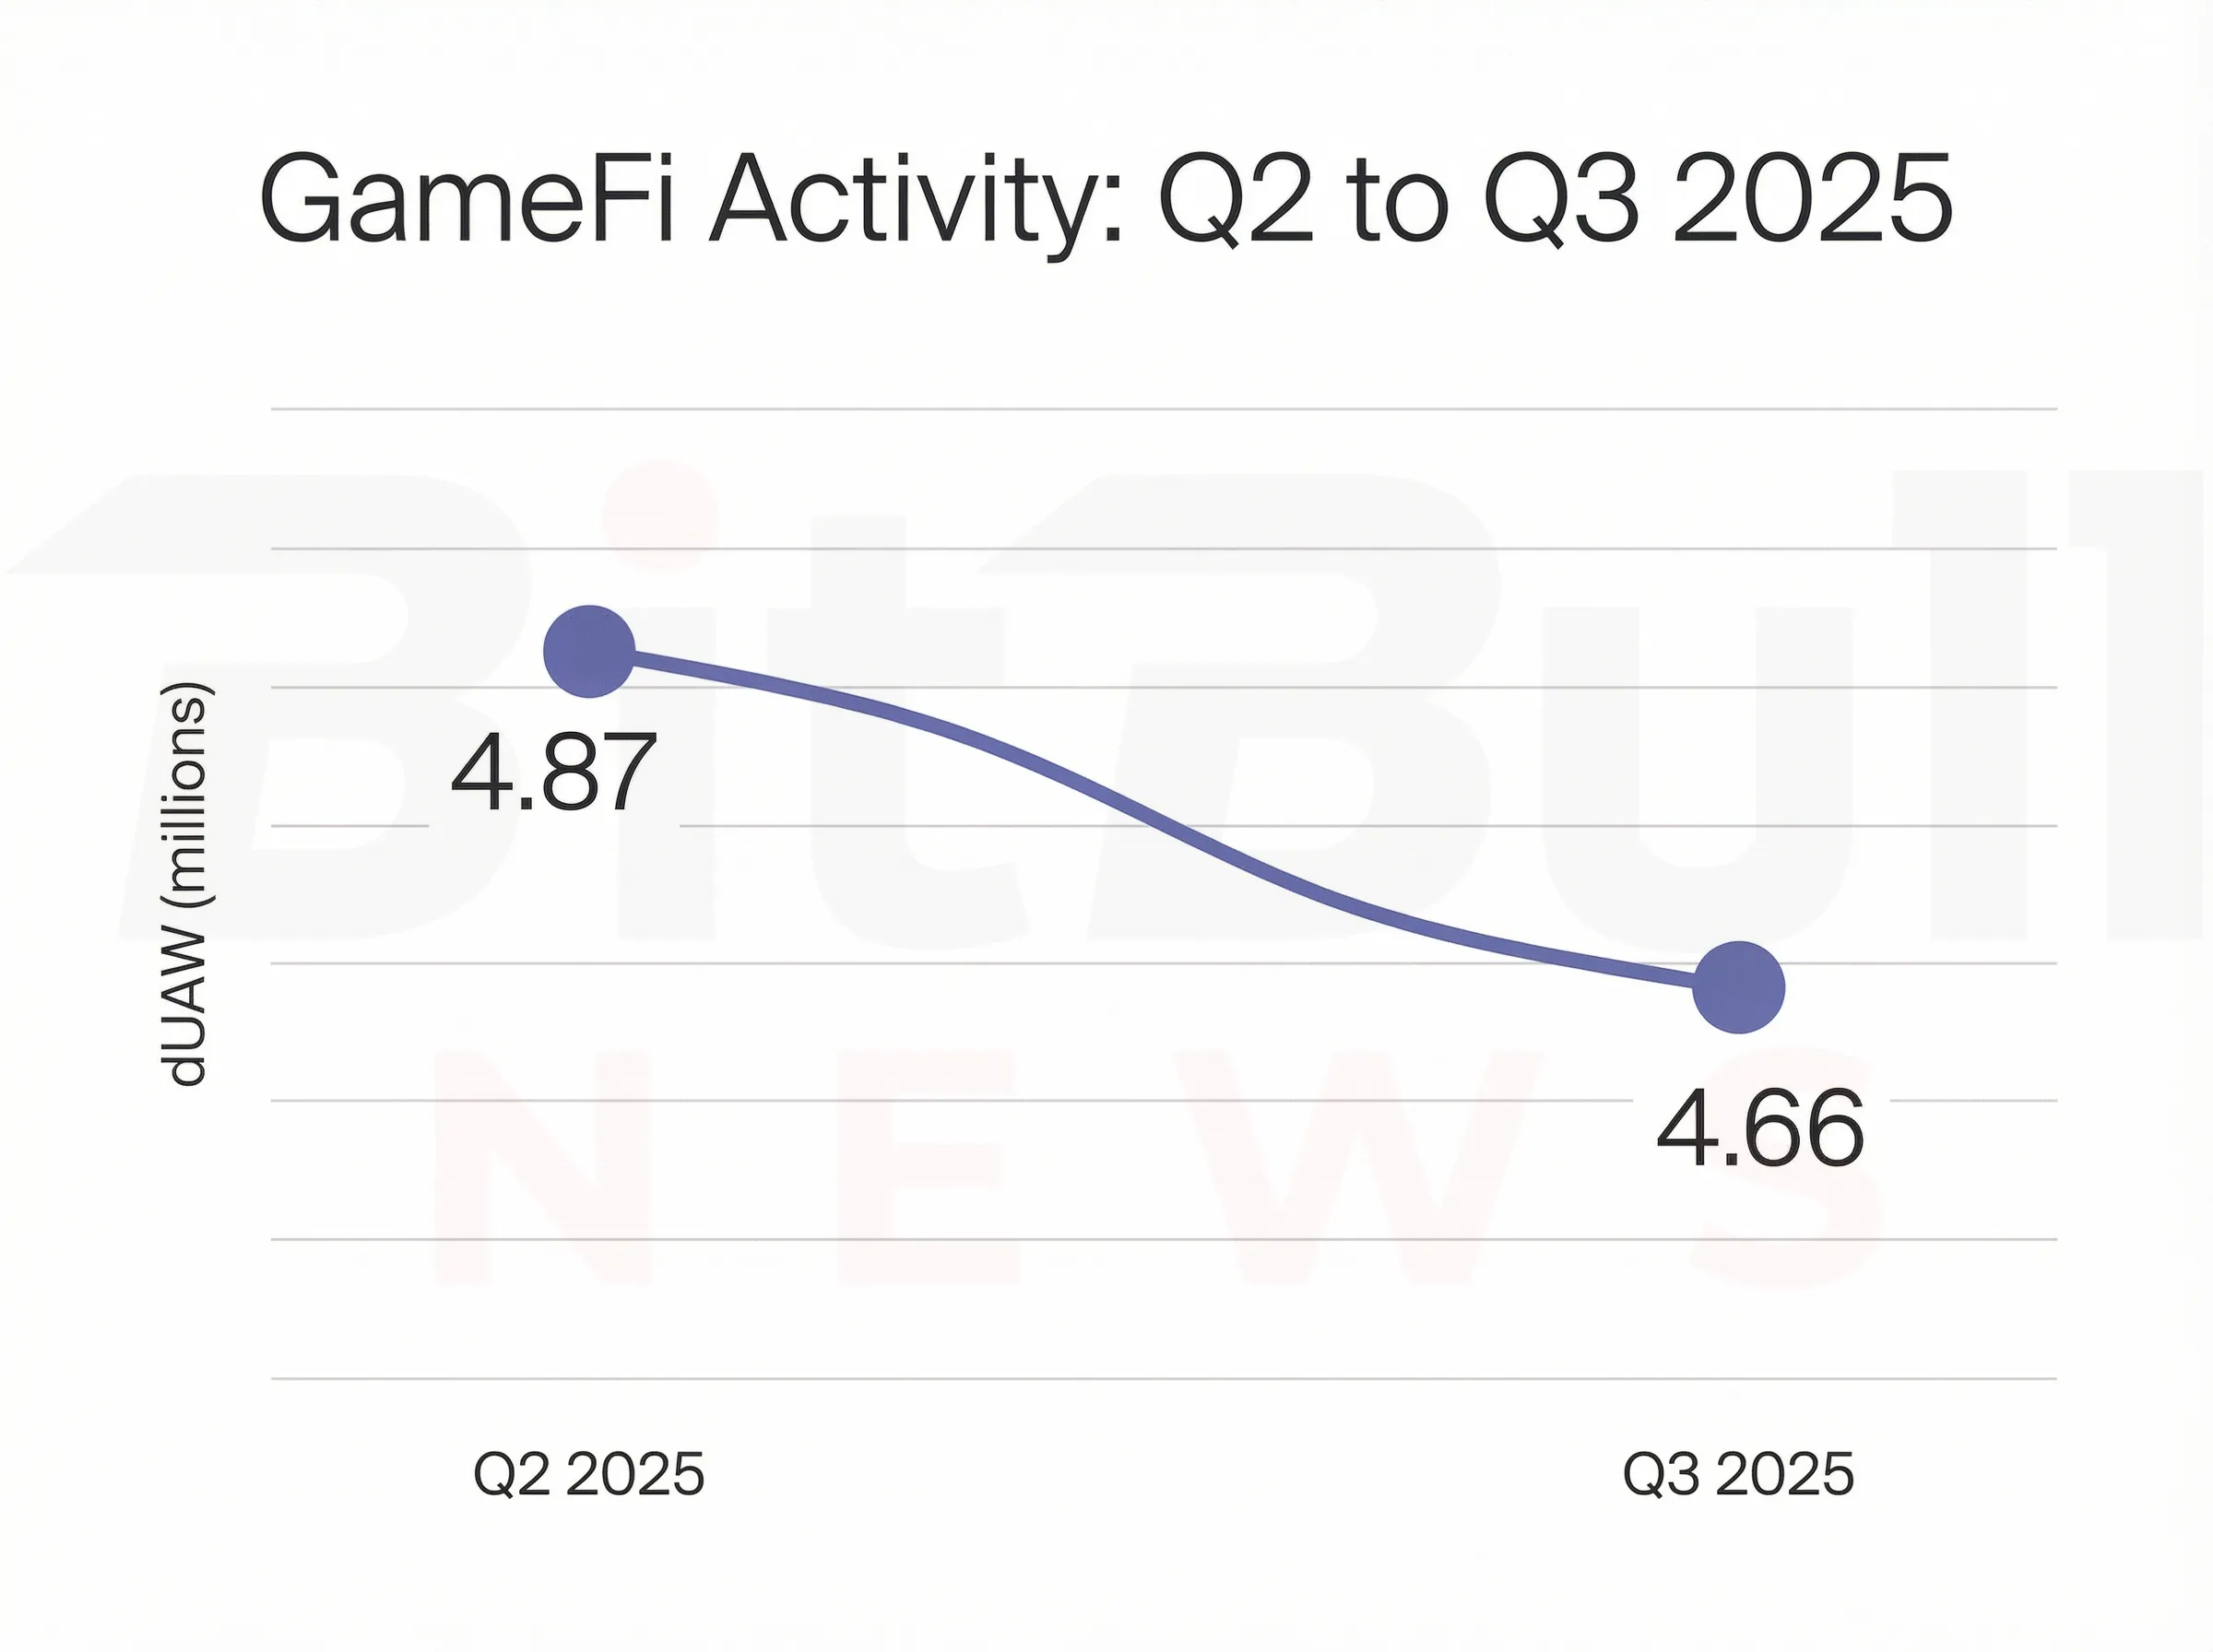
Chart 5: NFT trading volume: Q2 to Q3 2025
Stablecoins: The Strongest Large-Scale Growth Story in Crypto
Stablecoins are now the sector’s clearest macro winner.
USD-pegged stablecoin circulating value stood at about $314.7B on 2026-03-24, up around 35.0% YoY. More importantly, the market structure is extremely concentrated and overwhelmingly fiat-backed: about $285.8B of supply, or 90.7%, is fiat-backed; about $29.0B, or 9.2%, is crypto-backed; and only $0.35B, or 0.11%, is algorithmic. The era when algorithmic stablecoins looked systemically important is, at least for now, over.
This matters far beyond the stablecoin niche itself. Stablecoins are increasingly the settlement unit of the crypto economy. They sit underneath exchange liquidity, DeFi collateral, on-chain perps margin, and the next phase of tokenized cash and treasury products. That is why stablecoin growth outpacing DeFi TVL is such an important signal: it implies the market is valuing spendable, transferable, and yield-integratable cash primitives more than static lockups.
Regulation is also now an active market force, not a hypothetical future overlay. MiCA’s staged rollout means stablecoin issuance and distribution in the EU now operate inside a real authorization framework, especially for ARTs and EMTs. The practical outcome is likely market segmentation: more visible separation between regulated regional stablecoins and offshore/global liquidity stablecoins over the next one to three years.
Stablecoins are no longer just a defensive parking tool. They are becoming the base layer for crypto market structure. The key questions now are reserve quality, issuer concentration, jurisdictional segmentation, and how deeply stablecoins integrate with tokenized money-market and treasury products.
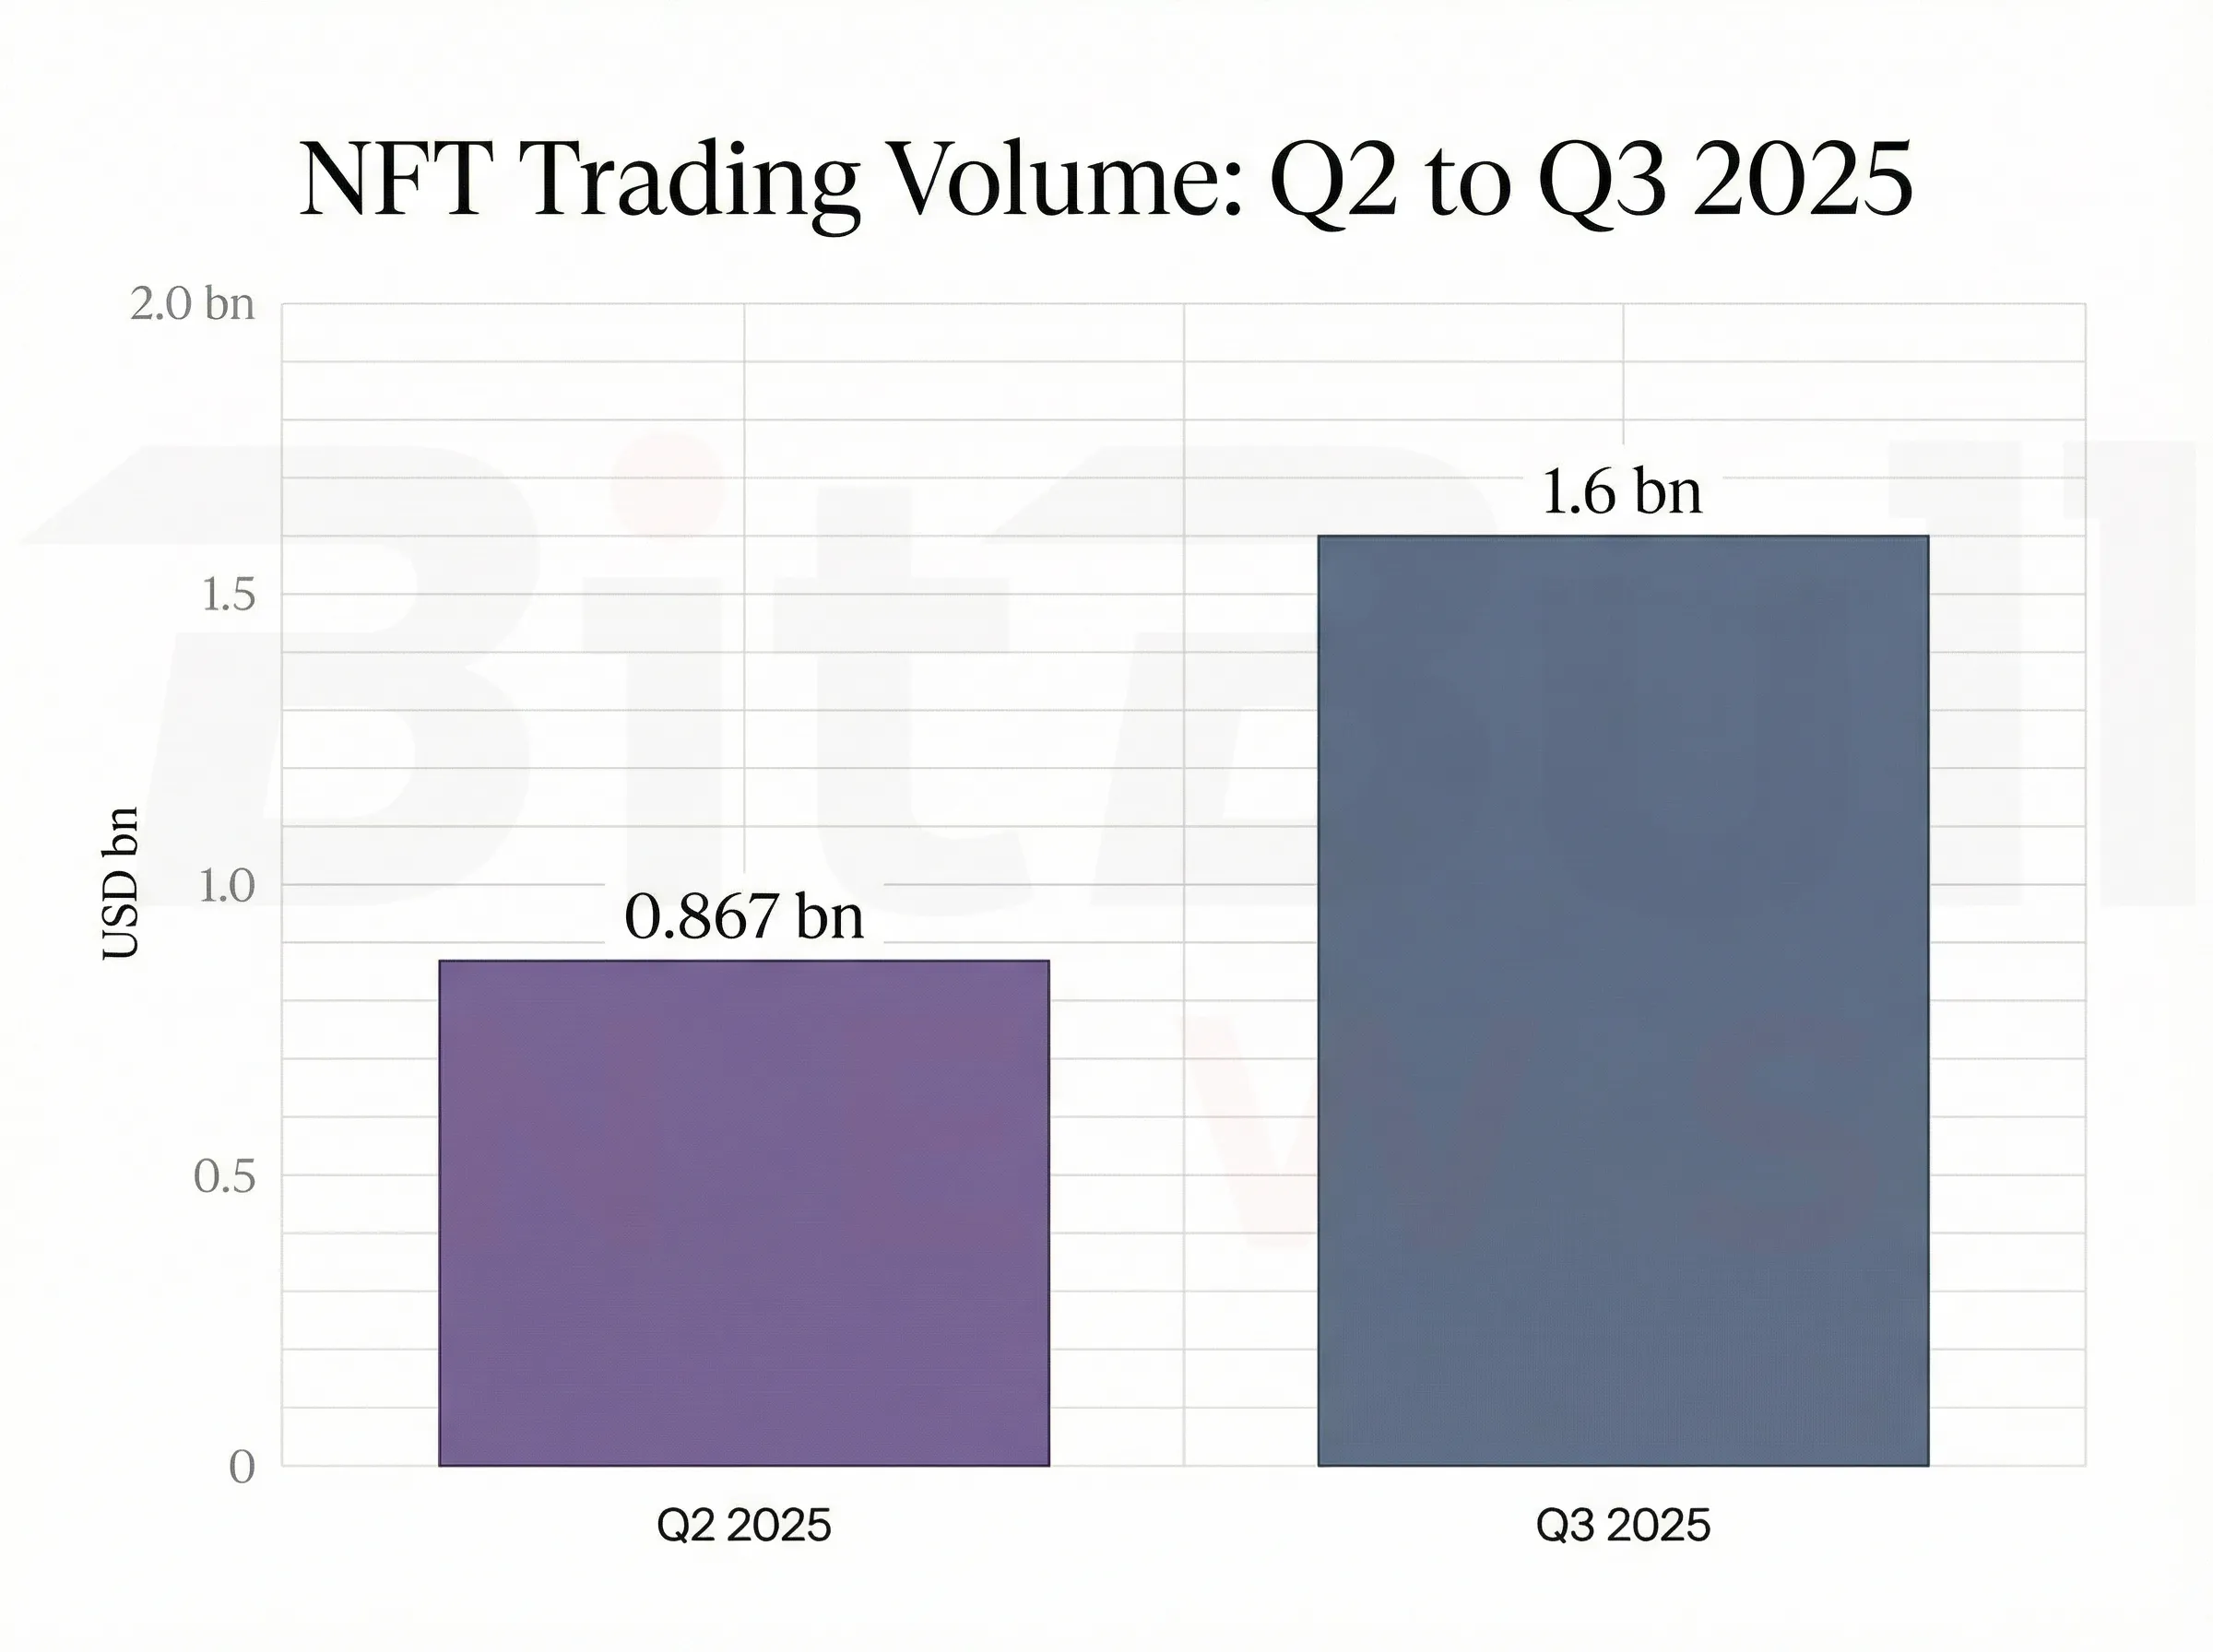
Chart 6: USD-pegged stablecoin circulating value (year-end; 2026 is YTD)
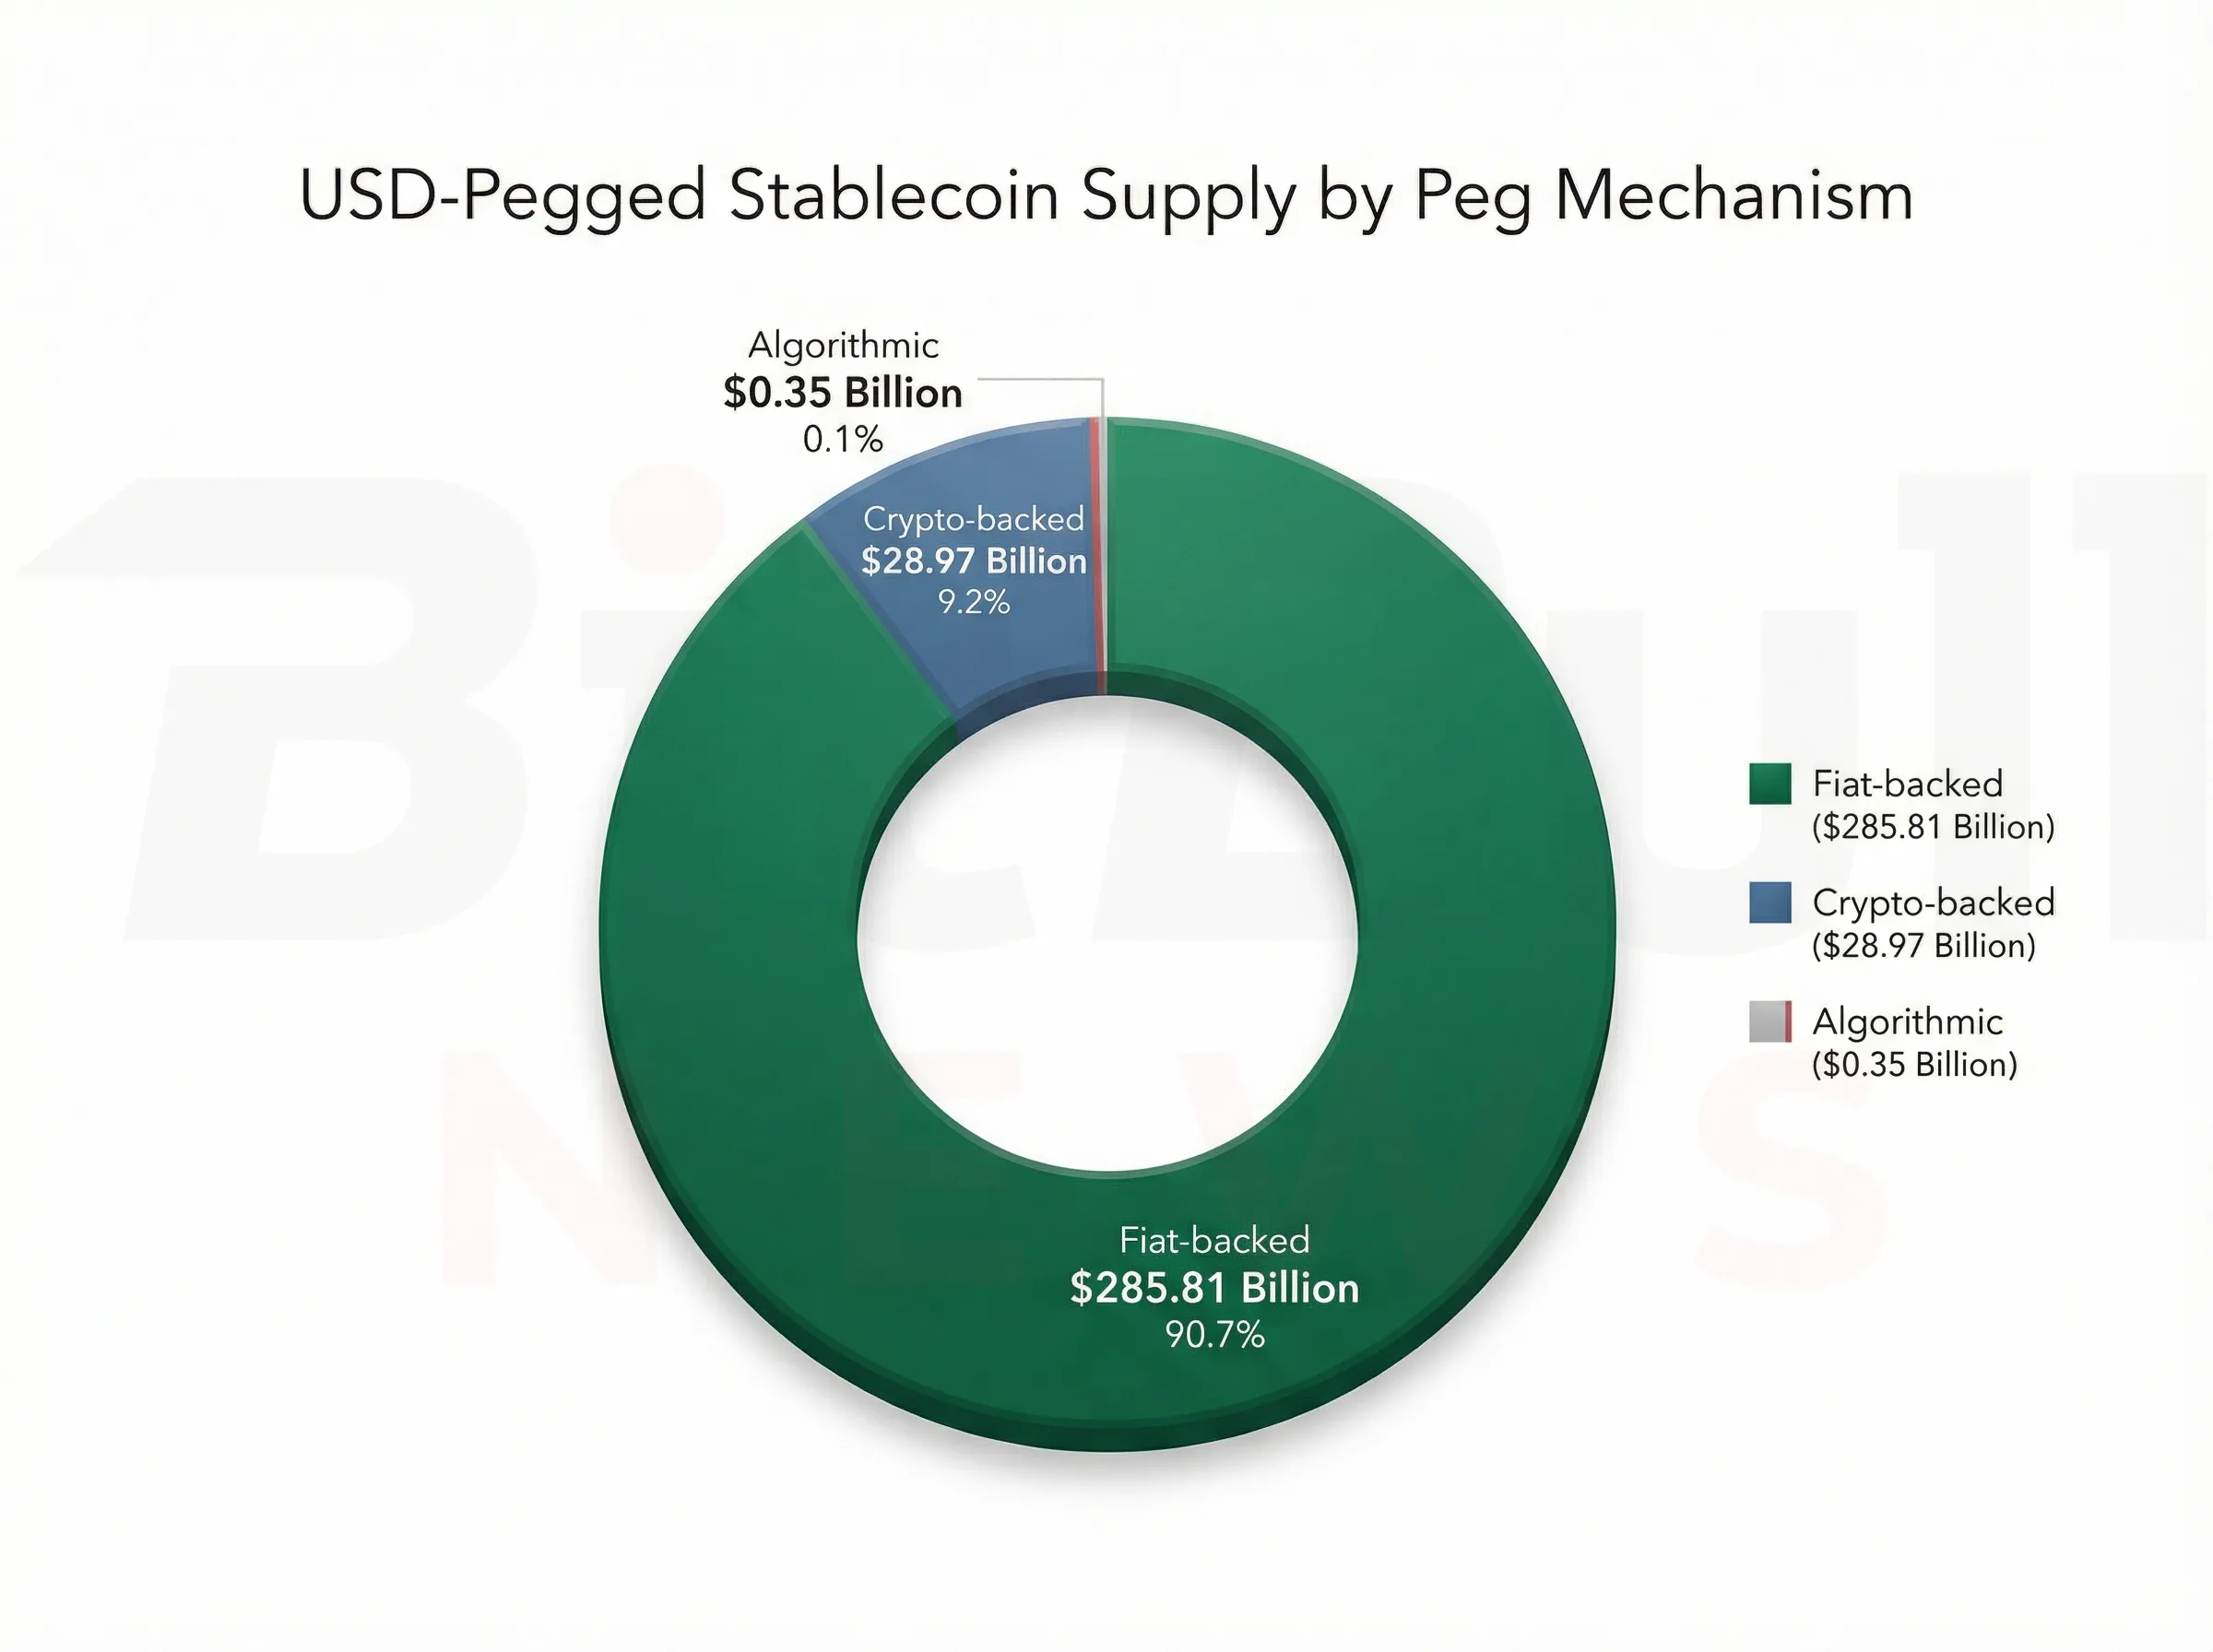
Chart 7: USD-pegged stablecoin supply by peg mechanism
RWA: From Narrative to Macro Segment
RWA is no longer a niche sidebar in crypto. It is a real macro segment.
The report tracks about $26.44B in distributed on-chain RWA value, about $370.41B in represented asset value, and 690,086 total asset holders, all with positive 30-day changes. Within that, tokenized U.S. Treasuries alone were running at around $10.00B with a displayed 7-day APY of about 3.15% in the source dashboard snapshot.
The most important conceptual distinction here is the one between distributed and represented assets. Distributed value is more meaningfully on-chain. Represented value can be much larger, but often functions more as blockchain-assisted recordkeeping than as freely portable, composable liquidity. That means the real RWA opportunity is not “everything tokenized equally.” It is the part of tokenization that improves cash management, settlement, collateral, and capital efficiency. The report is explicit that the strongest 1–3 year growth vectors are tokenized treasuries, money-market-like products, private credit where permitted, and deeper integration of RWAs into DeFi collateral stacks.
RWA is one of the few sectors where the market narrative and the measurable data are converging. It is not yet the fully open, fully liquid tokenized capital market some evangelists describe. But it is already large enough to matter, and the part that matters most is tokenized cash and short-duration yield.
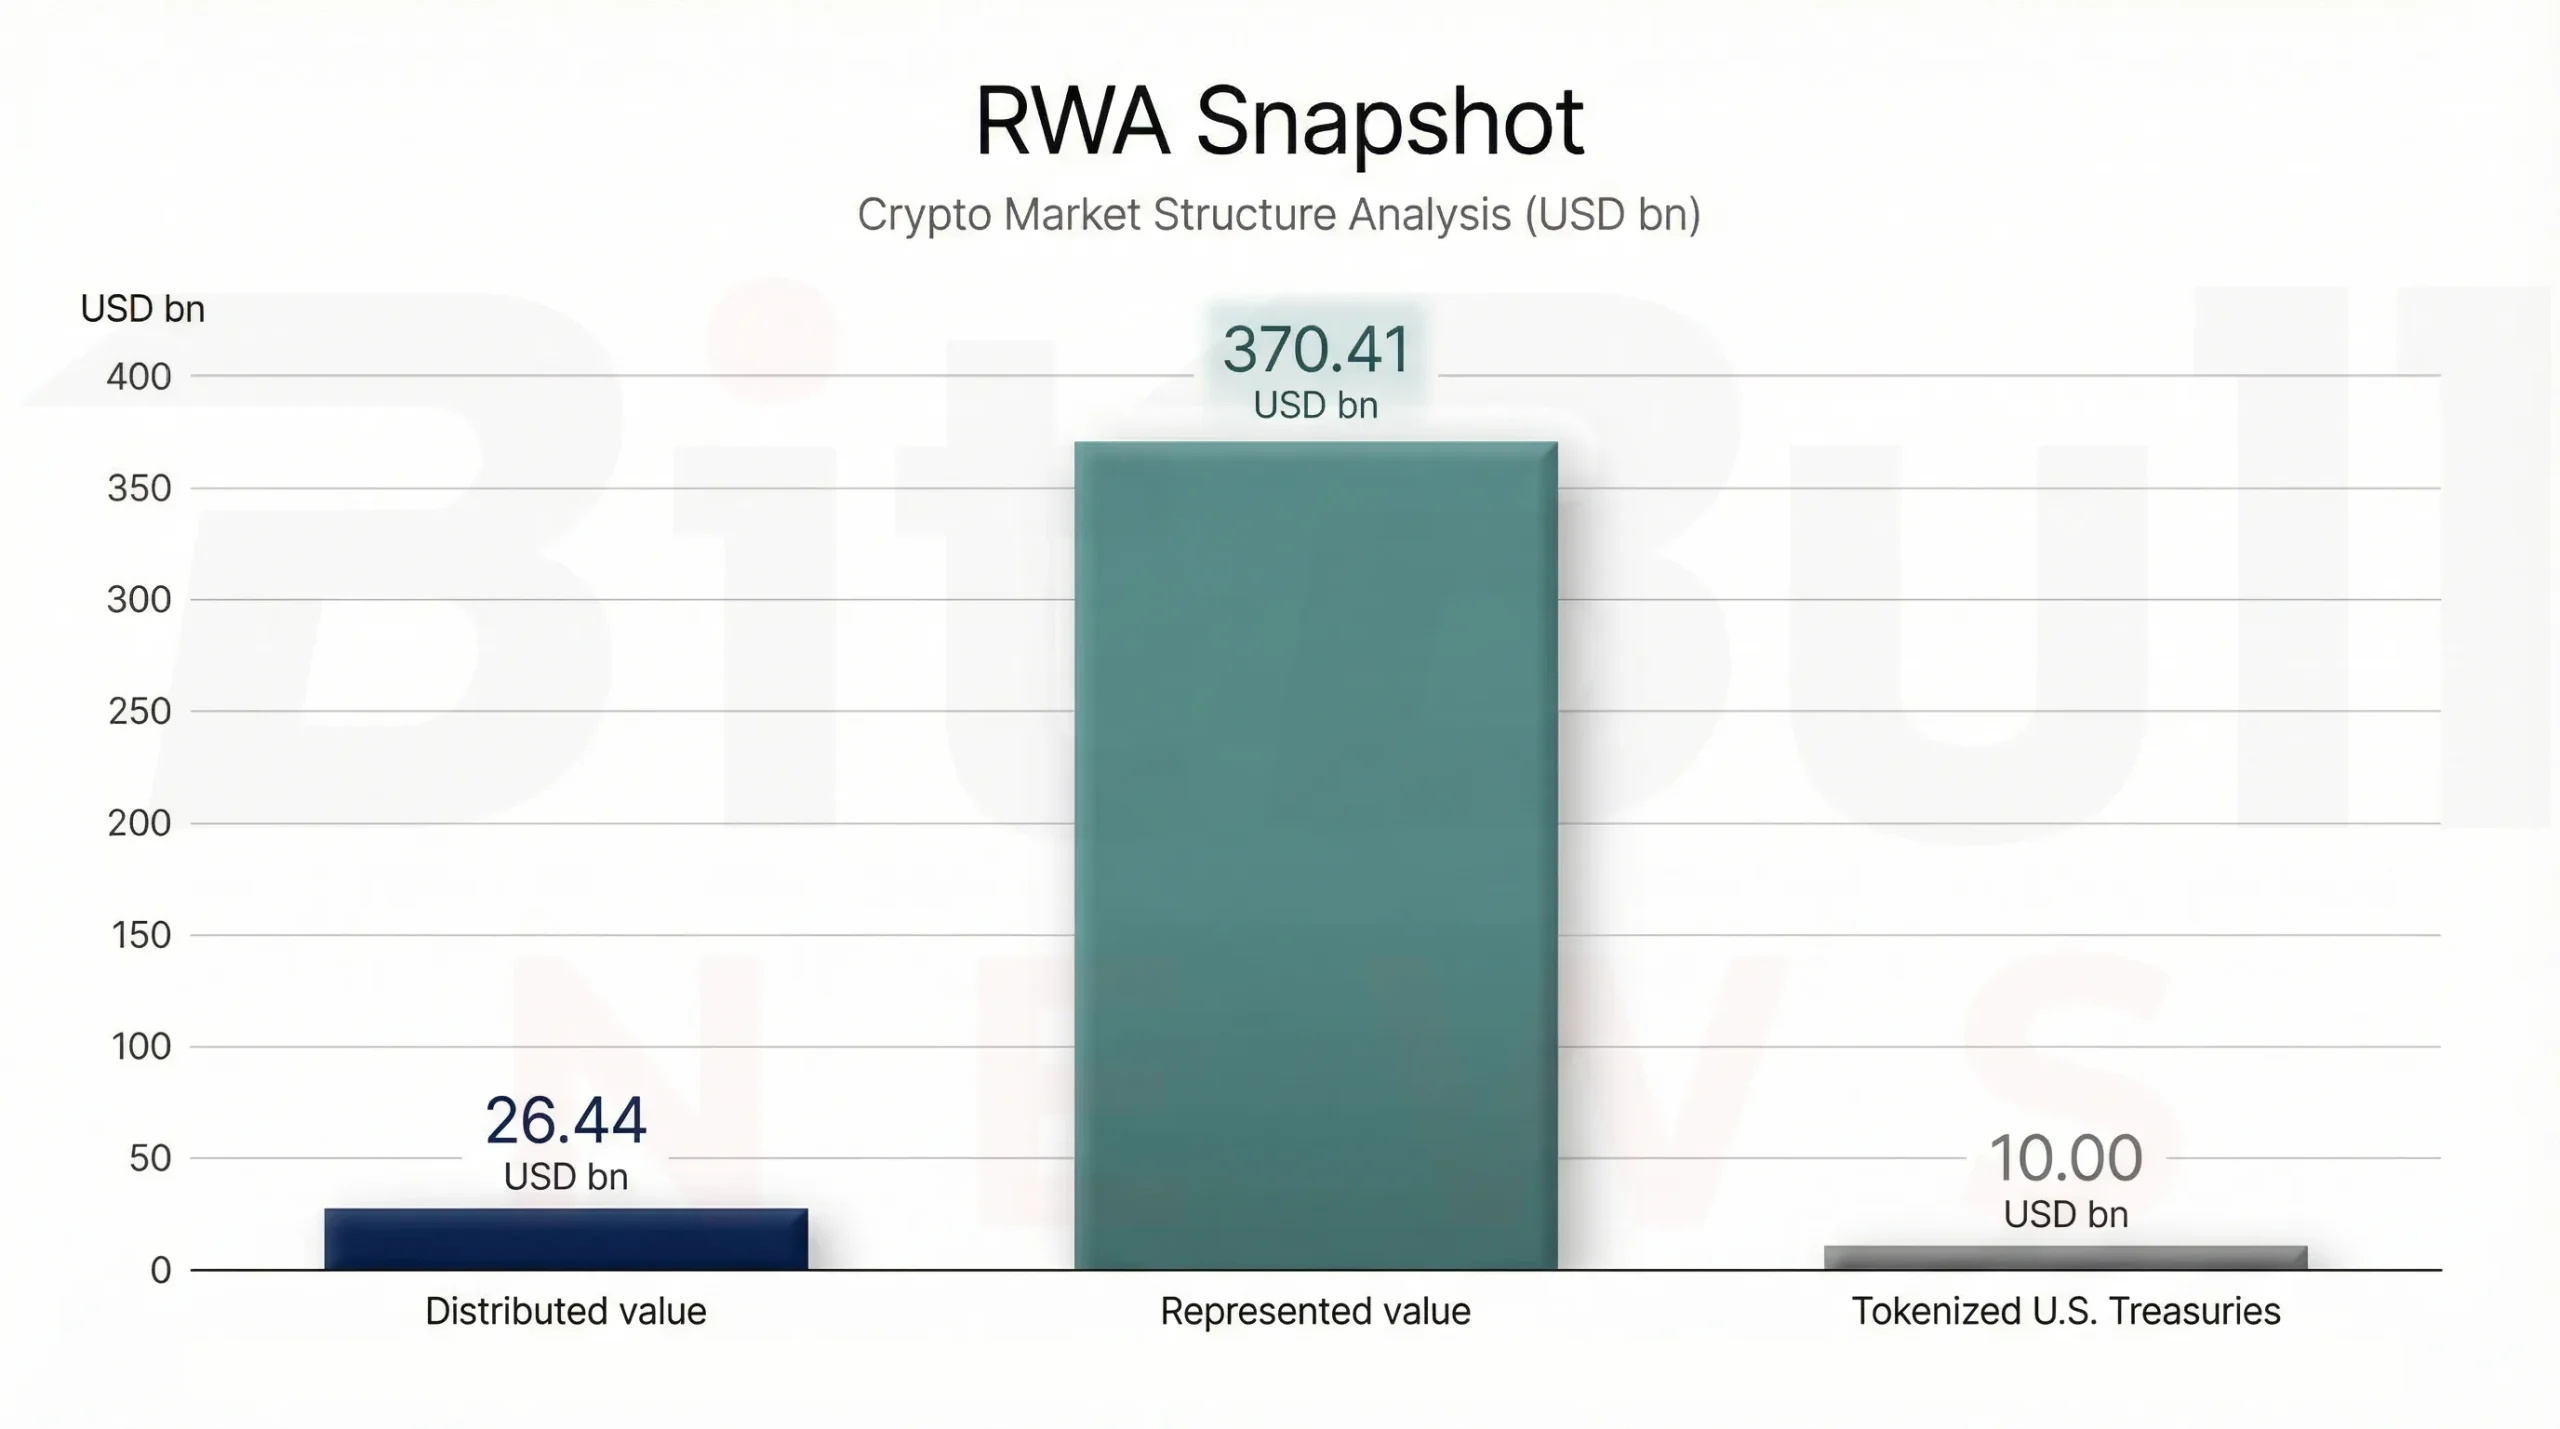
Chart 8: RWA snapshot
Derivatives: The Fastest-Growing Trading Layer
If stablecoins are the system’s settlement base, then derivatives are its velocity engine.
The report’s on-chain derivatives dataset shows $35.15B in 24-hour perpetual notional and $694.5B in 30-day notional as of 2026-03-24, with reported short-horizon changes of +86.76% (1d), +24.47% (7d), and +201.46% (1m). Over a longer lens, the same series implies roughly $7.92T of total 2025 on-chain perps volume and $2.29T YTD in 2026.
Open interest confirms that this is no small side market. The open-interest snapshot cited in the report showed about $14.487B in 24-hour OI and $420.421B in 30-day OI, with a +1.83% weekly change, and clear venue concentration led by Hyperliquid at roughly $5.259B. That concentration matters because the on-chain derivatives boom is not a generalized rise across all venues equally. It is a power-law market.
The data gap is just as important as the headline growth. The report explicitly states that CEX open interest and options surfaces are not fully captured by on-chain-only datasets. So the safest interpretation is not “on-chain derivatives are the whole market.” It is that they are the fastest visible growth pocket in the open data. That is still a major conclusion.
Derivatives are where stablecoin growth, chain throughput, and trader demand come together most directly. If stablecoin supply stays high and security/oracle integrity improves, derivatives should remain one of the strongest growth engines in crypto over the next 1–3 years.
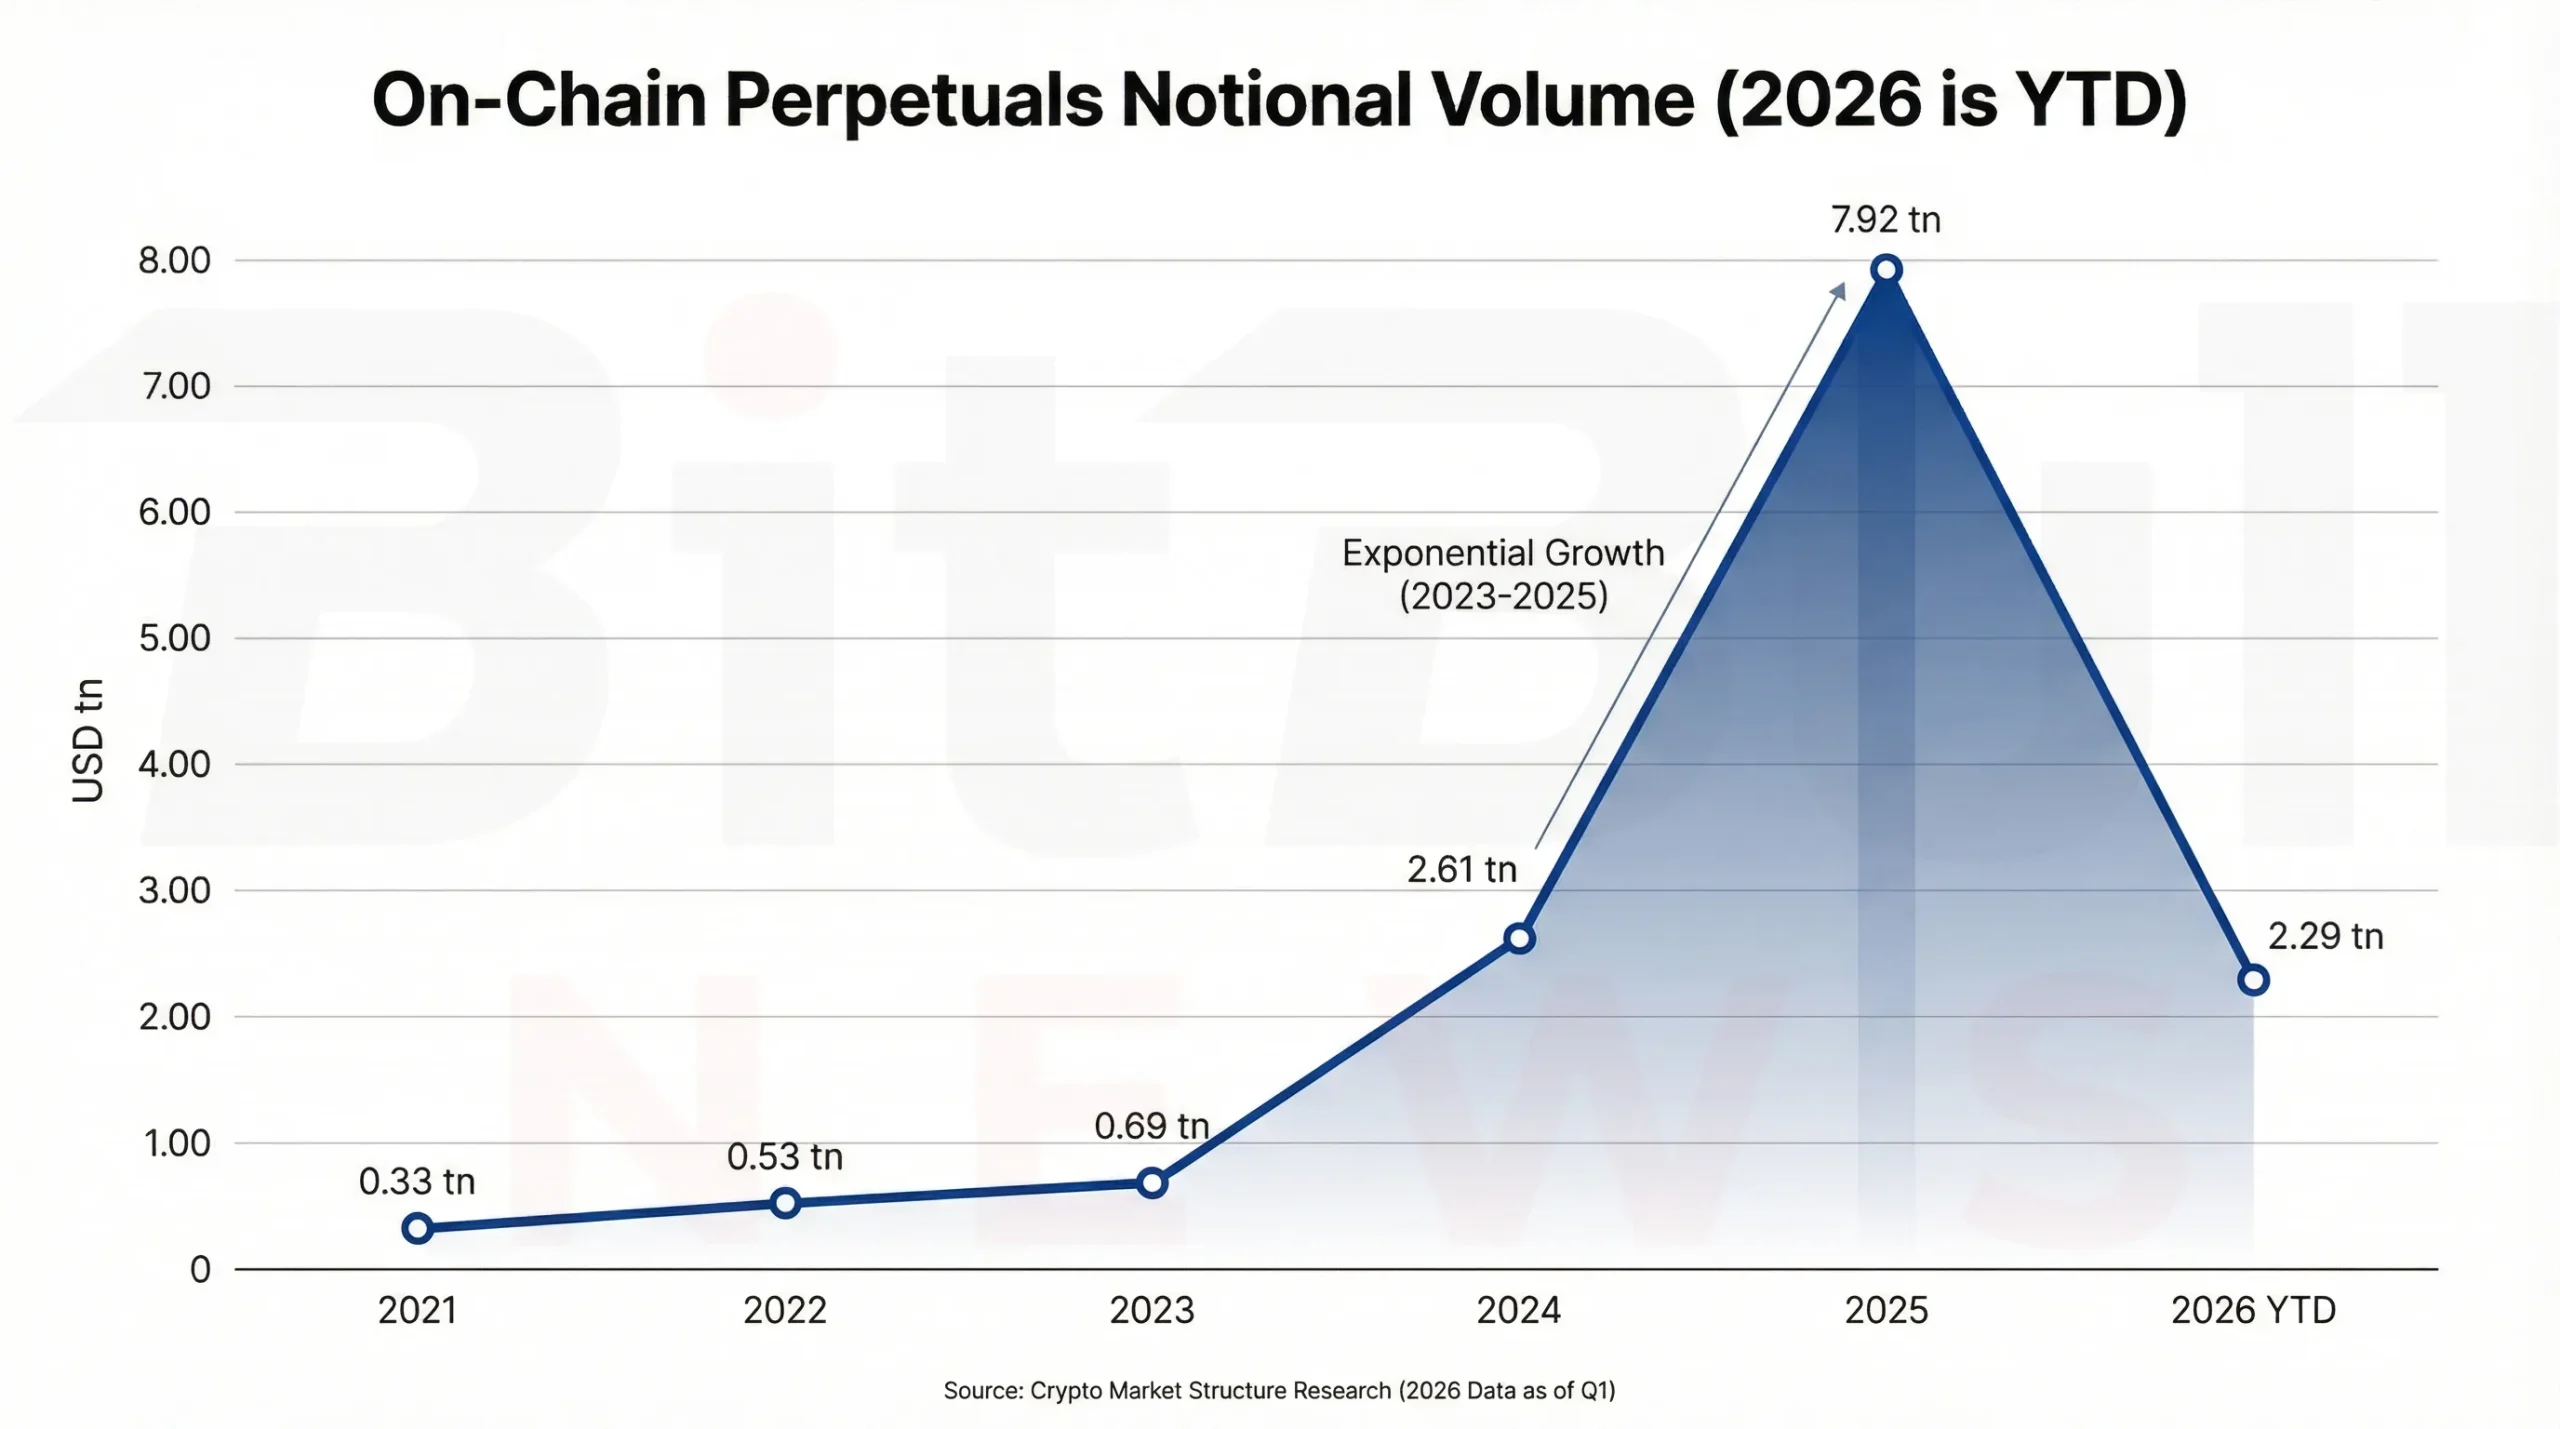
Chart 9: On-chain perpetuals notional volume (2026 is YTD)
Emerging Directions: AI Agents, DePIN, Rollups, DID, and the Next Infrastructure Wave
The report is careful here, and that is the right approach. “Emerging directions” should not be treated as a bag of hype terms. The most defensible way to track them is to use the categories that major analytics providers themselves are explicitly monitoring.
The cited datasets and APIs identify categories such as AI, AI Agents, Decentralized AI, DePIN, Rollup, Data Availability, DID, and RWA. The important point is not that these sectors all deserve equal bullishness. It is that they are where capital allocation and protocol formation are visibly clustering.
What supports their growth? The report’s answer is good: the next wave is likely to be pulled less by novelty and more by measurable infrastructure demand. That includes:
- demand for low-latency trading and settlement,
- growth of tokenized yield-bearing cash instruments,
- and the need for safer interoperability across chains and venues.
That is why the most credible emerging sectors are not just the ones with the loudest marketing. They are the ones that plug into the sectors already showing strong real usage: stablecoins, on-chain derivatives, and RWA. AI Agents may matter if they improve execution or market-making workflows. DePIN may matter if it creates real supply-side infrastructure. Rollups matter if they make derivatives and settlement cheaper and faster. DID matters if on-chain finance needs better identity and credential rails.
The next emerging winners are likely to be the sectors that attach themselves to real market plumbing, not just the sectors that invent new token stories.
Regulatory and Risk Landscape
There are two structural risks running across almost every sector in this report: compliance and security.
On compliance, MiCA is no longer a future-state talking point. ESMA’s MiCA page describes a regime that sets uniform EU rules for issuance, trading, white papers, disclosure, authorization, and registers, with an interim MiCA register already live and updated weekly. That matters not only for stablecoins, but for service providers, token distribution, and the legal shape of market access in Europe.
On security, the report’s historical loss tally remains one of the most important numbers in the whole document: about $15.86B hacked historically, including about $7.103B from DeFi-protocol targets and about $2.905B from bridge hacks. Even if crypto adoption keeps rising, hundreds of millions of dollars in trailing-12-month exploit losses mean the sector still pays a large operating tax for weak code, weak key management, and weak interoperability assumptions.
BitBullNews View
Crypto in 2026 looks less like a single sector and more like a barbell.
On one side are the weaker or maturing narrative-heavy sectors: token sales, NFTs, and parts of GameFi. They still matter, but they no longer define the market’s macro direction. On the other side are the sectors with the strongest measurable growth and the clearest institutional logic: stablecoins, on-chain derivatives, and RWA. DeFi sits in the middle — still essential, still large, but no longer able to dominate the cycle through TVL alone.
That is the real structural message of this research. The market is not done growing. It is just growing through different rails now. The winning segments are the ones that solve for liquidity, cash management, settlement, leverage, and collateral.
Key Findings
- Stablecoins are the strongest large-scale growth story in crypto, with about $314.7B in USD-pegged supply and roughly +35.0% YoY growth.
- DeFi TVL is still large at about $170.4B, but roughly flat to slightly down YoY, which means it is no longer the fastest-expanding core segment.
- On-chain perpetuals have become one of the market’s highest-growth segments, with roughly $7.92T total 2025 notional volume in the tracked universe.
- RWA is now a macro segment, with about $26.44B distributed on-chain value and $370.41B represented value.
- GameFi still shows millions of active wallets, but the sector has not yet re-proven its economic model.
- NFTs remain active, but the market has shifted toward higher transaction counts and lower average value per trade.
- Token sales still exist, but the market has structurally shifted toward private, structured, and compliance-routed fundraising.
- Security and compliance remain the two biggest cross-sector constraints.
Final Verdict
Research verdict: Crypto is growing through infrastructure, not through a uniform speculative cycle.
The sectors with the strongest evidence behind them right now are the ones closest to market plumbing: stablecoins, on-chain derivatives, and tokenized real-world assets. DeFi remains important, but it needs better risk-adjusted economics and lower exploit drag to regain leadership. GameFi and NFTs are alive, but they look more like maturing consumer categories than macro growth engines. Token sales are still part of the industry, but their structure is more private, more gated, and more regulated than in previous cycles.
The clearest conclusion is this:
the next crypto cycle is being built around liquidity, settlement, tokenized cash, and institutional-grade market rails — not around the same retail-led narratives that dominated the last one.