


The week of March 16–23 did not break the stablecoin market. It re-routed it.
After the previous reporting window showed a market defined by large issuance signals, exchange outflows, and concentration risk, this week looked more like a second-stage move: total stablecoin supply still grew, but only modestly, while liquidity rotated much more aggressively between chains and venues. Aggregate stablecoin market capitalization ended the week near $316.86 billion, up roughly $981.5 million over seven days, or 0.31%. On the surface, that looks uneventful. Under the surface, it was not.
Ethereum was the clear winner in absolute terms, adding around $2.02 billion in stablecoin supply during the week. BSC gained about $493 million, while Arbitrum added around $203 million. Those gains were offset by declines on Tron, Solana, and Avalanche, with Tron down roughly $739 million, Solana down $382 million, and Avalanche down nearly $199 million. That distribution matters more than the headline market-cap increase, because it suggests the market did not receive a broad new wave of stablecoin demand. It recycled liquidity toward specific execution environments.
That makes this week’s report a direct continuation of the previous one. Last week, the main question was whether exchange outflows and large mints meant liquidity was becoming more mobile. This week, the answer looks increasingly yes. Liquidity did not disappear. It shifted toward Ethereum, BSC, and Arbitrum, while part of the old USDT-heavy and high-throughput transfer base, especially on Tron, cooled modestly.
Market Structure Snapshot
The stablecoin market remains structurally concentrated even as liquidity rotates internally. Total market size may have risen slightly, but the system is still dominated by a small number of issuers and a small number of chains.
At the end of the week, USDT dominance stood around 58.09% of the entire stablecoin market. That means Tether alone still accounts for more than half of the market’s dollar liquidity. The second key fact is chain concentration. Ethereum finished the week with 51.91% of total stablecoin supply, while Tron still held 27.17% despite its weekly outflow. In practical terms, stablecoin market structure remains concentrated in two ways at once: by issuer and by chain.
That is why simple stablecoin market-cap growth should never be read in isolation. A market where total supply rises by less than 1% can still be highly eventful if billions of dollars shift between settlement layers, derivatives venues, and cross-chain routes.
Table 1. Stablecoin supply share by network, end of week
| Network | End-of-week stablecoin supply | Net flow (7d) | WoW % | End share | Share change | Dominant stablecoin |
|---|---|---|---|---|---|---|
| Ethereum | $164.48B | +$2.015B | +1.24% | 51.91% | +0.48pp | USDT (~48.85%) |
| Tron | $86.08B | -$739M | -0.85% | 27.17% | -0.32pp | USDT (~98.33%) |
| Solana | $15.29B | -$382M | -2.44% | 4.83% | -0.14pp | USDC (~53.76%) |
| BSC | $14.22B | +$493M | +3.59% | 4.49% | +0.14pp | USDT (~63.14%) |
| Arbitrum | $3.72B | +$203M | +5.77% | 1.17% | +0.06pp | USDC (~57.81%) |
| Avalanche | $1.61B | -$199M | -11.01% | 0.51% | -0.06pp | USDT (~44.29%) |
| OP Mainnet | $0.54B | -$3M | -0.62% | 0.17% | ~0.00pp | USDC (~39.57%) |
| Others | $30.91B | -$407M | residual | 9.76% | -0.16pp | — |
The most important shift versus the prior week is that Ethereum widened its lead again, while Tron moved from being merely dominant to looking slightly more vulnerable at the margin. Not broken, not structurally reversed, but no longer absorbing liquidity the way it often does when stablecoin demand is primarily transfer- and payments-driven.
Weekly Flow by Chain
This week’s chain-level picture was the cleanest sign of internal rotation.
Ethereum added over $2 billion, which was more than twice the total net growth of the overall stablecoin market. That tells you immediately that growth elsewhere was not broad-based. Ethereum did not just participate in weekly expansion. It absorbed liquidity from other parts of the network map.
BSC and Arbitrum were the clearest secondary winners. BSC’s +$493 million weekly increase and Arbitrum’s +$203 million rise matter because both chains are closely tied to active trading, lower-fee execution, and derivatives-adjacent capital deployment. In other words, the chains that gained stablecoins were not just parking lots. They were chains where stablecoins are likely to be used.
Tron moved the other way, losing around $739 million. Solana also declined, down $382 million, while Avalanche saw the sharpest contraction in percentage terms at -11.01%. That does not mean those ecosystems are suddenly broken. It means the market was selective. Stablecoin capital did not flow “into crypto” equally. It moved toward specific venues and away from others.
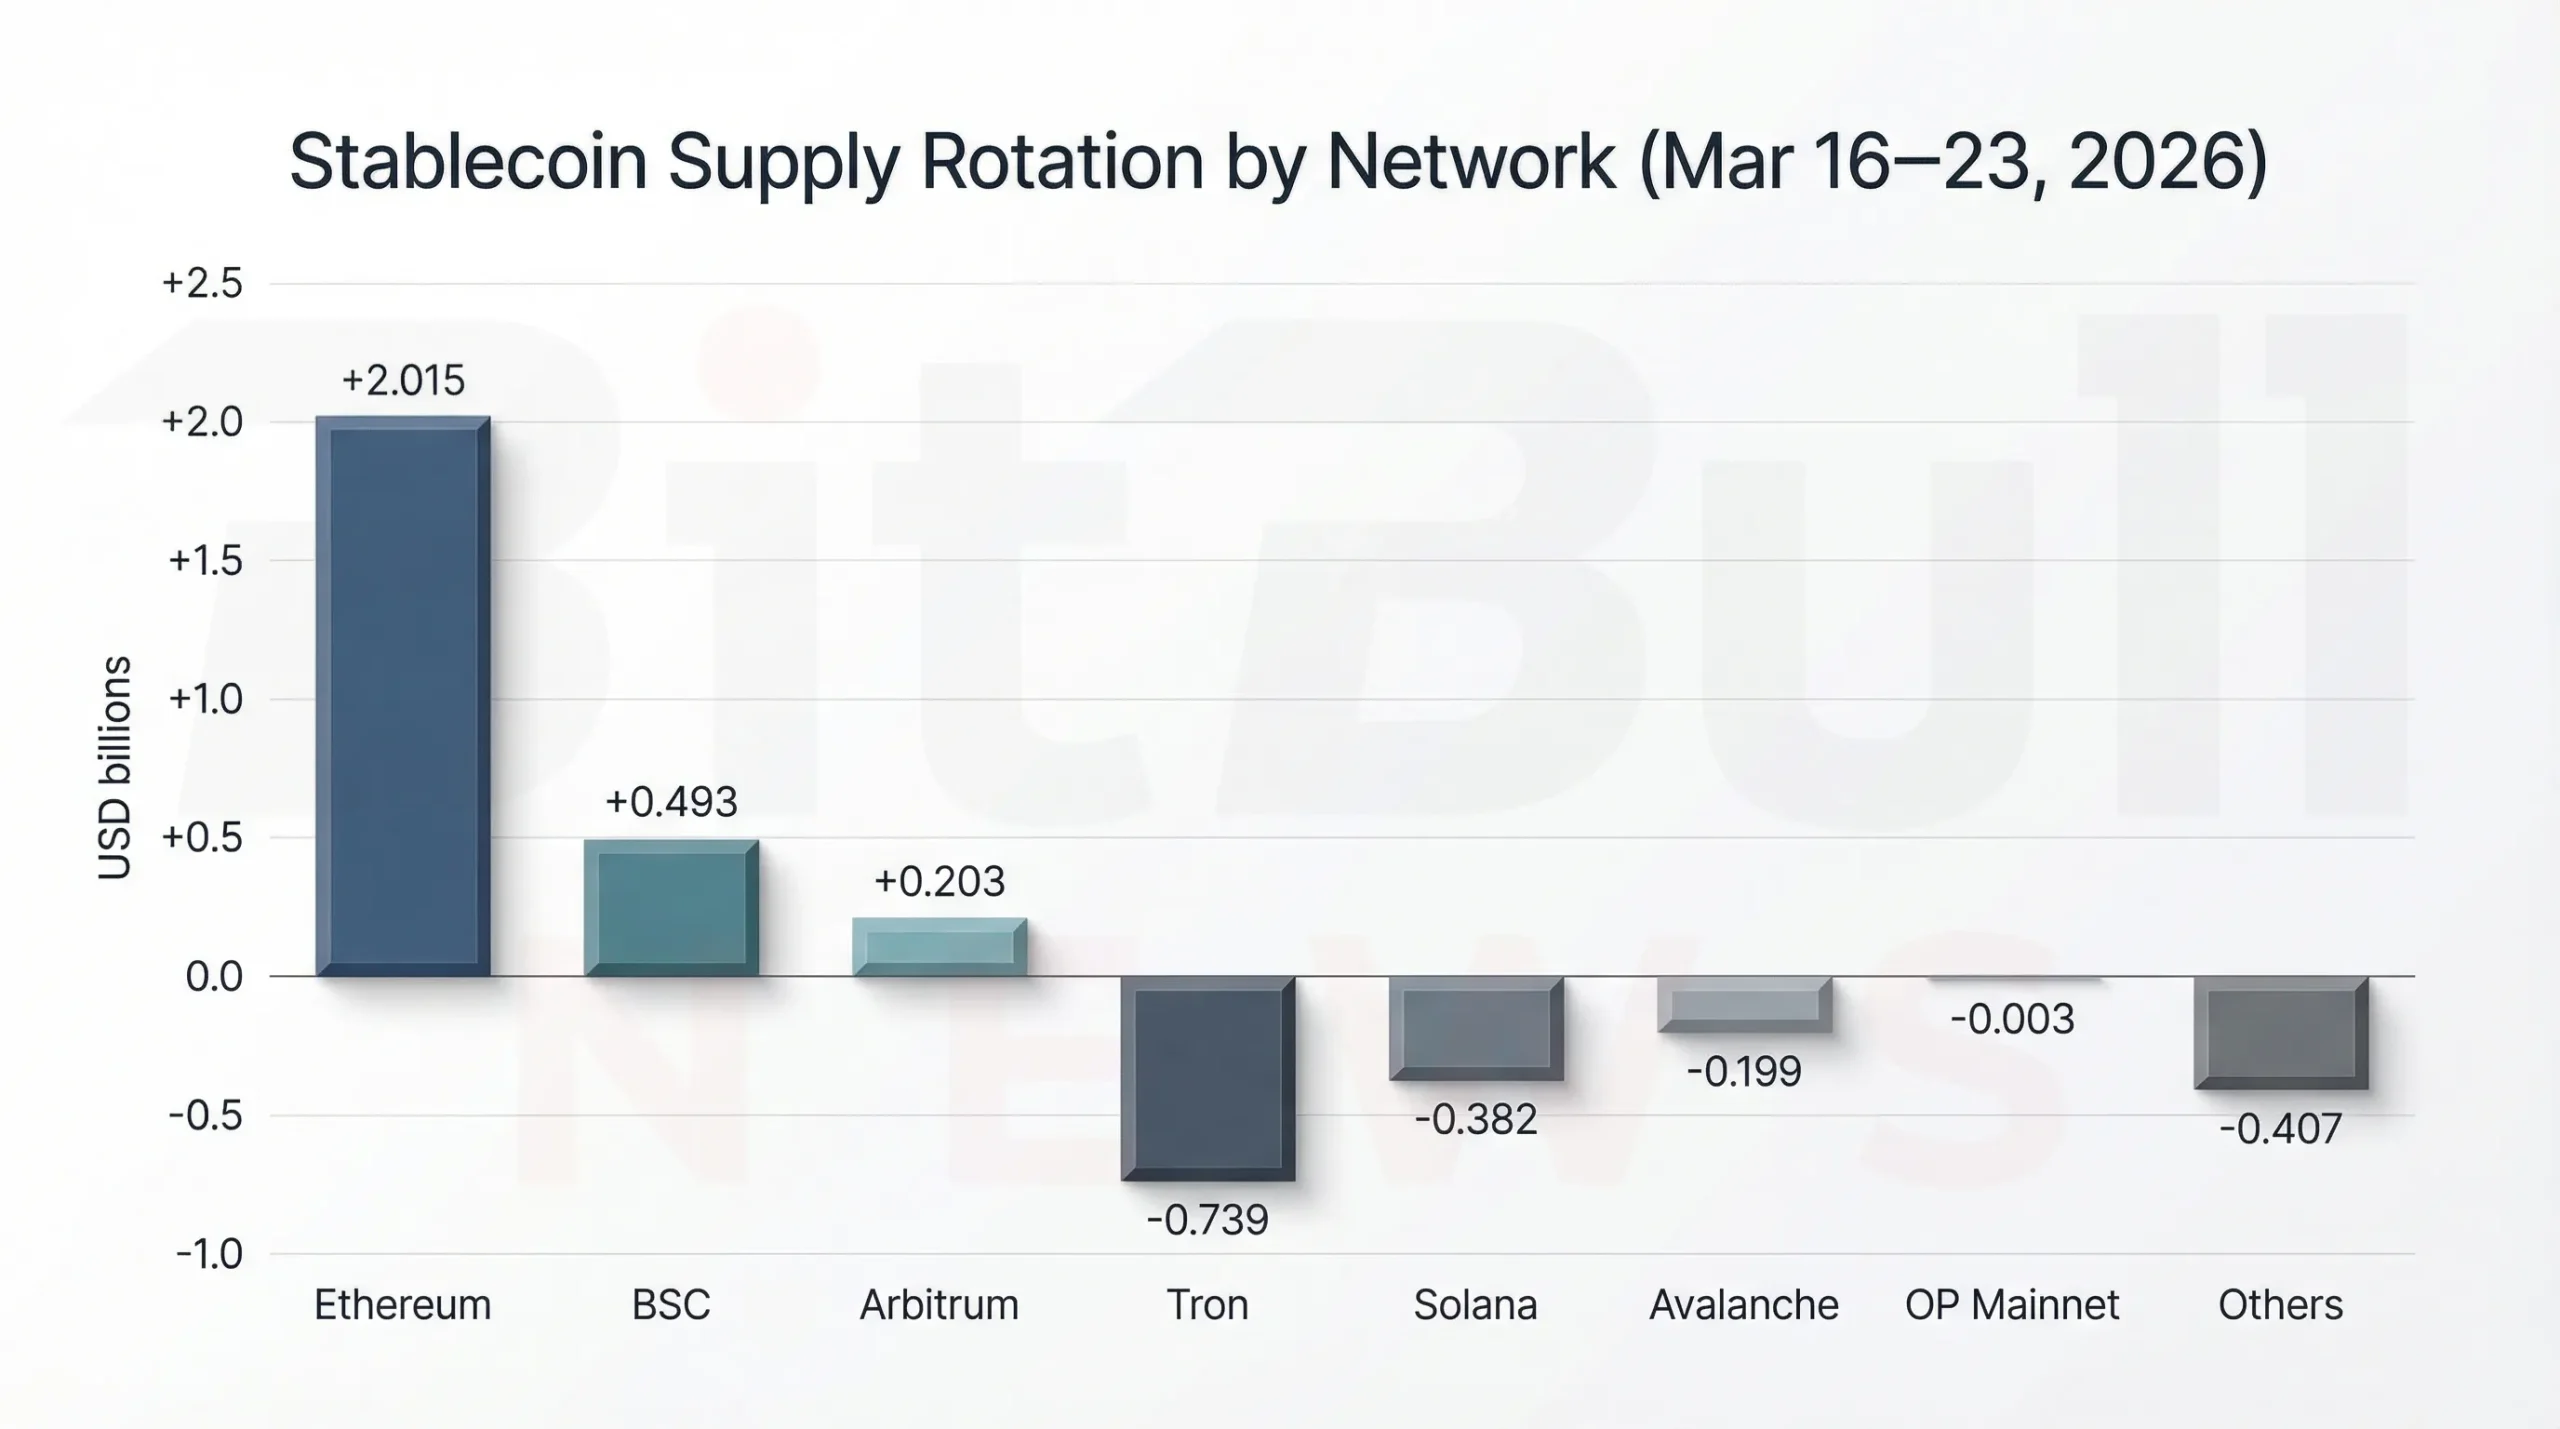
Stablecoin liquidity rotated decisively toward Ethereum, BSC, and Arbitrum during March 16–23, while Tron, Solana, Avalanche, and the long tail lost share.
Network Share Shifts and What They Mean
The share-change numbers help clarify what the raw dollar figures imply.
Ethereum gained 0.48 percentage points of total market share in a single week. BSC added 0.14 points, and Arbitrum added 0.06 points. On the other side, Tron lost 0.32 points, Solana lost 0.14, Avalanche lost 0.06, and the residual long tail also slipped.
That is a meaningful reallocation, especially for a week where total market growth was so modest. It means the market was not just expanding. It was repricing which networks deserved to hold dollar liquidity.
The stablecoin dominance composition on each chain makes this even more interesting. Tron remains almost entirely USDT-led. Solana and Arbitrum remain USDC-tilted. Ethereum is more mixed. That suggests three different demand profiles:
- Tron still functions as the main USDT transfer corridor.
- Solana and Arbitrum remain closely associated with USDC-heavy DeFi and perps usage.
- Ethereum continues to operate as the broadest and deepest settlement base, capable of absorbing capital from multiple liquidity paths.
This week, the market favored the deeper and more flexible EVM-oriented settlement environment.
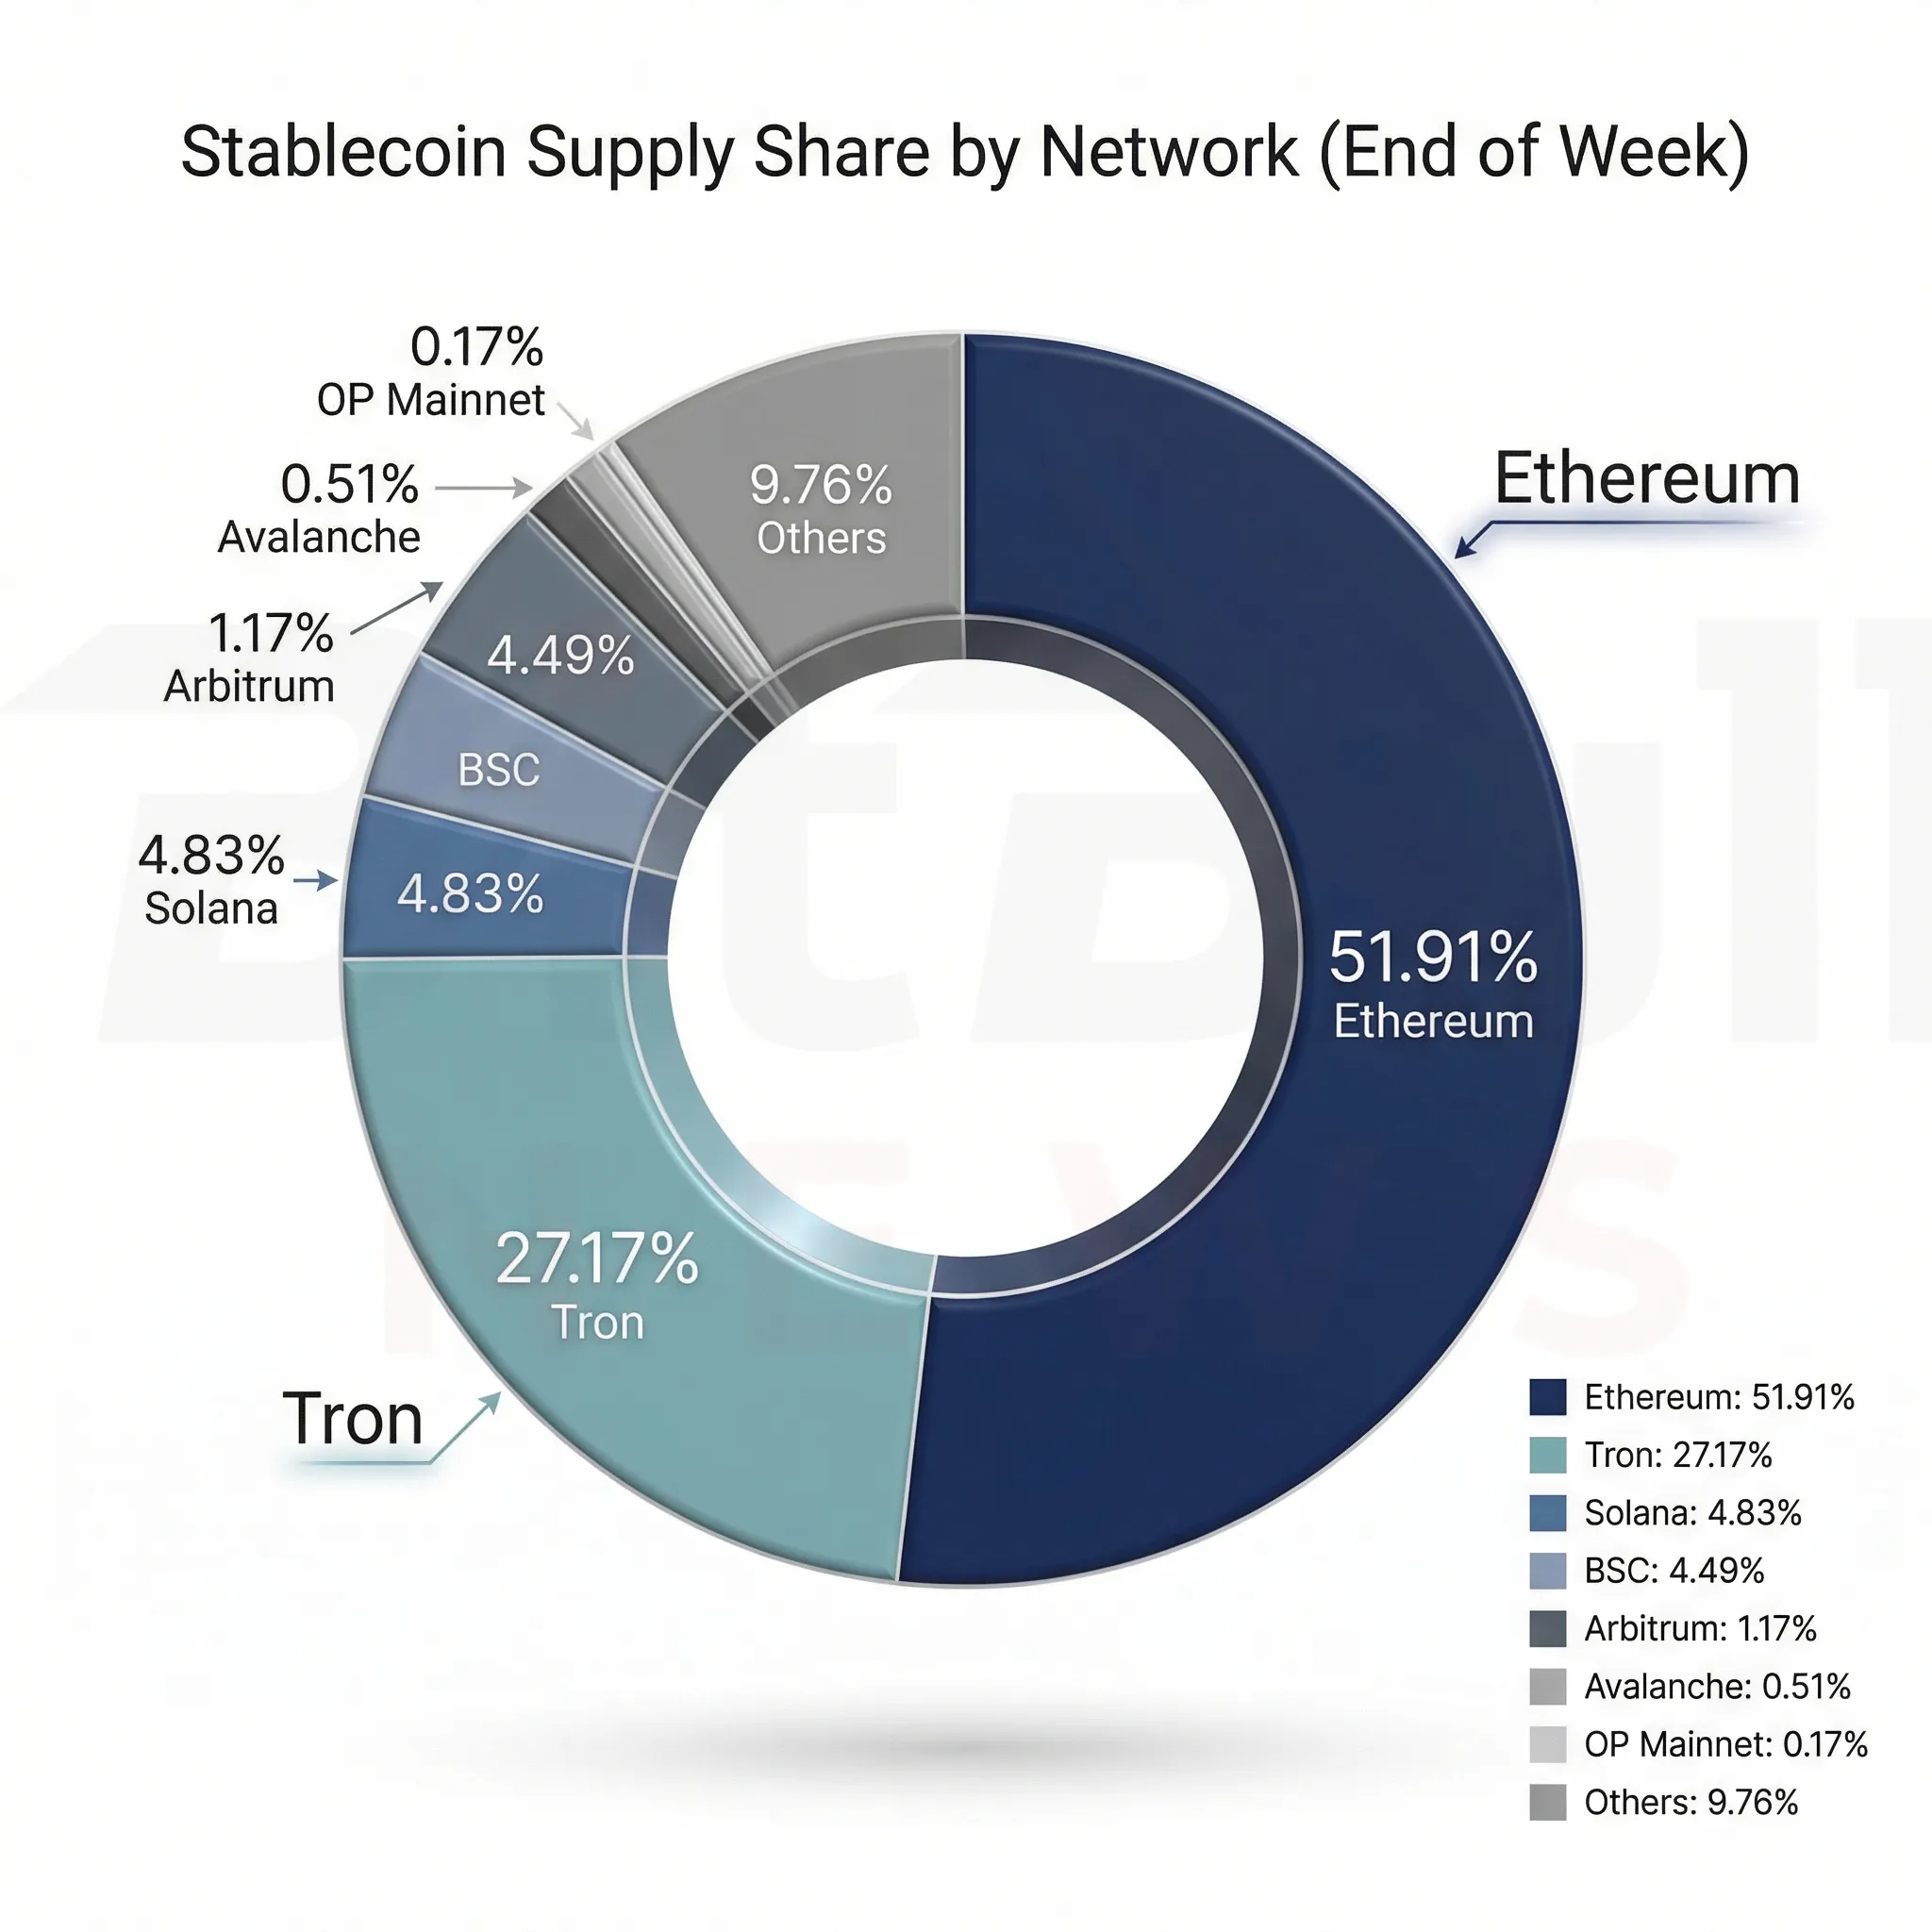
Ethereum and Tron still dominated total stablecoin supply, but weekly share gains favored Ethereum, BSC, and Arbitrum.
Destination Breakdown and Risk Regime
One of the strongest parts of this week’s source material is that it does not pretend to have perfect stablecoin routing labels for every venue. Instead, it combines measurable public data with activity proxies.
That means this week’s report reads stablecoin behavior through three layers:
- net supply changes by chain,
- selected large CEX deposit and reserve signals,
- DEX and perps activity as proxies for active deployment.
That framework matters because it helps answer a more useful question than “did supply go up?” The better question is: what kind of demand did the market express?
Table 2. Destination-category readout
| Destination category | What can be quantified | Key weekly evidence | Interpretation |
|---|---|---|---|
| CEX | Large one-day deposit + reserve snapshots | Reported +$2.2B USDT inflow to Binance on 18 Mar; exchange stablecoin reserves ~68.8B then ~68.2B around 48 hours later | Mixed: major dry-powder signal, but fast drawdown suggests rapid redeployment or withdrawal |
| DEX | 7d DEX volume by chain | Solana ~$12.25B (+3.62%), BSC ~$6.35B (-4.43%), Arbitrum ~$2.35B (-3.99%), Tron ~$585M (+43.24%), OP ~$153M (-4.99%) | Selective risk-on: Solana remained active despite stablecoin outflow; BSC/Arbitrum gained supply even with softer DEX volumes |
| Cross-chain bridges | Total bridge volume (all assets) | ~$3.398B over 7d; ~$698.6M over 24h | Heavy routing activity remained, though stablecoin-only bridge totals remain a data gap |
| Payments / merchant rails | Chain usage + dominance proxies | Tron at ~$86.08B stablecoins, ~98% USDT dominance, high active-address base | Large transactional footprint remains, but weekly contraction suggests some migration of transactional liquidity |
The week’s regime was mixed, but not random. The evidence points to selective risk deployment, not broad euphoria. Stablecoins increased on chains associated with trading and margin activity, while exchange-reserve behavior and post-deposit drawdowns hinted that some capital was moving quickly rather than building passively on venues.
Risk-On vs Defensive Signals
The week’s stablecoin pattern did not deliver a clean one-word answer. It was not fully risk-on, and it was not clearly defensive either. It showed both.
Risk-on signals
BSC and Arbitrum both added stablecoin supply at meaningful weekly rates. That is important because those chains are closely tied to lower-fee active trading and onchain derivatives loops.
Ethereum’s +$2.02B gain also matters in risk terms. It may reflect stablecoin issuance landing on Ethereum, capital preferring the deepest settlement layer, or both. Either way, it is not a sign of retreat. It is a sign that the market still wants large liquid dollar rails inside crypto.
Defensive or neutral signals
Tron and Solana both lost stablecoin supply, while Avalanche contracted sharply. Those are not catastrophic moves, but they do suggest capital was willing to leave some previously important stablecoin venues.
The exchange reserve snapshot also matters. The reported move from roughly $68.8B in stablecoin reserves on March 18 to $68.2B around two days later points to a market where capital can arrive at exchanges and disperse quickly. That pattern fits a market with high velocity and uncertain conviction.
The cleanest weekly interpretation is this: capital was willing to deploy, but only selectively, and often quickly.
Large Transactions, Whale Signals, and Bridge Activity
The standout datapoint this week was the reported $2.2 billion USDT inflow to Binance on March 18, described in the underlying report as the largest single-day stablecoin deposit since November 2025.
That matters because whale-scale stablecoin deposits tend to function as setup signals. They tell traders and risk managers that large buying power, hedging capital, or repositioning flows have arrived on a venue. But they do not, by themselves, reveal what happened next.
That is why the follow-on reserve drawdown is so important. If reserves rise and stay high, that often suggests dry powder is accumulating. If reserves spike and then fall quickly, it suggests the capital was deployed, withdrawn, or routed onward. This week looked much more like the second pattern.
Table 3. Observable large stablecoin flow signals
| Date | Signal | Observation |
|---|---|---|
| 2026-03-18 | Whale-scale exchange inflow | Reported +$2.2B USDT deposited to Binance |
| 2026-03-18 | Exchange reserve snapshot | Stablecoin reserves around $68.8B |
| 2026-03-20 | Follow-on reserve snapshot | Stablecoin reserves around $68.2B, roughly $0.6B lower |
That sequence points to high velocity, not passive accumulation.
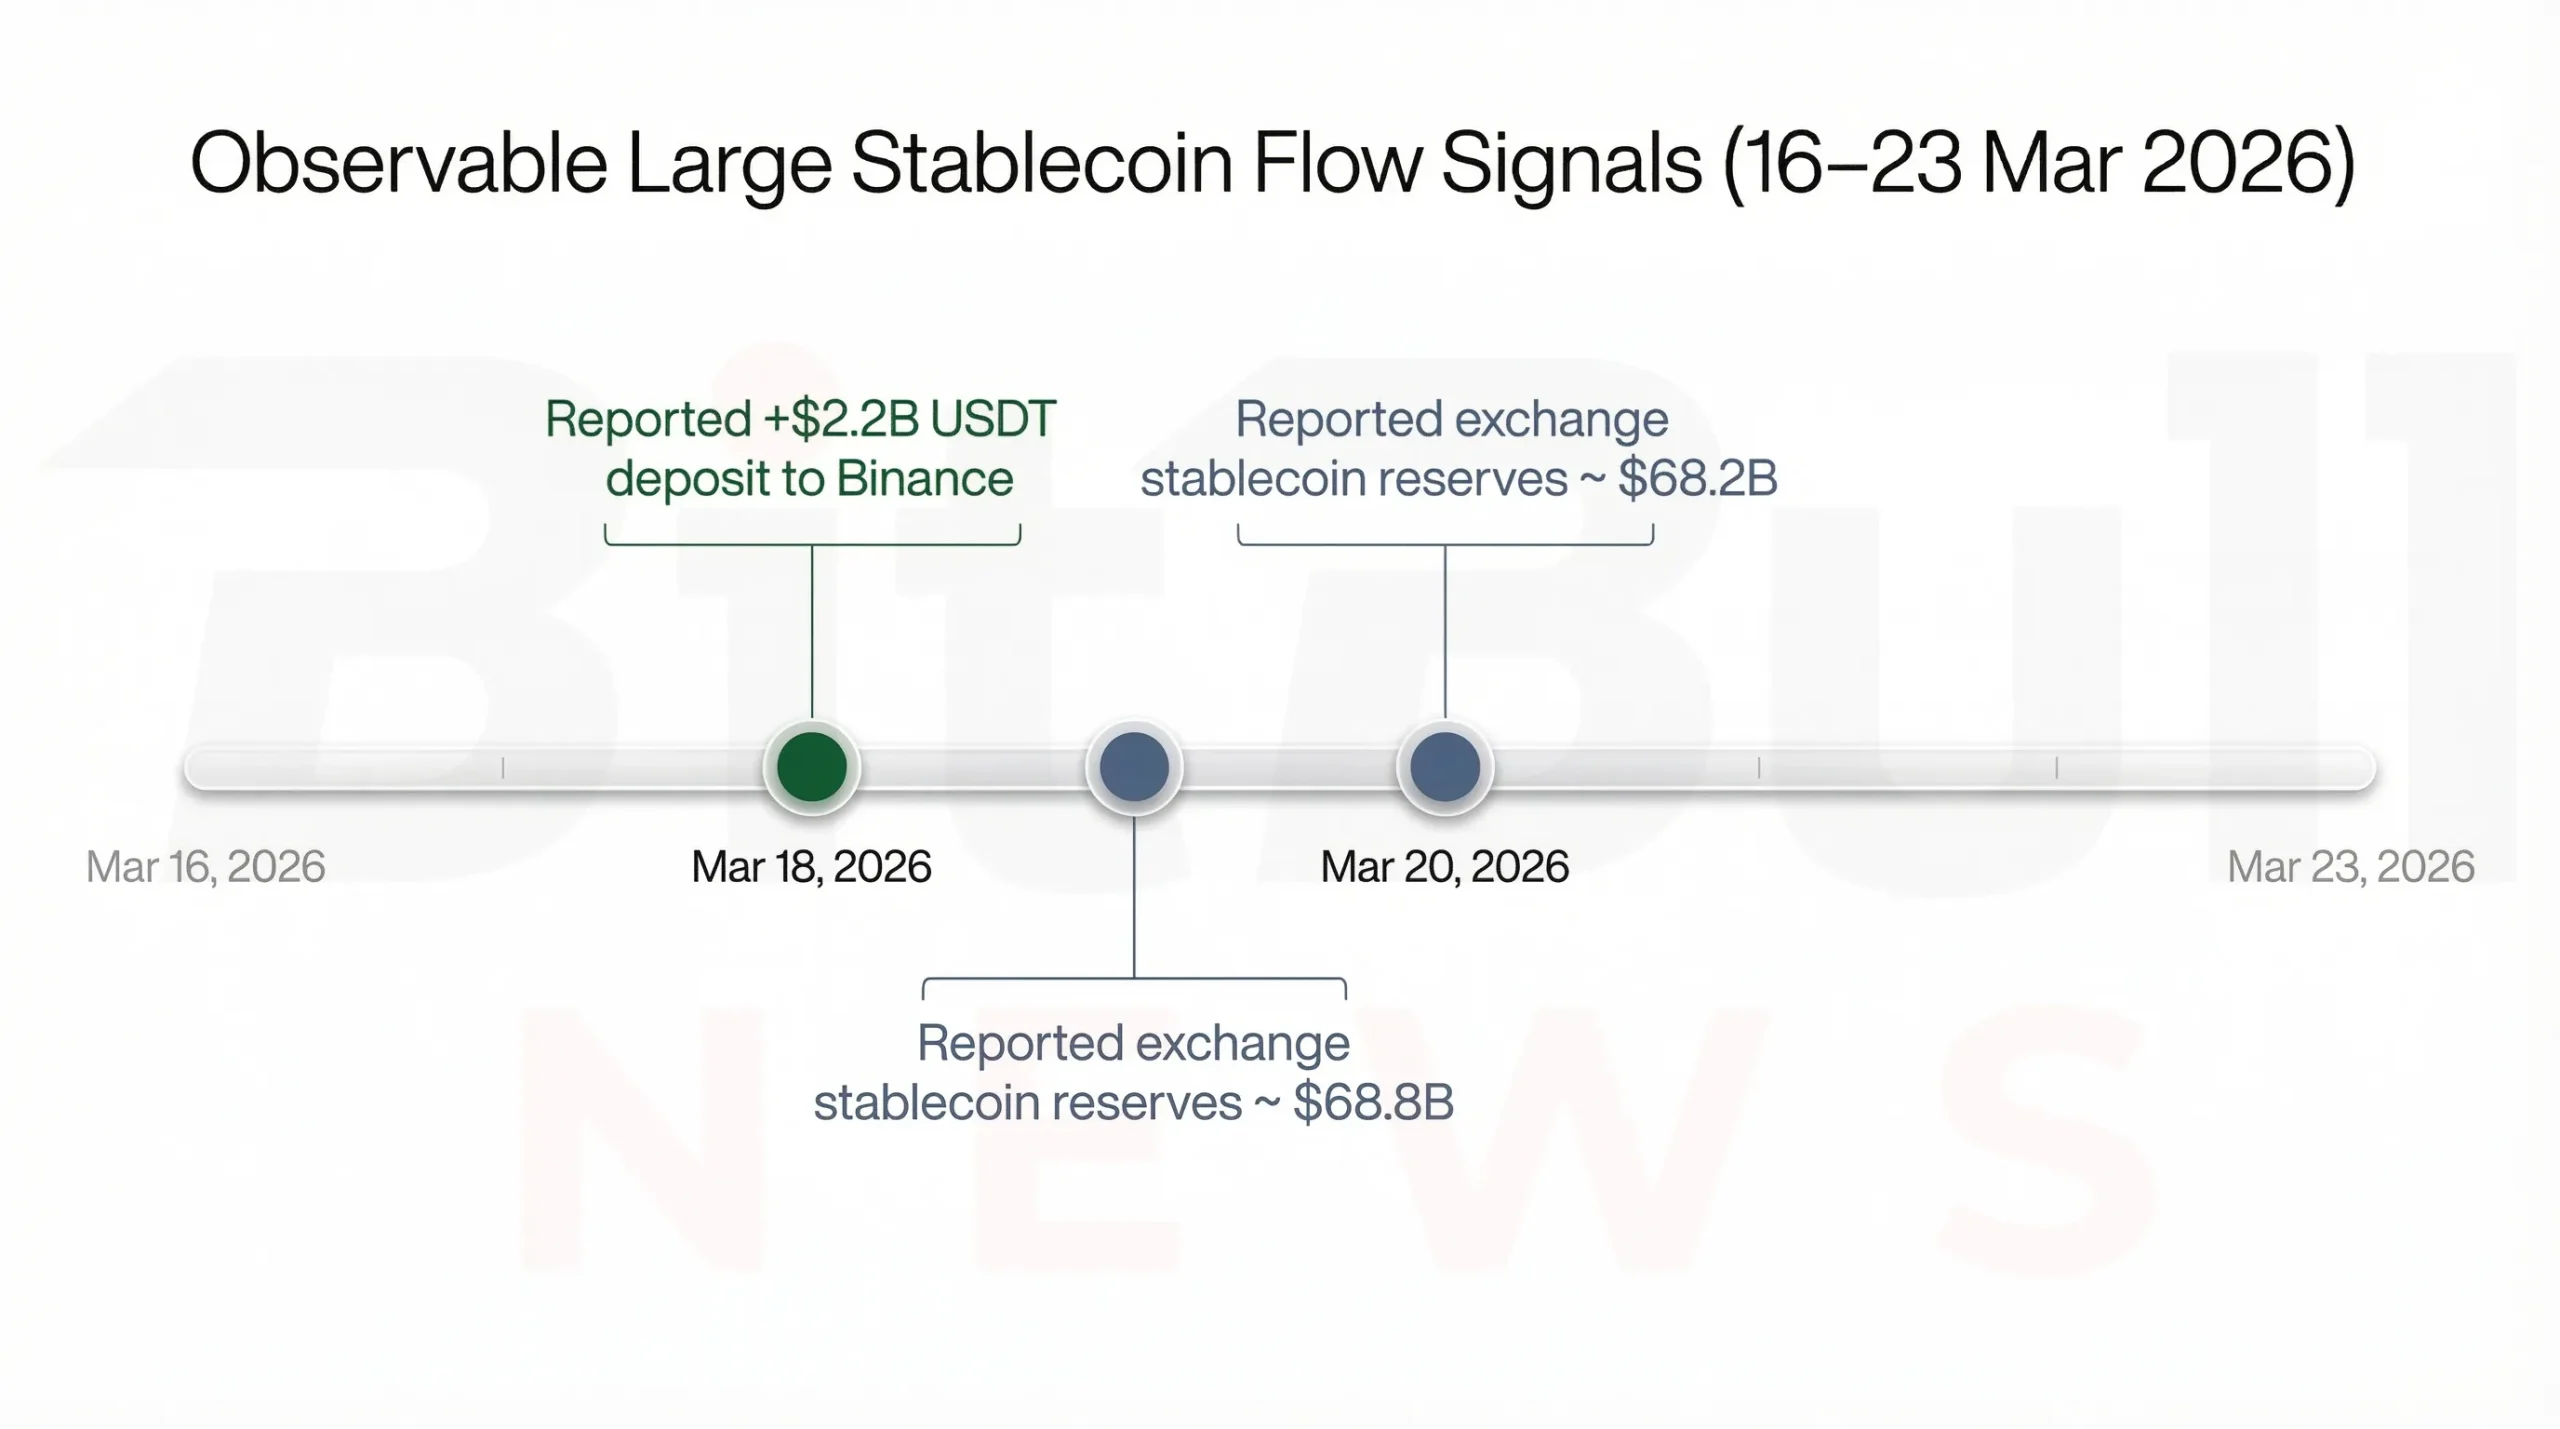
The week’s clearest whale signal was a reported $2.2B USDT inflow to Binance, followed by a rapid reserve drawdown that suggested high turnover rather than passive buildup.
Bridge Activity and Cross-Chain Routing
Bridge activity remained elevated at the marketwide level, with total cross-chain bridge volume around $3.398 billion over seven days and approximately $698.6 million over 24 hours in the cited public overview.
The open data does not provide a stablecoin-only bridge split for the week, so the report correctly avoids overclaiming. But the directional evidence still matters. When Ethereum, BSC, and Arbitrum gain stablecoin share while other chains contract, and total bridge volume stays heavy, it is reasonable to conclude that cross-chain routing played at least some role in re-forming liquidity on the EVM side — but that also reinforces the problem of blockchain fragmentation rather than solving it.
That matters operationally. A stablecoin market can look stable in aggregate while the actual usable liquidity base is being rebuilt on different chains. Traders, protocols, and liquidity providers feel that difference even when the headline market-cap chart barely moves.
What This Week Means in Context of the Previous One
This is where the report becomes more valuable as a series.
In the previous March 8–16 issue, the market looked defined by:
- a concentrated issuer structure,
- visible large mint events,
- and significant exchange outflow signals.
That week raised the question of whether stablecoin liquidity was becoming more mobile and less exchange-centered.
This week provides the next chapter. The answer is yes, but not evenly. Instead of a broad-based stablecoin expansion, the market expressed internal rotation:
- toward Ethereum in size,
- toward BSC and Arbitrum in tactical growth,
- away from Tron, Solana, and Avalanche at the margin,
- and through whale-scale venue movement that dispersed quickly after arrival.
That is exactly why this report should be read as a continuation, not a reset. The stablecoin market is showing a sequence: issuance and exchange outflows first, then chain-level reallocation and selective deployment.
Implications for Traders, Risk Managers, and Protocol Teams
Traders
The weekly picture supports a market where selective opportunities matter more than broad beta. BSC and Arbitrum gained supply quickly, while Tron and Solana lost some. That pattern often aligns with traders favoring specific venue and collateral environments rather than treating all chains equally.
The key lesson is to treat large exchange deposits as setup signals, not conclusions. What matters most is what reserves do next.
Risk managers
Concentration remains the biggest structural issue. Tron is still about 27% of all stablecoin supply and remains almost entirely USDT-dominated. That means issuer and rail risk can still propagate widely.
The sharp decline on Avalanche also matters. Smaller ecosystems can lose liquidity quickly even when the overall stablecoin market looks stable.
Protocol teams
Ethereum remains the deepest settlement magnet. BSC and Arbitrum showed the strongest tactical supply growth rates. Protocols that rely on stablecoin liquidity should pay close attention to where share is being won, not just where total size already exists.
BitBullNews View
This week did not produce a stablecoin shock. It produced a clearer map of the market’s current preferences.
Liquidity remained inside the system, but it did not spread evenly. Ethereum consolidated its role as the primary settlement base. BSC and Arbitrum gained tactical relevance. Tron stayed enormous, but slipped at the margin. Solana remained active in DEX terms, but lost stablecoin supply. Avalanche looked most fragile in percentage terms.
That makes the weekly picture constructive, but selective. The market still has dollar liquidity. It is just more deliberate now about where that liquidity wants to live.
Key Findings
- Total stablecoin market cap ended the week around $316.86B, up roughly $981.5M or 0.31%.
- Ethereum led weekly inflows with around +$2.02B.
- BSC added roughly +$493M, and Arbitrum added around +$203M.
- Tron lost around -$739M, Solana -$382M, and Avalanche -$199M.
- USDT dominance remained high at about 58.09%.
- A reported $2.2B USDT deposit to Binance was the clearest whale-scale signal of the week.
- Exchange reserve snapshots suggested that large venue inflows were followed by rapid dispersal.
- Bridge activity stayed elevated, consistent with ongoing cross-chain liquidity rerouting.
Final Verdict
Weekly verdict: Selective rotation, not broad inflow
The week of March 16–23 was not defined by a surge in total stablecoin demand. It was defined by where existing demand moved. Stablecoin liquidity rotated toward Ethereum, BSC, and Arbitrum, while Tron, Solana, and Avalanche lost share. Exchange behavior showed high turnover rather than passive buildup, and the market continued to reward deeper or more tactically useful settlement environments.
The clearest conclusion is this:
stablecoin growth remained modest, but internal reallocation became the real story.