


Content
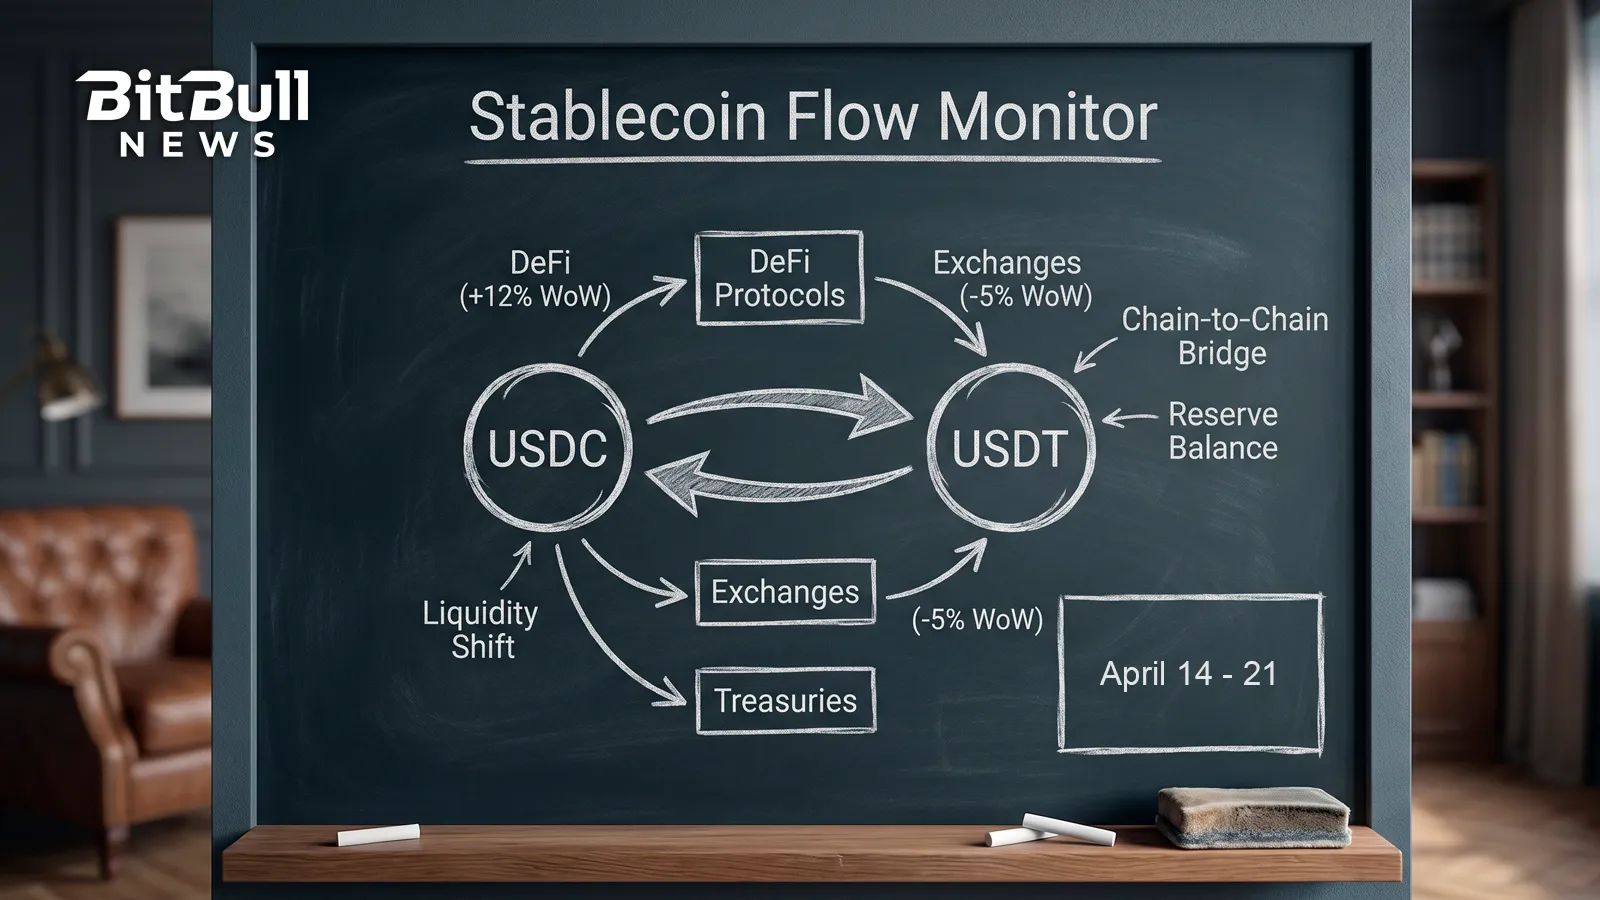
Stablecoin liquidity kept growing in the week of April 14–21, but the market stopped behaving like it was in a clean expansion phase.
The strongest signal in the uploaded report is straightforward: total stablecoin market cap still rose, but only modestly. The nearest end-window public snapshot put the market at $320.433 billion, up $467.35 million over seven days, or +0.15%. That is still a positive liquidity impulse, but it is much softer than the prior early-April build and too small to describe as broad fresh dry powder rushing into crypto.
The more useful story was chain-by-chain. Ethereum’s stablecoin balance slipped 0.33% over seven days, but Ethereum DEX volume jumped 76.53% and perps volume rose 7.2%. That combination usually means the market did not need large new stablecoin inflows onto Ethereum to trade harder — it used balances that were already there. By contrast, Base and BSC both grew stablecoin balances and also posted stronger DEX activity, which looks more like fresh liquidity arriving and getting put to work.
So the week’s cleanest conclusion is not “bullish” or “defensive” in isolation. It is more precise than that: aggregate growth was defensive-to-neutral, while deployment became more selective and more venue-specific. That is a more helpful way to read a market where stablecoins are still growing, but not at a speed or breadth that confirms full-market risk-on behavior.
How This Extends the Previous Research
This issue reads best as a continuation of our previous Stablecoin Flow Monitor for April 6–13, 2026, not as a separate weekly reset.
Last week, the market added roughly $6.083 billion in stablecoin liquidity and looked stronger at the supply layer than at the deployment layer. This week, the opposite imbalance became clearer: growth slowed sharply at the aggregate level, but several chains still showed active venue-level risk deployment. In other words, the market moved from fresh supply entering the system to existing balances being used more selectively.
That shift matters because it changes how traders and investors should read stablecoin data. A rising supply number alone is not enough. The better question now is where balances are actually being spent — on Ethereum mainnet, on L2s like Base, on high-throughput transfer rails like Tron, or nowhere at all.
Market Structure Snapshot
The stablecoin market remained highly concentrated in the same two names that still define the category: USDT and USDC.
The report shows USDT dominance at 58.82% of all stablecoins, while official Circle materials placed USDC circulation around $78.2 billion on April 20 and DefiLlama’s own USDC page showed roughly $78.9 billion around the same period. That still leaves the market structurally split into two primary rails: USDT as the dominant global settlement and exchange dollar, and USDC as the dominant regulated, payments-oriented, and programmable dollar.
The long tail also matters more than it used to. Around the report window, the same report placed USDS near $8.6 billion, USDe around $5.8 billion, USD1 and PYUSD around $4.1 billion each, USDG around $2.08 billion, and USDD around $1.55 billion. That means “others” are no longer rounding error. They are now big enough to shape DeFi collateral, yield trades, payment routing, and treasury behavior in specific pockets of the market.
Table 1. Stablecoin market structure near the window
| Stablecoin | Approximate size near window | What it signals |
|---|---|---|
| USDT | Above $184B | Still the dominant global settlement and exchange stablecoin |
| USDC | ~$78.2B to ~$78.9B | Core regulated and programmable settlement rail |
| DAI | ~$4.61B | Legacy DeFi dollar, still relevant but no longer the main growth engine |
| BUSD | ~$40M native / ~$233M Binance-Peg | Residual rather than macro-relevant |
| Others | Materially active | Important for DeFi carry, payments, and specialized liquidity |
Weekly Flow by Chain
The week’s most informative data came from chain-level balance shifts, not from the aggregate market-cap number.
Table 2. Chain-level stablecoin positioning
| Chain | Stablecoins mcap | 7D stablecoin change | Venue read |
|---|---|---|---|
| Ethereum | $166.396B | -0.33% | Stable balances down, trading activity sharply up |
| Tron | $87.062B | +0.66% | Settlement rail strength plus exchange-linked turnover |
| Solana | $14.659B | -1.47% | Very high turnover, weaker balance growth |
| BSC | $13.9B | +1.89% | Spot-led, modestly risk-on |
| Base | $4.975B | +3.66% | Fresh balances plus app / spot deployment |
| Arbitrum | $3.933B | +2.25% | Positive, but less clean timing alignment |
| Optimism | $580.17M | +0.18% | Mild activity, leverage weak |
Ethereum remained the largest balance sheet in the system, but it did not absorb fresh stablecoin supply in the same way as earlier in April. Instead, it looked like a venue where balances already on-chain got activated. Base and BSC looked more constructive at the balance layer, while Solana’s read was more about speed of turnover than about balance-sheet growth. Tron remained its own category: not a pure DeFi venue, but still one of the market’s most important stablecoin highways.
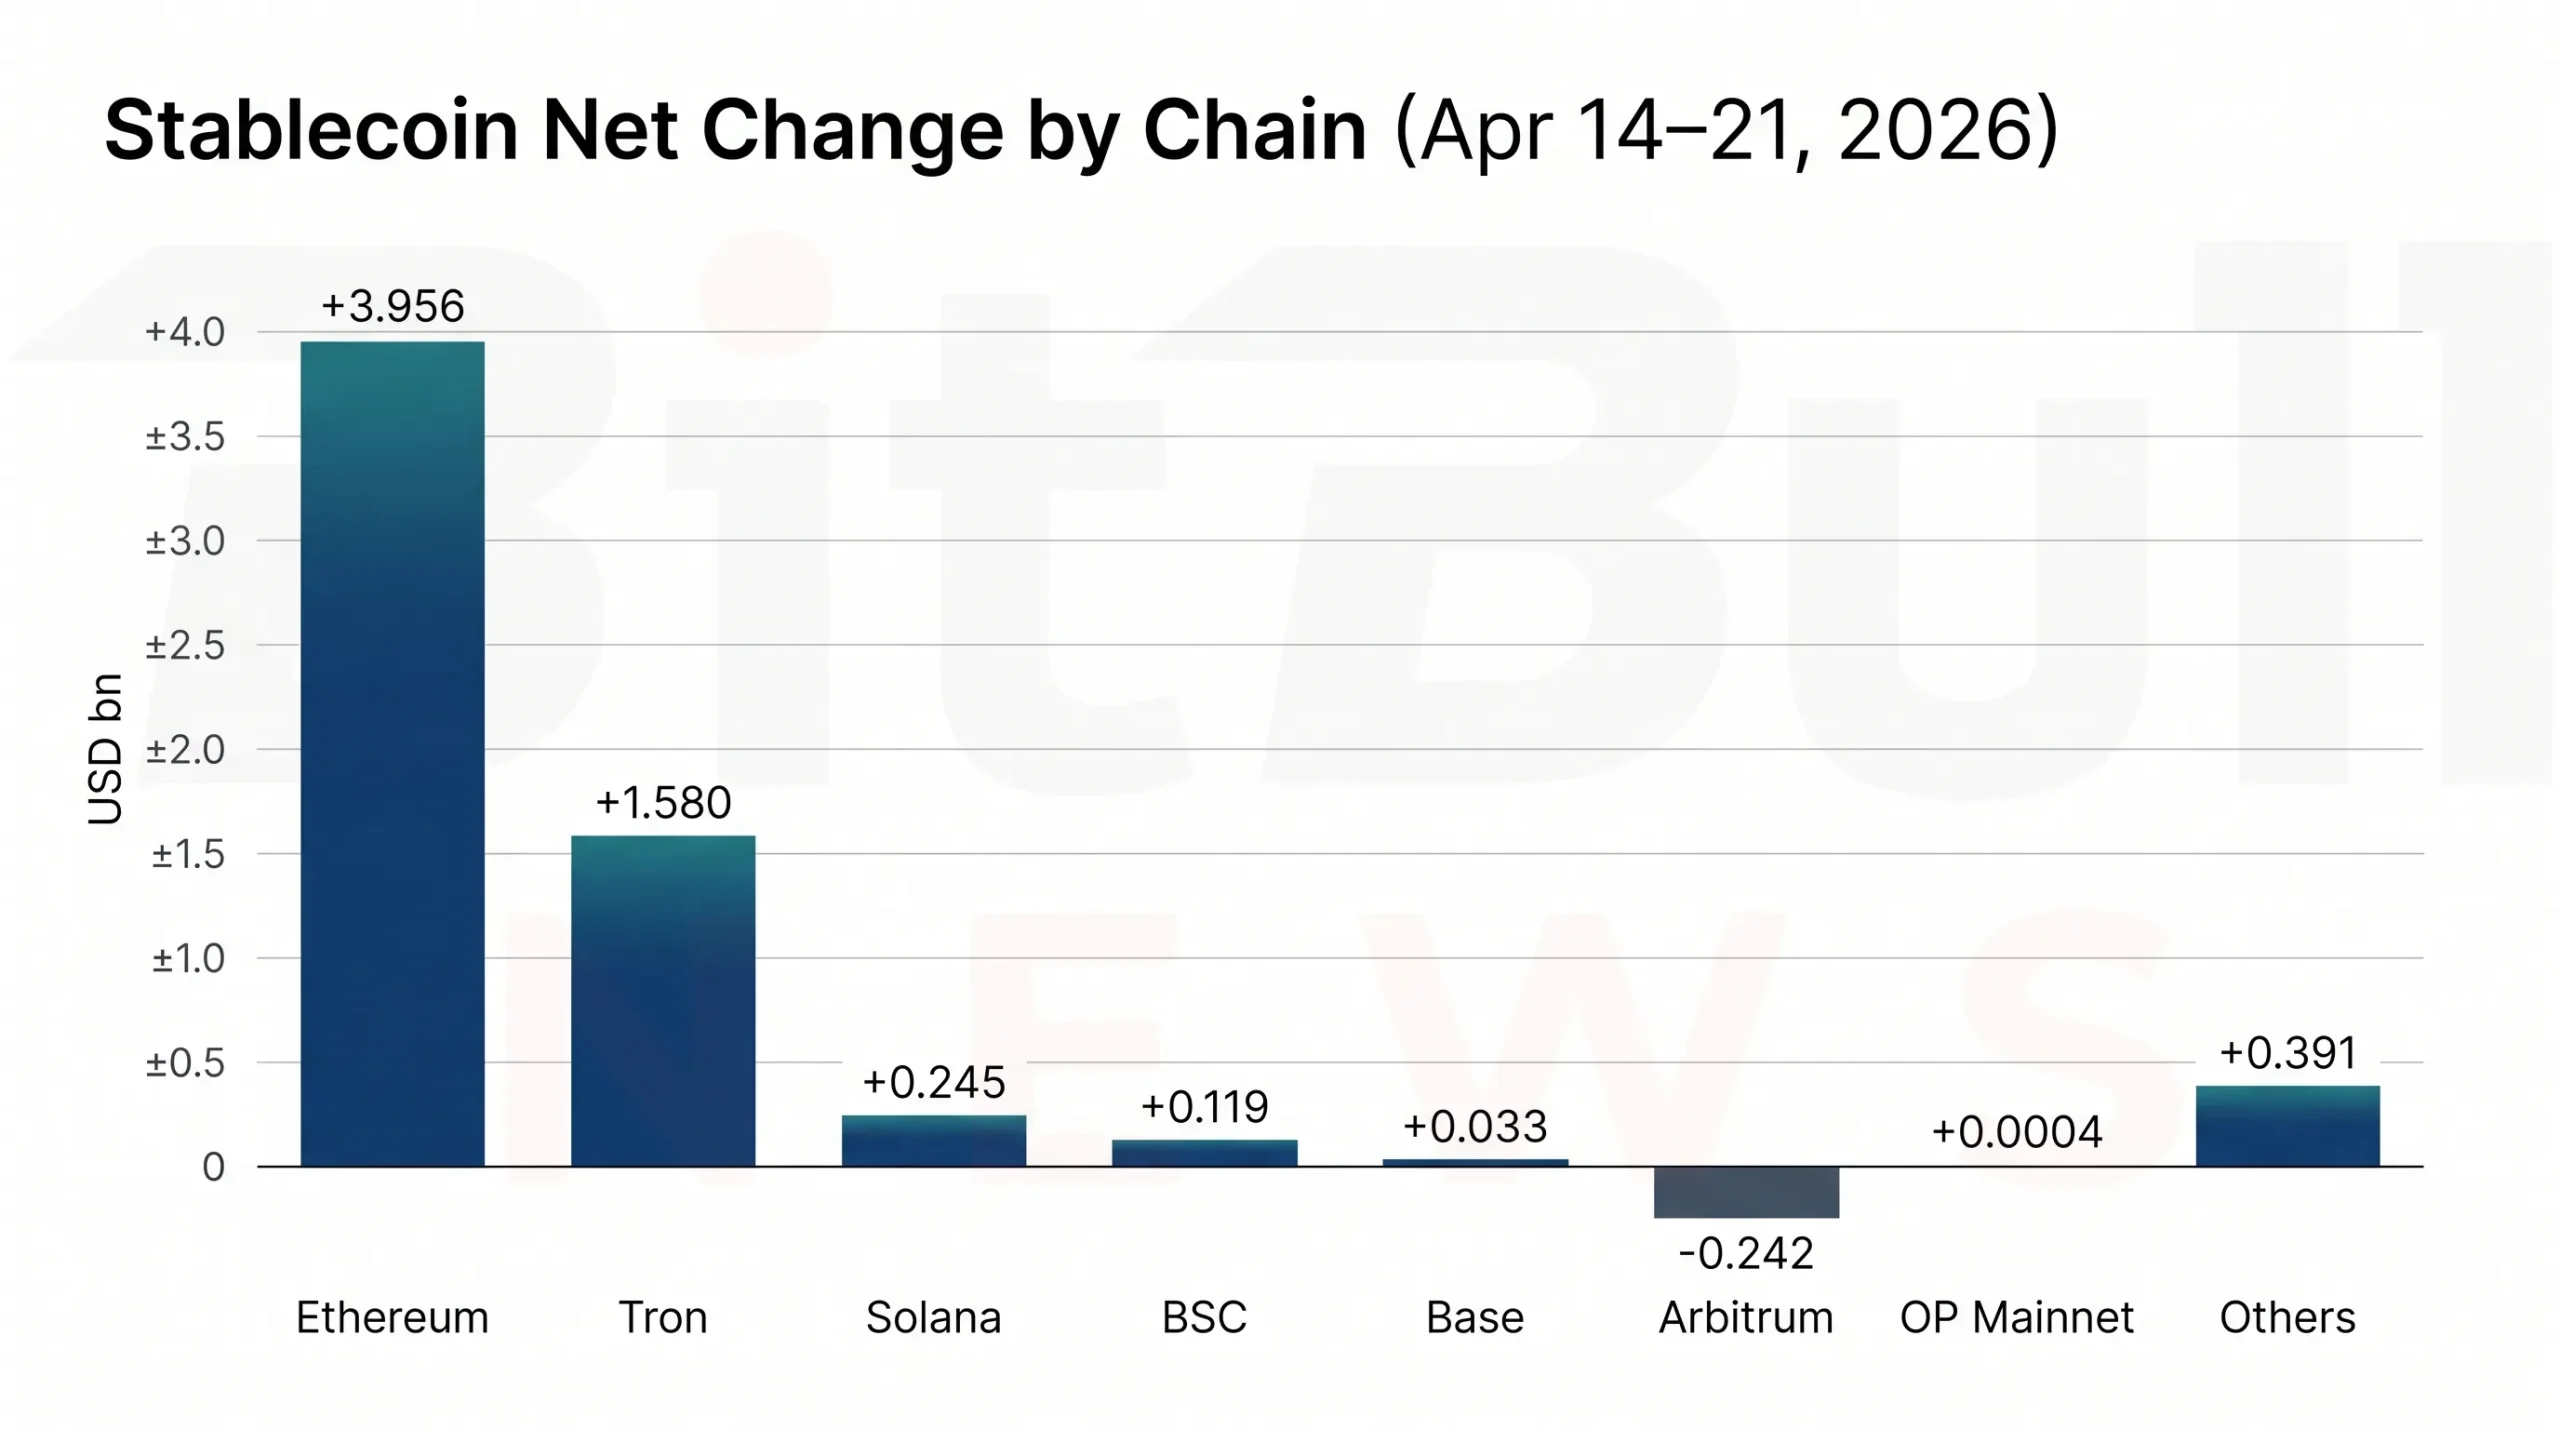
Chart 1. The strongest fresh stablecoin growth stayed concentrated in the biggest settlement rails and a small set of selective risk venues.
Ethereum: The Strongest Deployment Signal of the Week
Ethereum produced the clearest “risk-on deployment” signal in the entire report.
Stablecoin balances fell slightly, but DEX volume rose 76.53% and perps volume rose 7.2%. That is exactly the sort of pattern that usually means idle balances were converted into actual trading, hedging, leverage, and collateral use. It is not as clean as seeing both stablecoin balances and venue activity rise together, but it is still a strong sign that Ethereum was the market’s most important risk-on pocket during the week.
That is also why Ethereum still deserves top billing in stablecoin analysis even when some faster chains post stronger percentage moves. Ethereum remains the place where balance-sheet scale, DeFi counterparties, perps activity, and institutional-grade liquidity still come together most clearly.
Base and BSC: Fresh Liquidity, But Mostly Spot-Led
Base and BSC both looked healthier than a simple “cash parking” interpretation would suggest.
Base rose to $4.975 billion in stablecoin market cap, up 3.66% over seven days, while DEX weekly volume rose 7.83%. But perps volume fell 18.44%, which implies the new balances were more likely going into apps, spot activity, and general liquidity than into leverage-heavy positioning. BSC looked similar, but more explicitly spot-led: stablecoins rose 1.89%, DEX volume rose 10.66%, and perps were basically flat at -0.32%.
That makes both chains important to watch. They did not confirm a broad speculative blowoff, but they did show that some of the week’s fresh balances found useful homes outside Ethereum. In market-structure terms, that is more constructive than merely watching supply grow without any corresponding venue activity.
Tron: Still the Main USDT Settlement Highway
Tron continued to underline the difference between a payments-and-settlement chain and a DeFi-native chain.
The report puts Tron at $87.062 billion in stablecoins, up 0.66% on the week, with USDT dominance at 97.84%. DEX weekly volume rose 50.87% and perps rose 15.87%, but those numbers still need to be read through Tron’s structure: this remains a network where stablecoin growth often means settlement, exchange logistics, transfer activity, and remittance-style behavior as much as pure DeFi risk-on.
That interpretation lines up with BitBullNews’ recent coverage of TRON’s Q4 report: $2.2T stablecoin settlement, 994M transactions, which described the network as a stablecoin-first system built around settlement and cross-border value transfer rather than around a classic Ethereum-style DeFi mix.
Solana and Optimism: High Activity, Less Convincing Balance Growth
Solana’s nearest public read showed $14.659 billion in stablecoins, down 1.47% over seven days, with DEX volume up only 0.91% and perps down 0.61%. The read here is not that Solana turned weak. It is that it remained a high-turnover system without clear balance-sheet growth, which is different from saying fresh stablecoin demand arrived there in size.
Optimism was even more selective. Stablecoins rose only 0.18%, DEX volume rose 11.93%, but perps fell a sharp 53.32%. That is not a dead week. It is a week where incremental activity looked real, but the leverage layer looked soft.
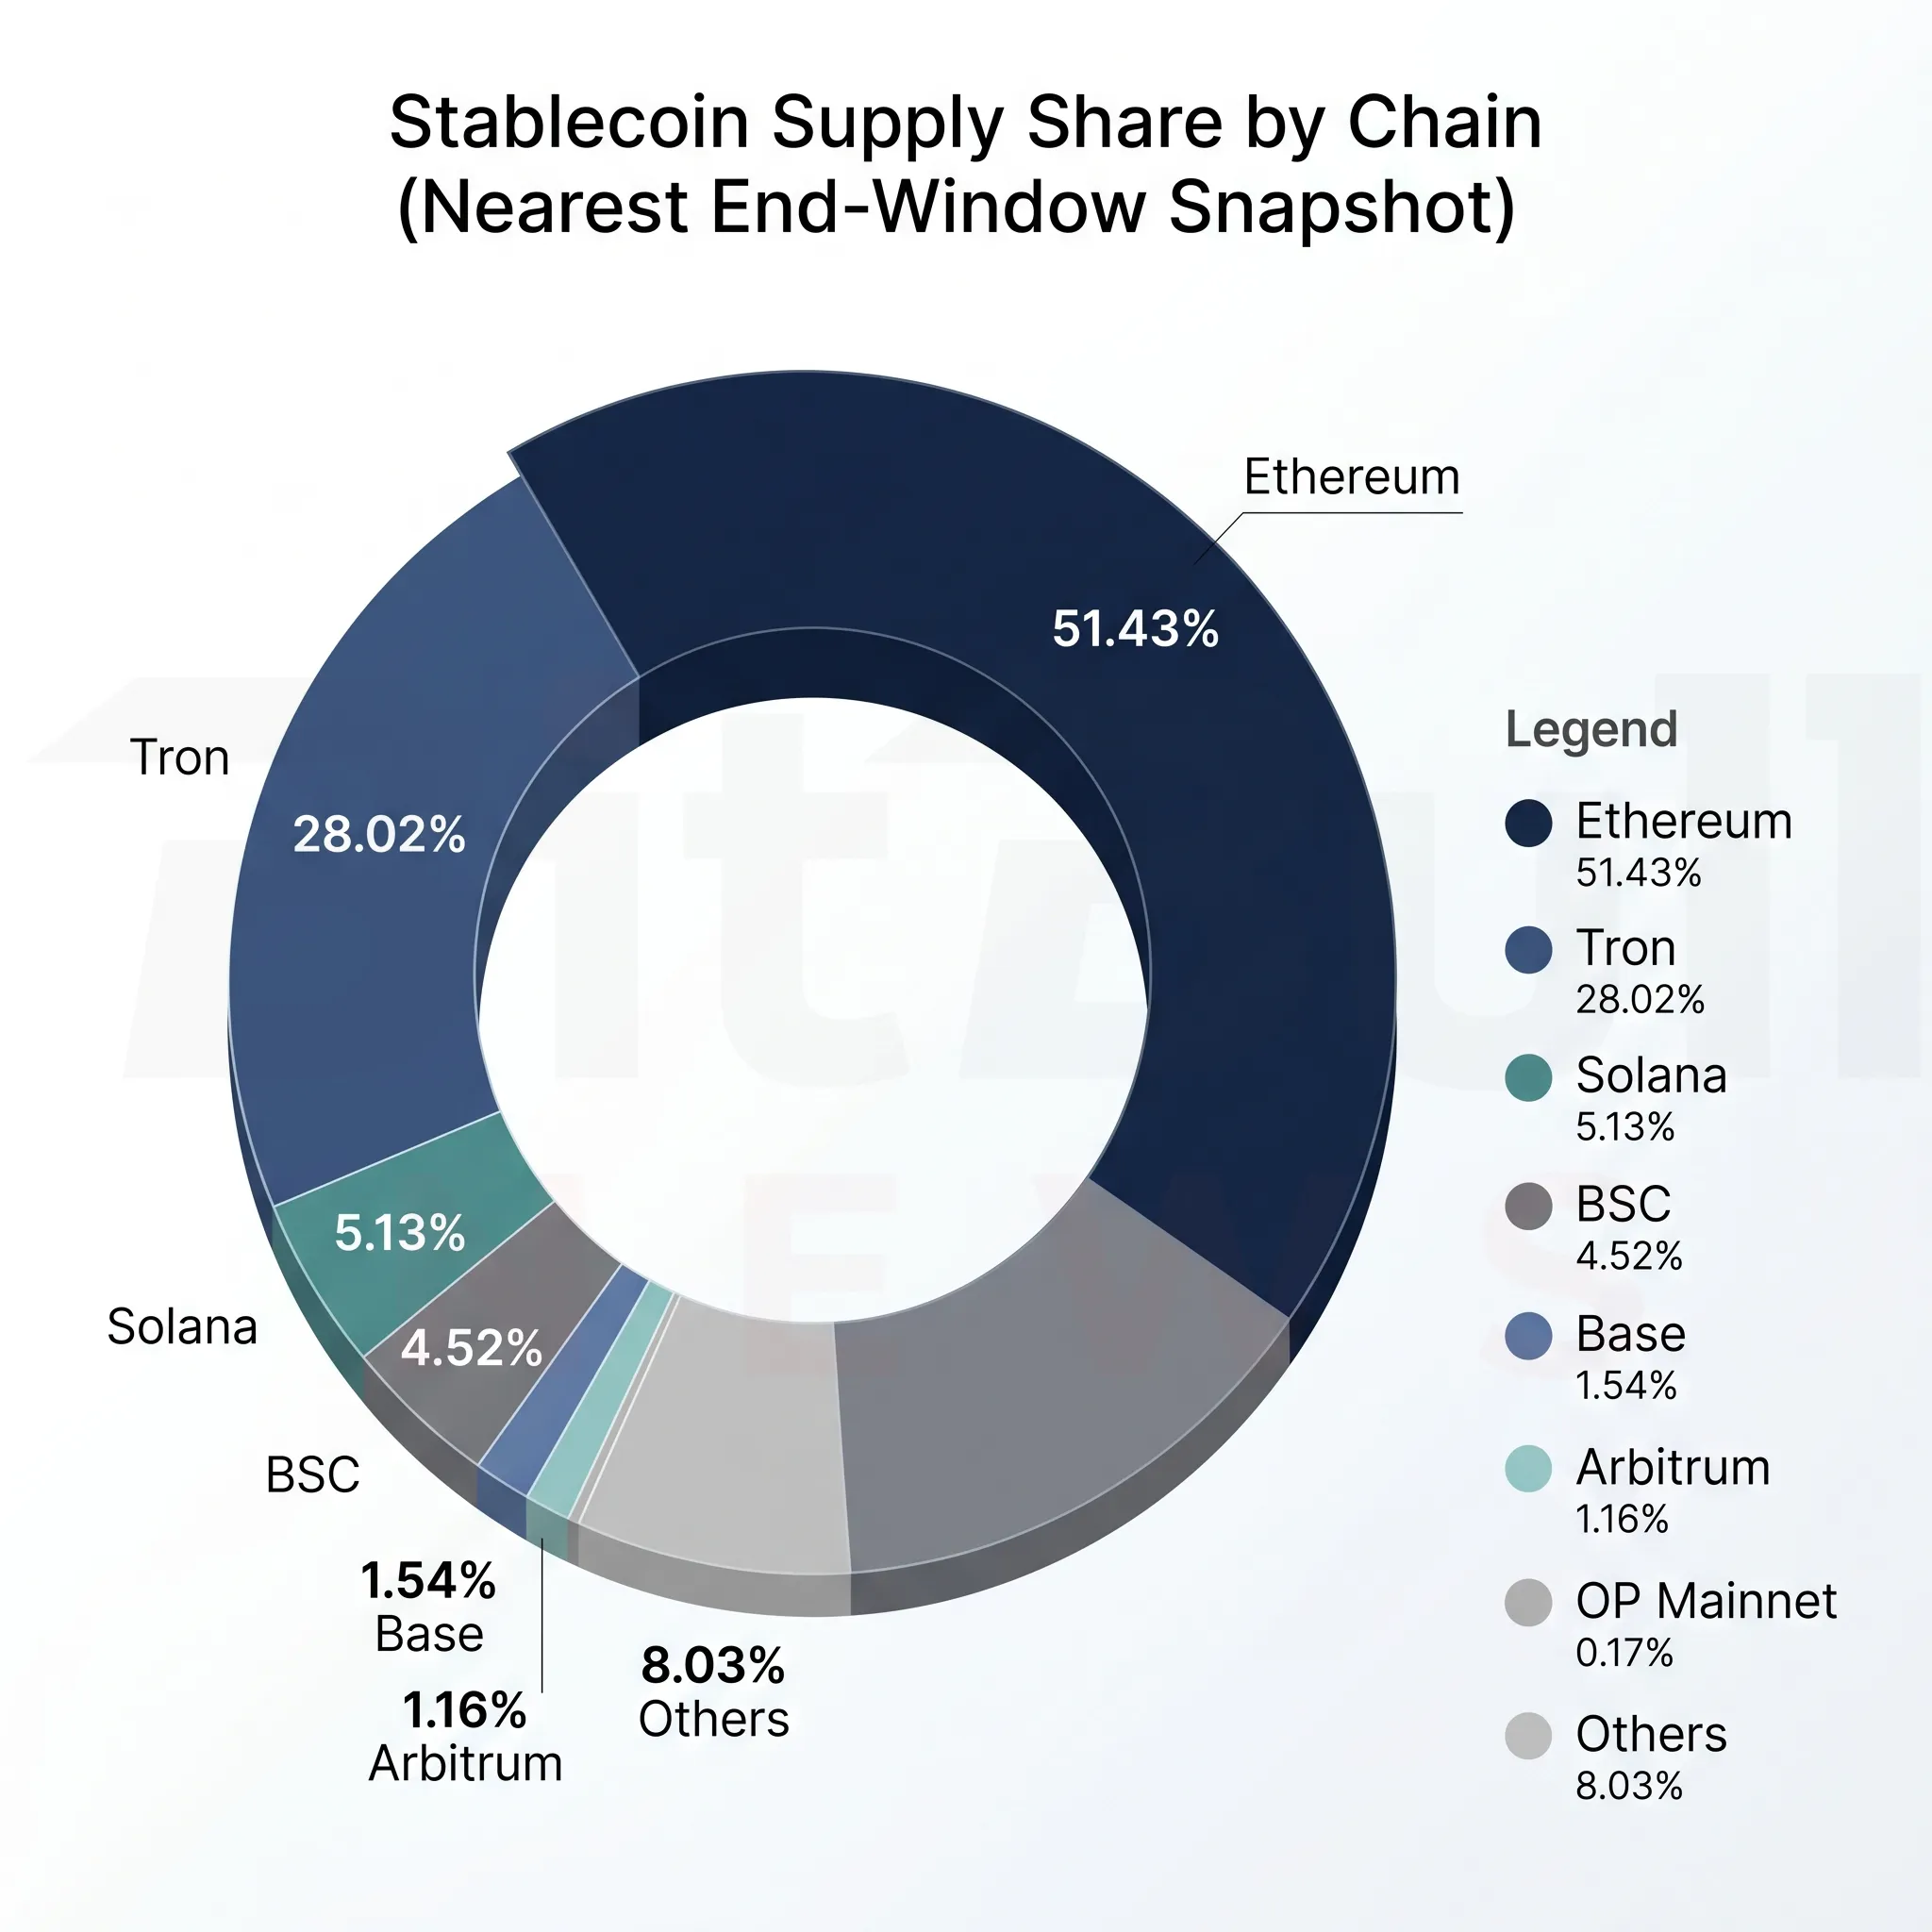
Chart 2. Even in a week of selective deployment, stablecoin balances remained overwhelmingly concentrated on Ethereum and Tron.
Payments, Wallets, and Infrastructure: Why Venue Context Matters
The week’s issuer-side developments help explain why not all stablecoin activity should be treated as a trading signal.
The report highlights two important product moves. Tether launched tether.wallet on April 14, extending USDT into a broader consumer-facing wallet layer. Circle launched CPN Managed Payments on April 8, positioning USDC more explicitly as managed settlement infrastructure for PSPs, banks, fintechs, and enterprises. Those are not direct weekly flow numbers, but they matter because they point to venue specialization. USDT leaned further into global wallet and payments reach, while USDC leaned further into regulated settlement plumbing.
That is also why BitBullNews’ recent coverage of Circle Arc, a stablecoin-focused Layer 1 using USDC for gas fits this week’s read so well. The core idea there was not “more trading.” It was stablecoins becoming purpose-built financial infrastructure — for payments, collateral, tokenized assets, and programmable settlement.
Risk Appetite: Defensive in Aggregate, Risk-On in Pockets
This is the cleanest one-line interpretation of the week:
Defensive at the aggregate supply layer, selectively risk-on at the venue layer.
That phrase from the report is worth keeping, because it explains the week better than a simpler bullish or bearish label would. Aggregate stablecoin growth of +0.15% is too small to describe as a powerful new outside-capital wave. But chain-by-chain activity shows that several venues still turned more active, especially Ethereum, and to a lesser degree BSC, Base, Tron, and Optimism.
The deeper point is that traders should stop asking only whether stablecoin supply is growing. In weeks like this one, the more useful question is where balances are being activated. When supply growth is soft but venue activity rises in specific ecosystems, the market is not out of capital. It is choosing where to spend it.
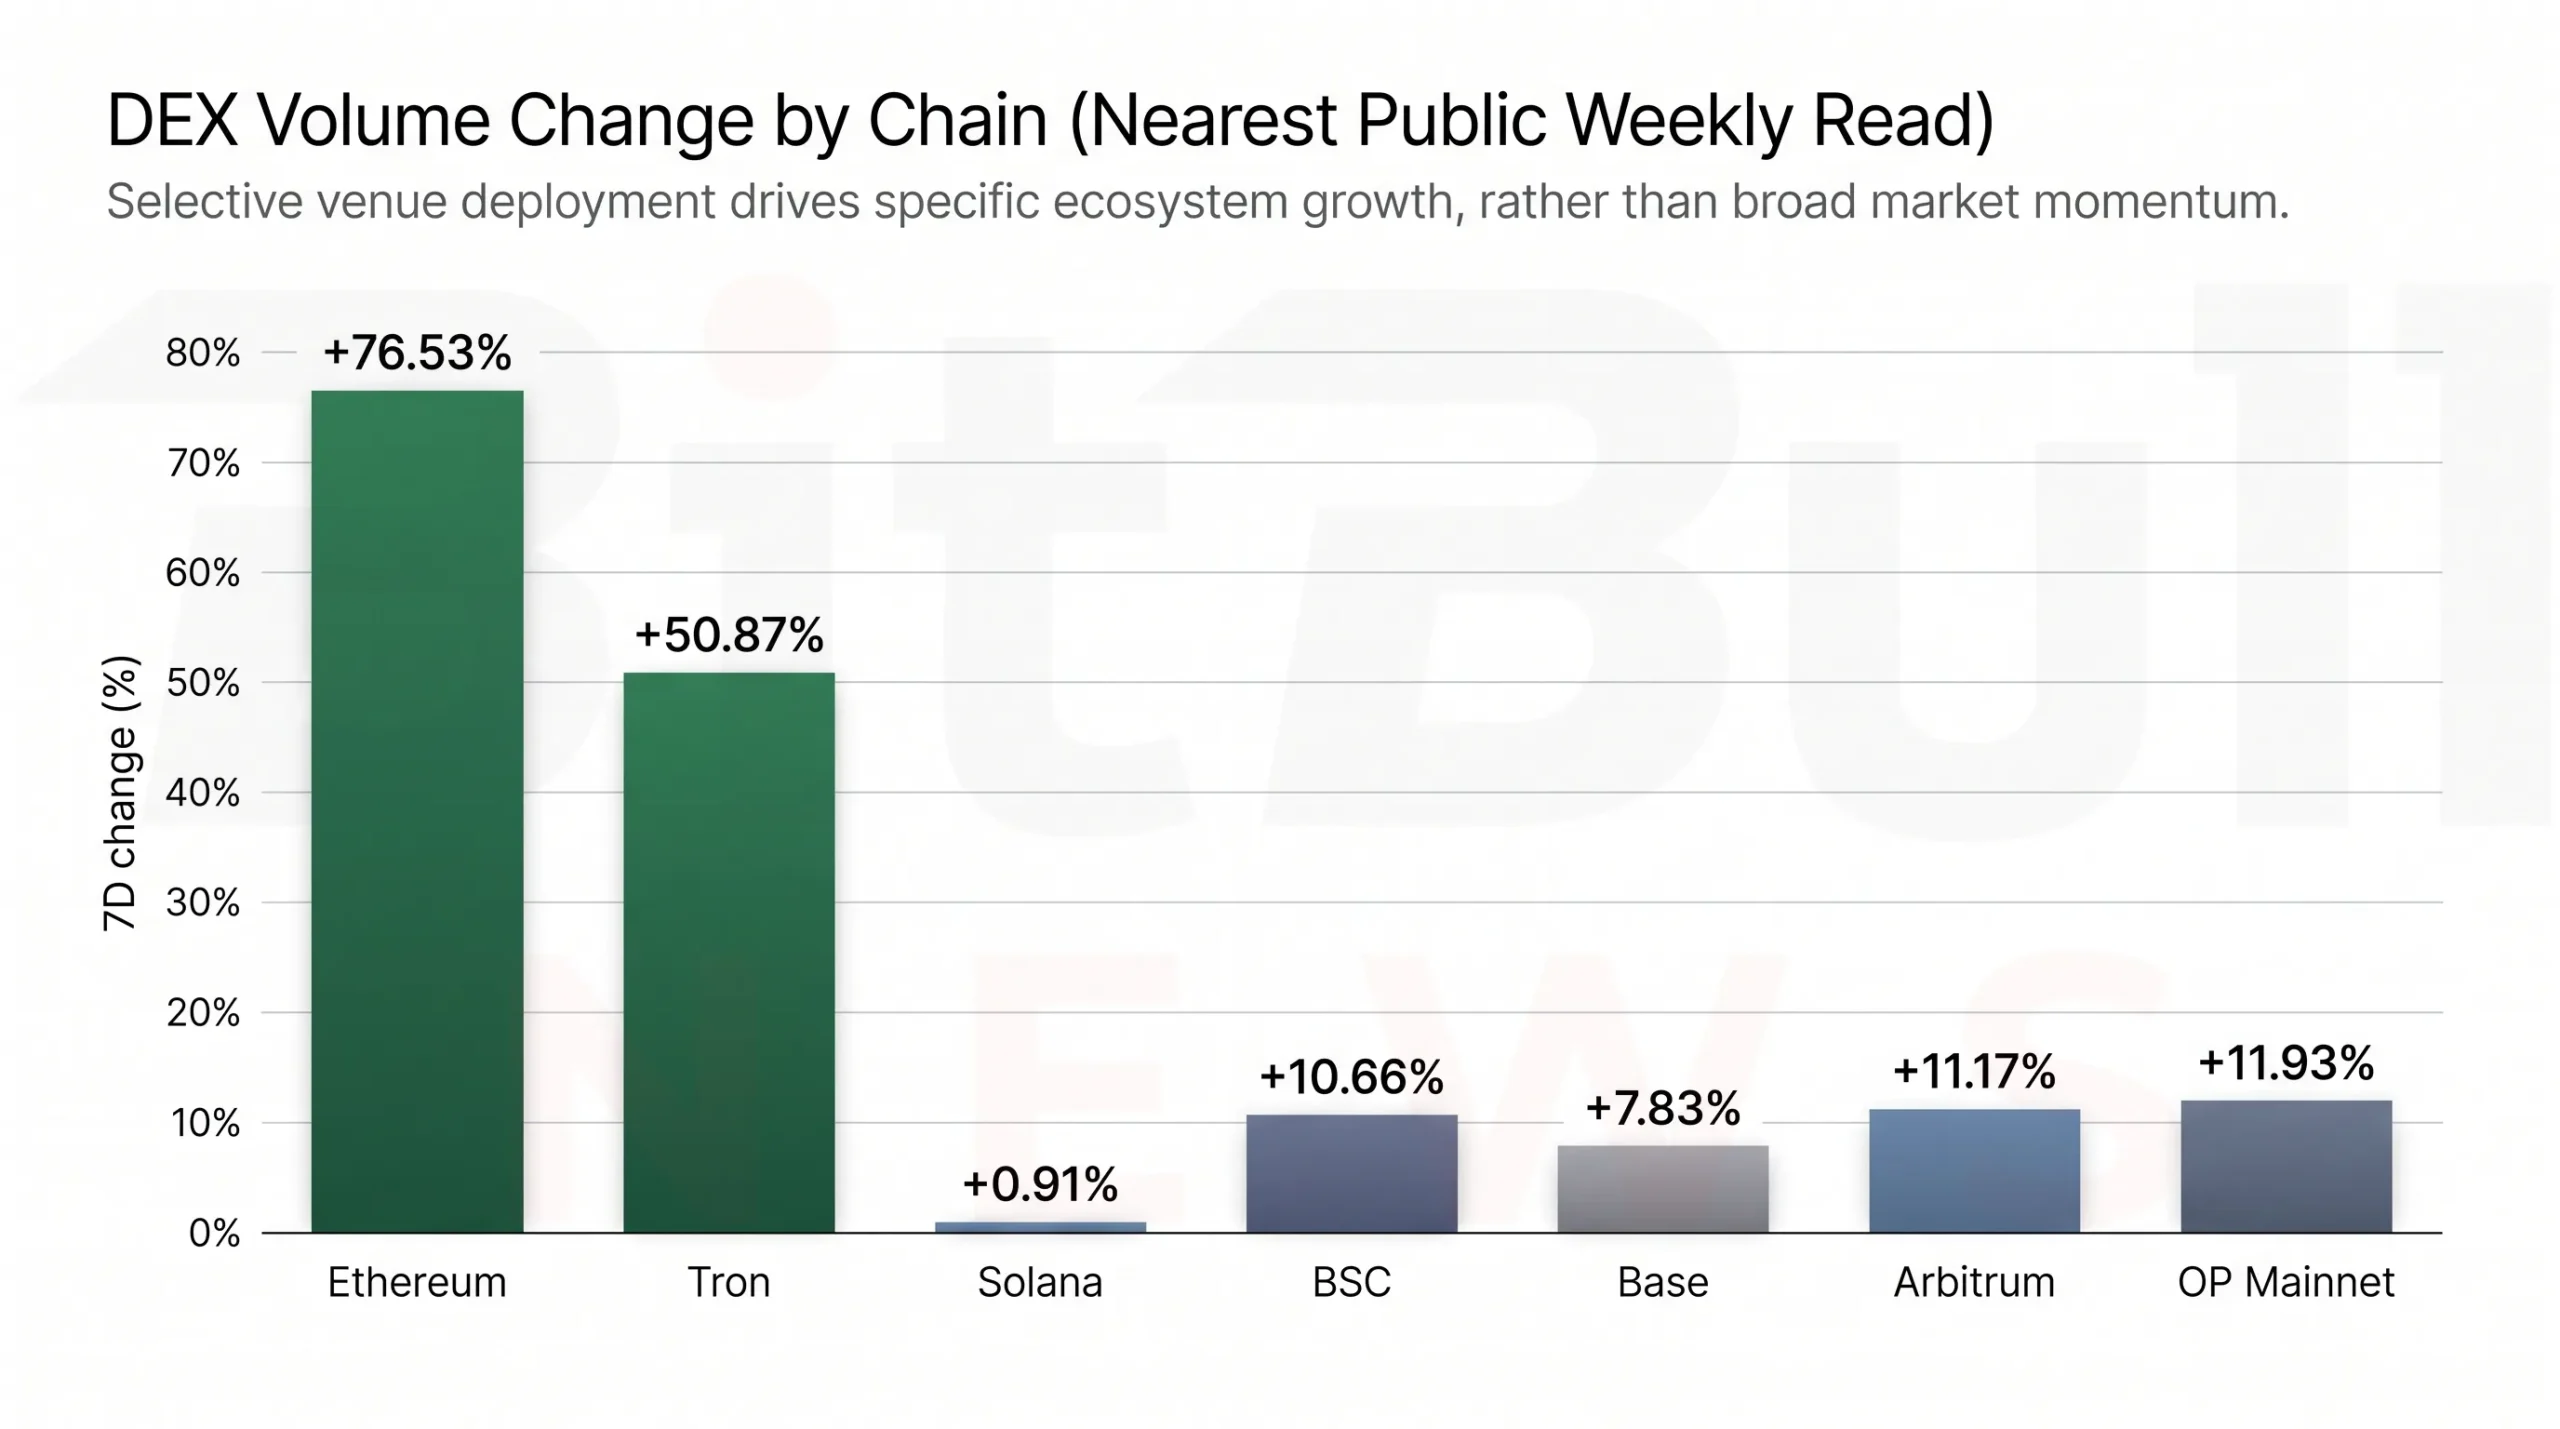
Chart 3. Venue deployment was strongest on Ethereum and Tron, with Base, BSC, Optimism, and the nearest public Arbitrum read also positive, even as the aggregate supply backdrop stayed modest.
Why This Matters for the Next Week
The next weekly print matters more than usual because this week’s signals were directionally positive but incomplete.
If stablecoin balances start to rise more convincingly again and Ethereum, Base, BSC, and the other active venues keep their DEX and perps momentum, the market will have a much stronger case for calling the move a broader risk-on reacceleration. But if stablecoin growth stays muted while only a few chains show strong activity, the market will still look more like selective reallocation than like a fresh system-wide liquidity wave.
That makes this week useful for readers because it is a better people-first signal than raw market cap alone. It tells you not only whether stablecoin balances changed, but how those balances likely behaved once they were already inside the system.
BitBullNews View
From a BitBullNews perspective, the market did not become uniformly stronger this week. It became more revealing.
Ethereum showed the strongest evidence of balances being turned into risk activity. Base and BSC looked constructive in a more spot-led way. Tron stayed structurally important, but for reasons that still mix payments, settlement, and exchange turnover rather than pure DeFi appetite. The aggregate supply number improved only slightly, which means the market is still relying more on smart deployment of existing liquidity than on a broad new wave of stablecoin creation.
That is a more useful conclusion than simply saying “stablecoins were up.” They were. But the market’s real message was about where that money wanted to work.
Key Findings
- Total stablecoin market cap rose to $320.433B, up $467.35M (+0.15%) over seven days.
- Ethereum stablecoin balances fell 0.33%, but Ethereum DEX volume rose 76.53% and perps volume rose 7.2%.
- Base stablecoins rose 3.66% and BSC stablecoins rose 1.89%, both alongside stronger DEX activity.
- Tron remained overwhelmingly USDT-dominant (97.84%) and grew 0.66% on the week.
- Solana stablecoins fell 1.47%, while Optimism rose only 0.18% and showed much weaker perps activity.
- The week’s best read was defensive in aggregate, selectively risk-on by venue.
Final Verdict
Weekly verdict: Selective deployment, softer supply impulse.
The week of April 14–21 did not deliver a broad stablecoin-led breakout. It delivered a quieter but still important message: stablecoin balances kept growing, just not fast enough to confirm a new market-wide liquidity surge, while several key venues — especially Ethereum — showed that existing balances were being put back to work.
The clearest conclusion is this:
The market did not add a lot of new dry powder, but it did become more efficient about deploying the dry powder it already had.