


Content
The week of April 6–13 marked a clear step up in stablecoin creation versus the prior issue, but not a clean transition into broad risk-on conditions.
The uploaded report shows total stablecoin market cap at $307.544B on DefiLlama’s chain aggregation, with a 7-day increase of +$6.083B (+2.02%). That is materially stronger than the prior issue’s “modest build” tone and is consistent with fresh stablecoin demand entering crypto rails through a combination of net issuance and cross-chain redistribution rather than pure internal reshuffling alone.
But the second half of the picture matters just as much. The same report shows broader DEX spot volume down about 15.05% week over week and broader perps volume down about 8.9%, even as total stablecoin supply expanded. That combination usually points to a market where liquidity is being added faster than it is being deployed into higher-beta trading or leverage. The best description is still mixed, but with more upside in the headline supply data than in the venue-activity data.
Continuity With the Previous Issue
This issue works best as a continuation of the prior BitBullNews Stablecoin Flow Monitor: March 30–April 6, 2026, not as a standalone reset.
Last week, the central conclusion was “modest build, softer deployment.” Stablecoin balances were rising, but not fast enough to call the environment fully risk-on, and deployment signals lagged supply growth. This week extends that framework in a more forceful direction: supply expansion accelerated sharply, but deployment still did not broaden enough across the full market to justify an outright bullish liquidity verdict.
There is one important methodological caveat. The prior issue leaned more heavily on dashboard-level totals around $317.106B, while this week’s uploaded report explicitly uses DefiLlama’s chain aggregation at $307.544B. Those top-line levels are therefore not perfectly stackable as a clean two-point systemwide time series. The more reliable continuity read is chain direction, deployment quality, and the relationship between stablecoin growth and trading activity, not the raw difference between those two headline totals.
Market Structure Snapshot
Even with the methodology caveat, the structural message is straightforward: the market remains highly concentrated and still routes most of its stablecoin balance sheet through a small number of issuers and chains.
The uploaded report places the week’s market at $307.544B, with Ethereum at $158.177B, Tron at $86.163B, Solana at $15.782B, BSC at $13.888B, Base at $4.729B, Arbitrum at $3.572B, and OP Mainnet at $0.535B. That leaves Ethereum with 51.43% of the chain-aggregated total and Tron with 28.02%, meaning those two chains alone account for almost four-fifths of tracked stablecoin liquidity in this week’s framework.
The report also reiterates the current issuer hierarchy: USDT at roughly $185B, USDC around $76B, DAI around $4.49B, with BUSD reduced to legacy relevance and a growing “other” category that increasingly includes products such as USDS, USDe, USD1, PYUSD, BUIDL, USYC, and USDY. That matters because the market’s liquidity profile is still overwhelmingly shaped by the top two fiat-backed dollars, even as newer products gain specific niche roles.
Table 1. Stablecoin market structure by chain
| Chain | Stablecoins mcap end | Net 7D change | Share of total |
|---|---|---|---|
| Ethereum | $158.177B | +$3.956B | 51.43% |
| Tron | $86.163B | +$1.580B | 28.02% |
| Solana | $15.782B | +$0.245B | 5.13% |
| BSC | $13.888B | +$0.119B | 4.52% |
| Base | $4.729B | +$0.033B | 1.54% |
| Arbitrum | $3.572B | -$0.242B | 1.16% |
| OP Mainnet | $0.535B | +$0.0004B | 0.17% |
| Others | $24.698B | +$0.391B | 8.03% |
This table is the clearest evidence that the week’s new stablecoin supply was not distributed evenly. Ethereum and Tron absorbed the bulk of it, while Arbitrum was the standout negative.
Weekly Flow by Chain
The strongest network-level expansion was concentrated on Ethereum and Tron.
Ethereum added roughly $3.956B (+2.56%) over the week. Tron added another $1.58B (+1.87%). Solana and BSC were also positive, but much more modestly, with +$245.29M and +$118.98M respectively. Base edged higher by +$33M, OP Mainnet was effectively flat, and Arbitrum contracted by -$242.06M (-6.35%).
That pattern matters because it shows the system was not simply “risk-on everywhere.” It was selective. The largest inflows went to the two chains that already function as the most important stablecoin settlement rails in crypto, while one of the most DeFi-forward L2s — Arbitrum — lost liquidity in stablecoin terms. That is more consistent with a market favoring core settlement layers and transfer rails than one chasing every risk venue simultaneously.
Fresh public DefiLlama chain pages also help sharpen the composition layer. Tron currently shows USDT dominance at 97.79%, Solana shows USDC dominance at 52.41%, BSC shows USDT dominance at 63.37%, Base shows USDC dominance at 89.98%, Arbitrum shows USDC dominance at 57.26%, OP Mainnet shows USDC dominance at 41.20%, and Avalanche — while outside the report’s main table — is down 1.38% on the week with USDC dominance at 40.73%. That makes the network map easier to interpret: Tron remains overwhelmingly a USDT transfer rail, while Solana, Base, Arbitrum, and OP Mainnet remain much more USDC-heavy execution environments.
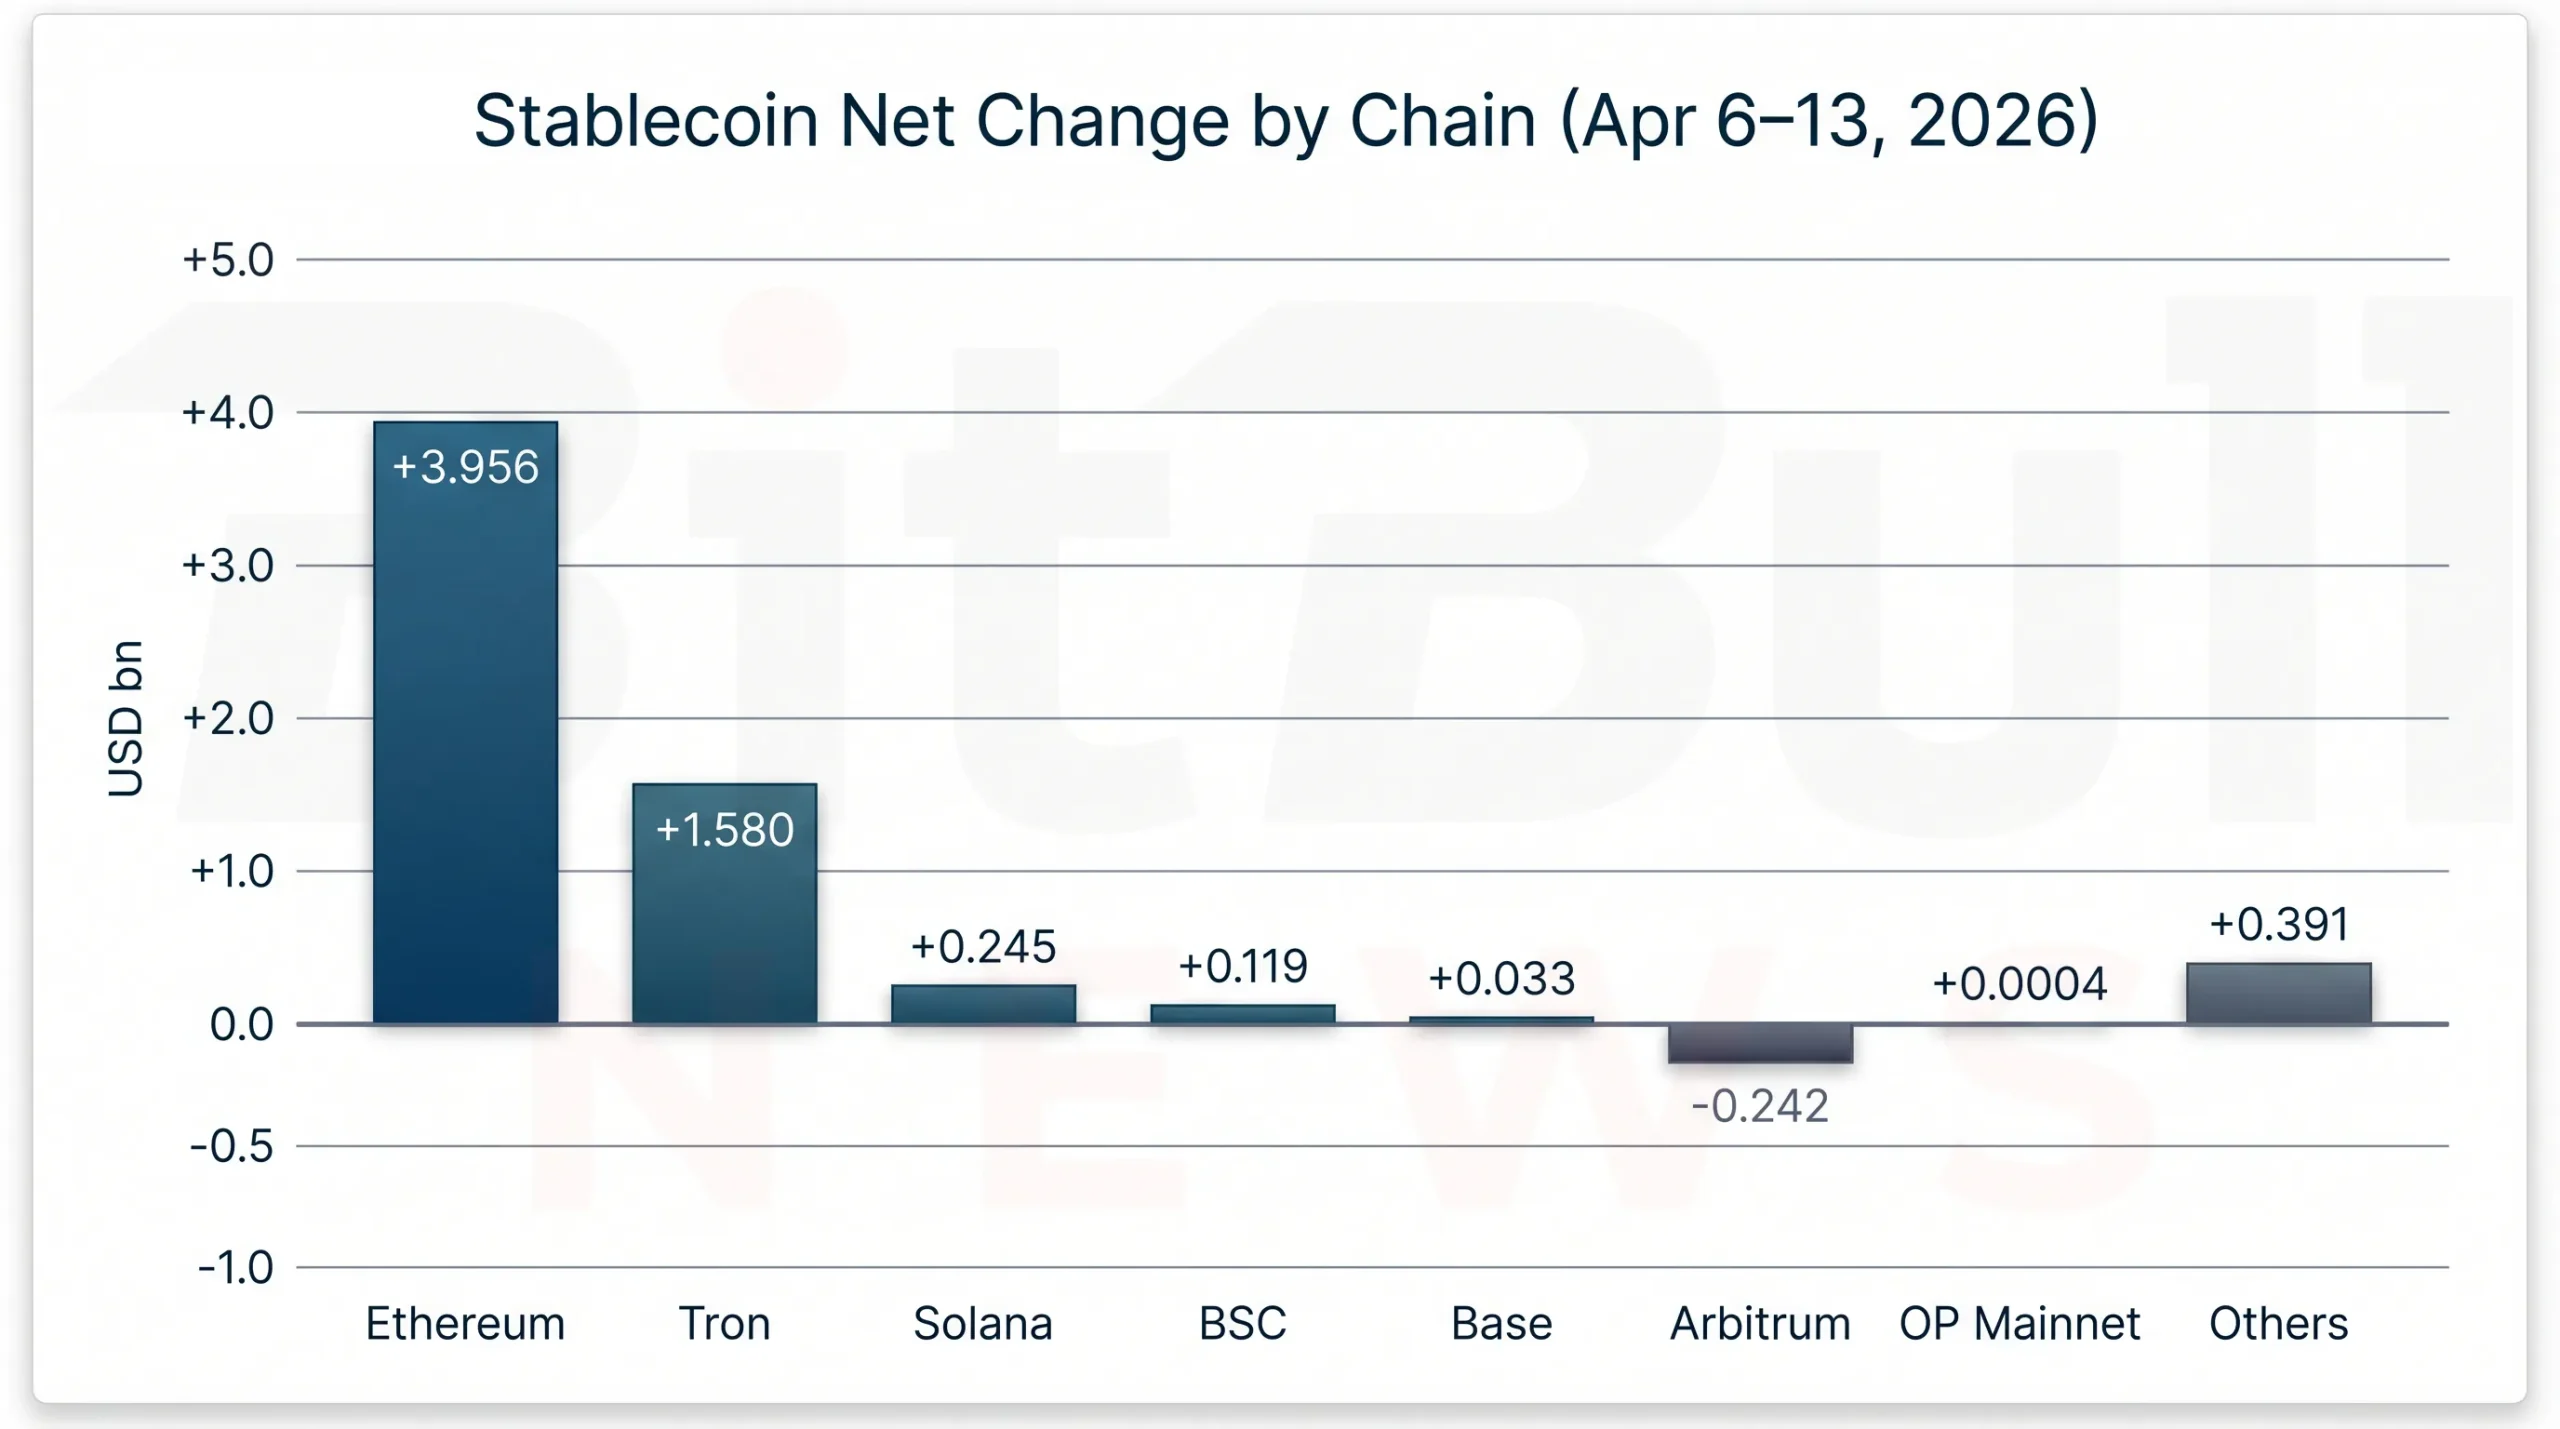
Chart 1. Ethereum and Tron absorbed the bulk of stablecoin growth during Apr. 6–13, while Arbitrum was the clearest weekly contraction point.
Ethereum: The One Clear Risk-On Pocket
The most important nuance in the entire report is that Ethereum itself looked risk-on, even if the broader market did not.
The uploaded report shows Ethereum’s DEX volume at $15.128B over 7 days, up 22.32% week over week, and perps volume at $10.268B, up 8.05%, while Ethereum stablecoin market cap rose by nearly $4B in the same week. That is the strongest localized evidence that some of the week’s fresh stablecoin demand was actually being deployed into spot trading and leveraged activity rather than just sitting idle.
That makes Ethereum the main exception to the otherwise cautious weekly tone. At the system level, the market still looked defensive-to-mixed. But on Ethereum specifically, supply and trading activity moved in the same direction, which is exactly the pattern analysts usually want to see before calling something genuine risk deployment.
Tron: Transfer Rail First, Everything Else Second
Tron’s week is easier to read if you stop treating it like a normal DeFi chain and read it as a stablecoin transport rail.
The report’s own interpretation is that Tron’s +$1.58B weekly increase reinforces its role as a stablecoin settlement and transfer layer, especially for USDT-dominant flows. That matches BitBullNews’ recent coverage of TRON’s Q4 report, which highlighted $2.2T in stablecoin settlement volume and a network profile that is still stablecoin-first and transfer-heavy rather than DeFi-first.
This is why Tron can look strong in stablecoin market cap without necessarily signaling that crypto risk appetite is broadly accelerating. Stablecoin growth on Tron often means transfer, remittance, offshore exchange, and payments utility is intact. That is important, but it is not the same signal as watching USDC-heavy liquidity ramp into Ethereum, Base, or Arbitrum DeFi.
Arbitrum: The Standout Negative
Arbitrum’s -$242.06M (-6.35%) weekly contraction is the sharpest negative in the report, and it matters because Arbitrum is one of the market’s clearest DeFi-forward stablecoin venues.
The uploaded file interprets this correctly: the drawdown likely reflects some mix of reduced DeFi positioning, migration to other chains, or bridge outflows back to L1/CEX destinations. That matters more than the raw size suggests. A contraction on Arbitrum tells you not just that liquidity moved, but that it may have moved away from a venue where stablecoins are often used as working collateral and swap capital rather than pure transfer balances.
That is one reason the week still leans more defensive than bullish overall. If stablecoins are growing but one of the most risk-friendly L2 venues is shrinking materially, the new liquidity is not being deployed as broadly as a full risk-on interpretation would require.
Venue Breakdown and Risk Regime
A full venue split — CEX vs DEX vs bridges vs payments — is still not reconstructible from the free public snapshots alone, and the report is transparent about that. But the available proxies are strong enough to classify the week.
The three best observable indicators are:
- stablecoin supply change, which was clearly positive,
- broad DEX and perps volume change, which was negative,
- and chain-level distribution shifts, which favored Ethereum and Tron while penalizing Arbitrum.
Put together, those signals support the report’s conclusion that the week was mixed but still leaned defensive overall. The added stablecoin balances were real, but the market-wide deployment picture did not confirm a synchronized move into risk. The one clear exception was Ethereum, which is why the week reads more like selective risk-on inside a broader defensive build than like a generalized market reacceleration.
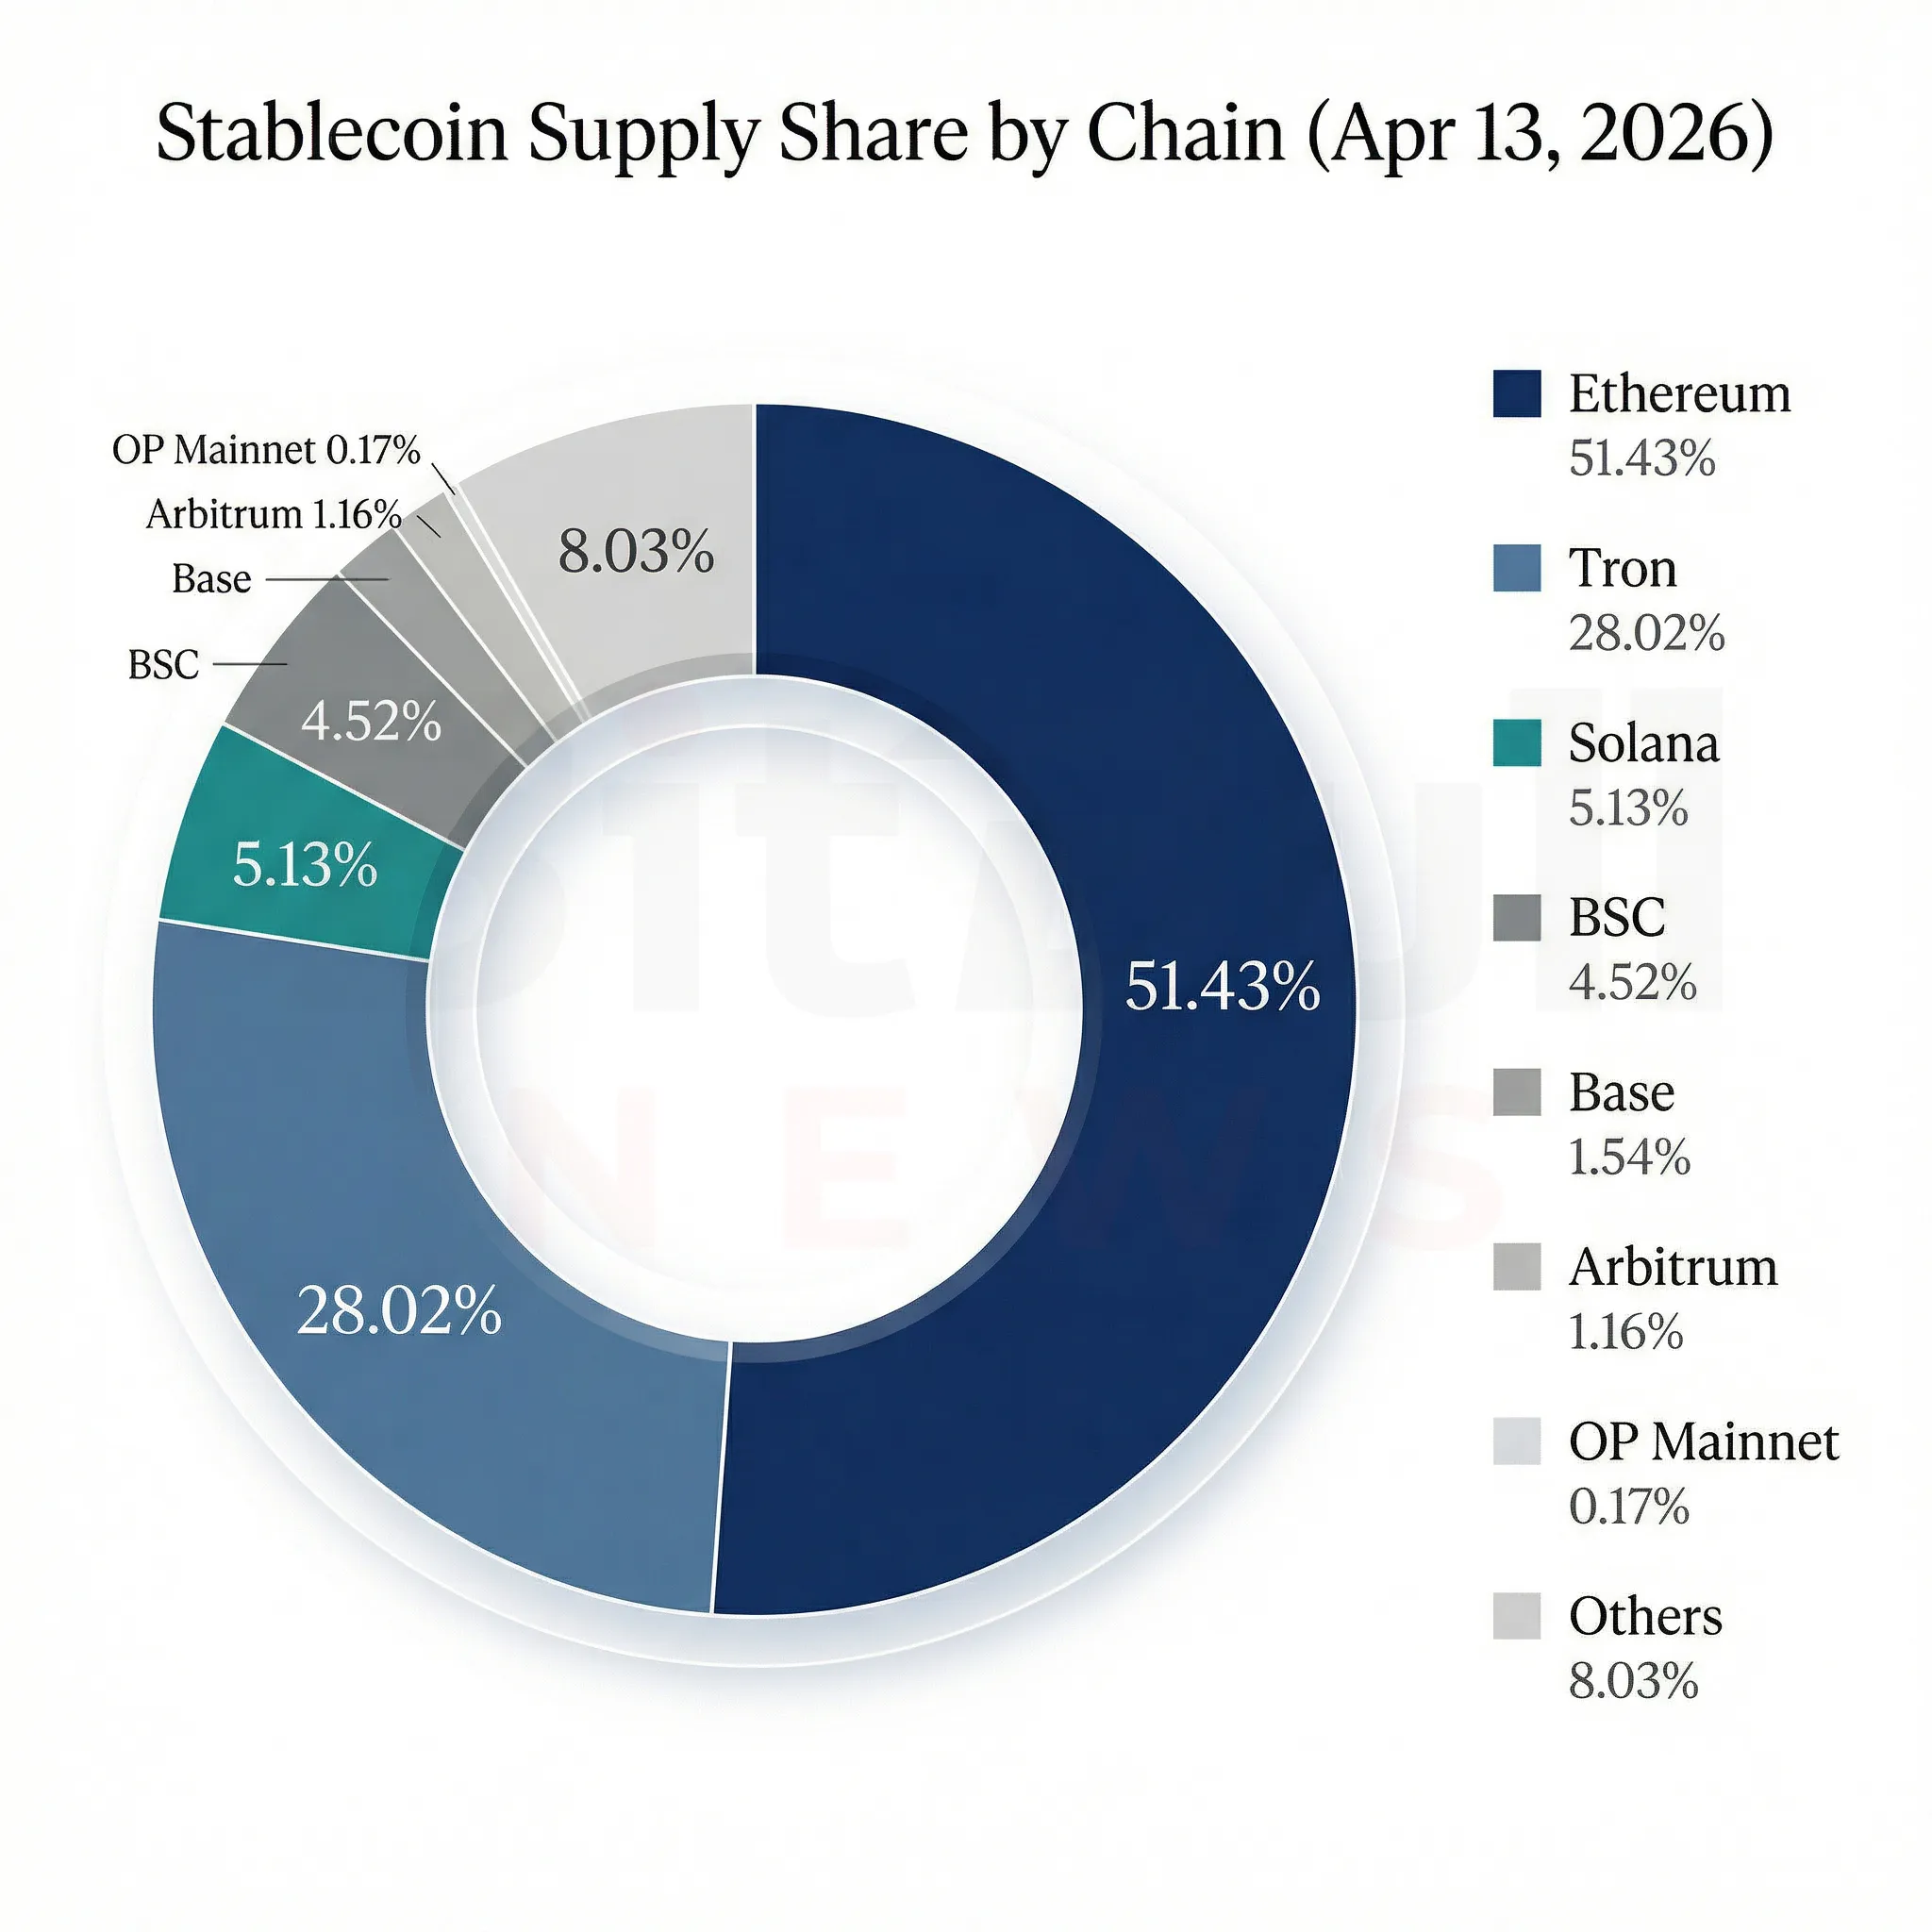
Chart 2. Ethereum and Tron still dominated tracked stablecoin supply by a wide margin, underscoring the market’s continued concentration in a small number of settlement rails.
Liquidity Build vs Trading Deployment
This is the most important interpretive section in the report.
When stablecoin supply rises by 2.02% in a single week, that is usually a strong macro liquidity signal. But when broad DEX volume falls 15.05% and broad perps volume falls 8.9% in the same time window, you cannot call that move fully deployed risk appetite. Instead, it looks like a market bringing liquidity onto crypto rails first and only partially spending it.
That interpretation becomes even more convincing when you compare it with BitBullNews’ recent coverage of Circle’s Arc, a stablecoin-focused Layer 1 designed around USDC-denominated fees and stablecoin settlement. The strategic direction of the industry increasingly points toward stablecoins as financial plumbing, not just as temporary exchange dry powder. That means some of the week’s new supply may have been positioning for settlement, collateral, or infrastructure use rather than immediate speculative deployment.
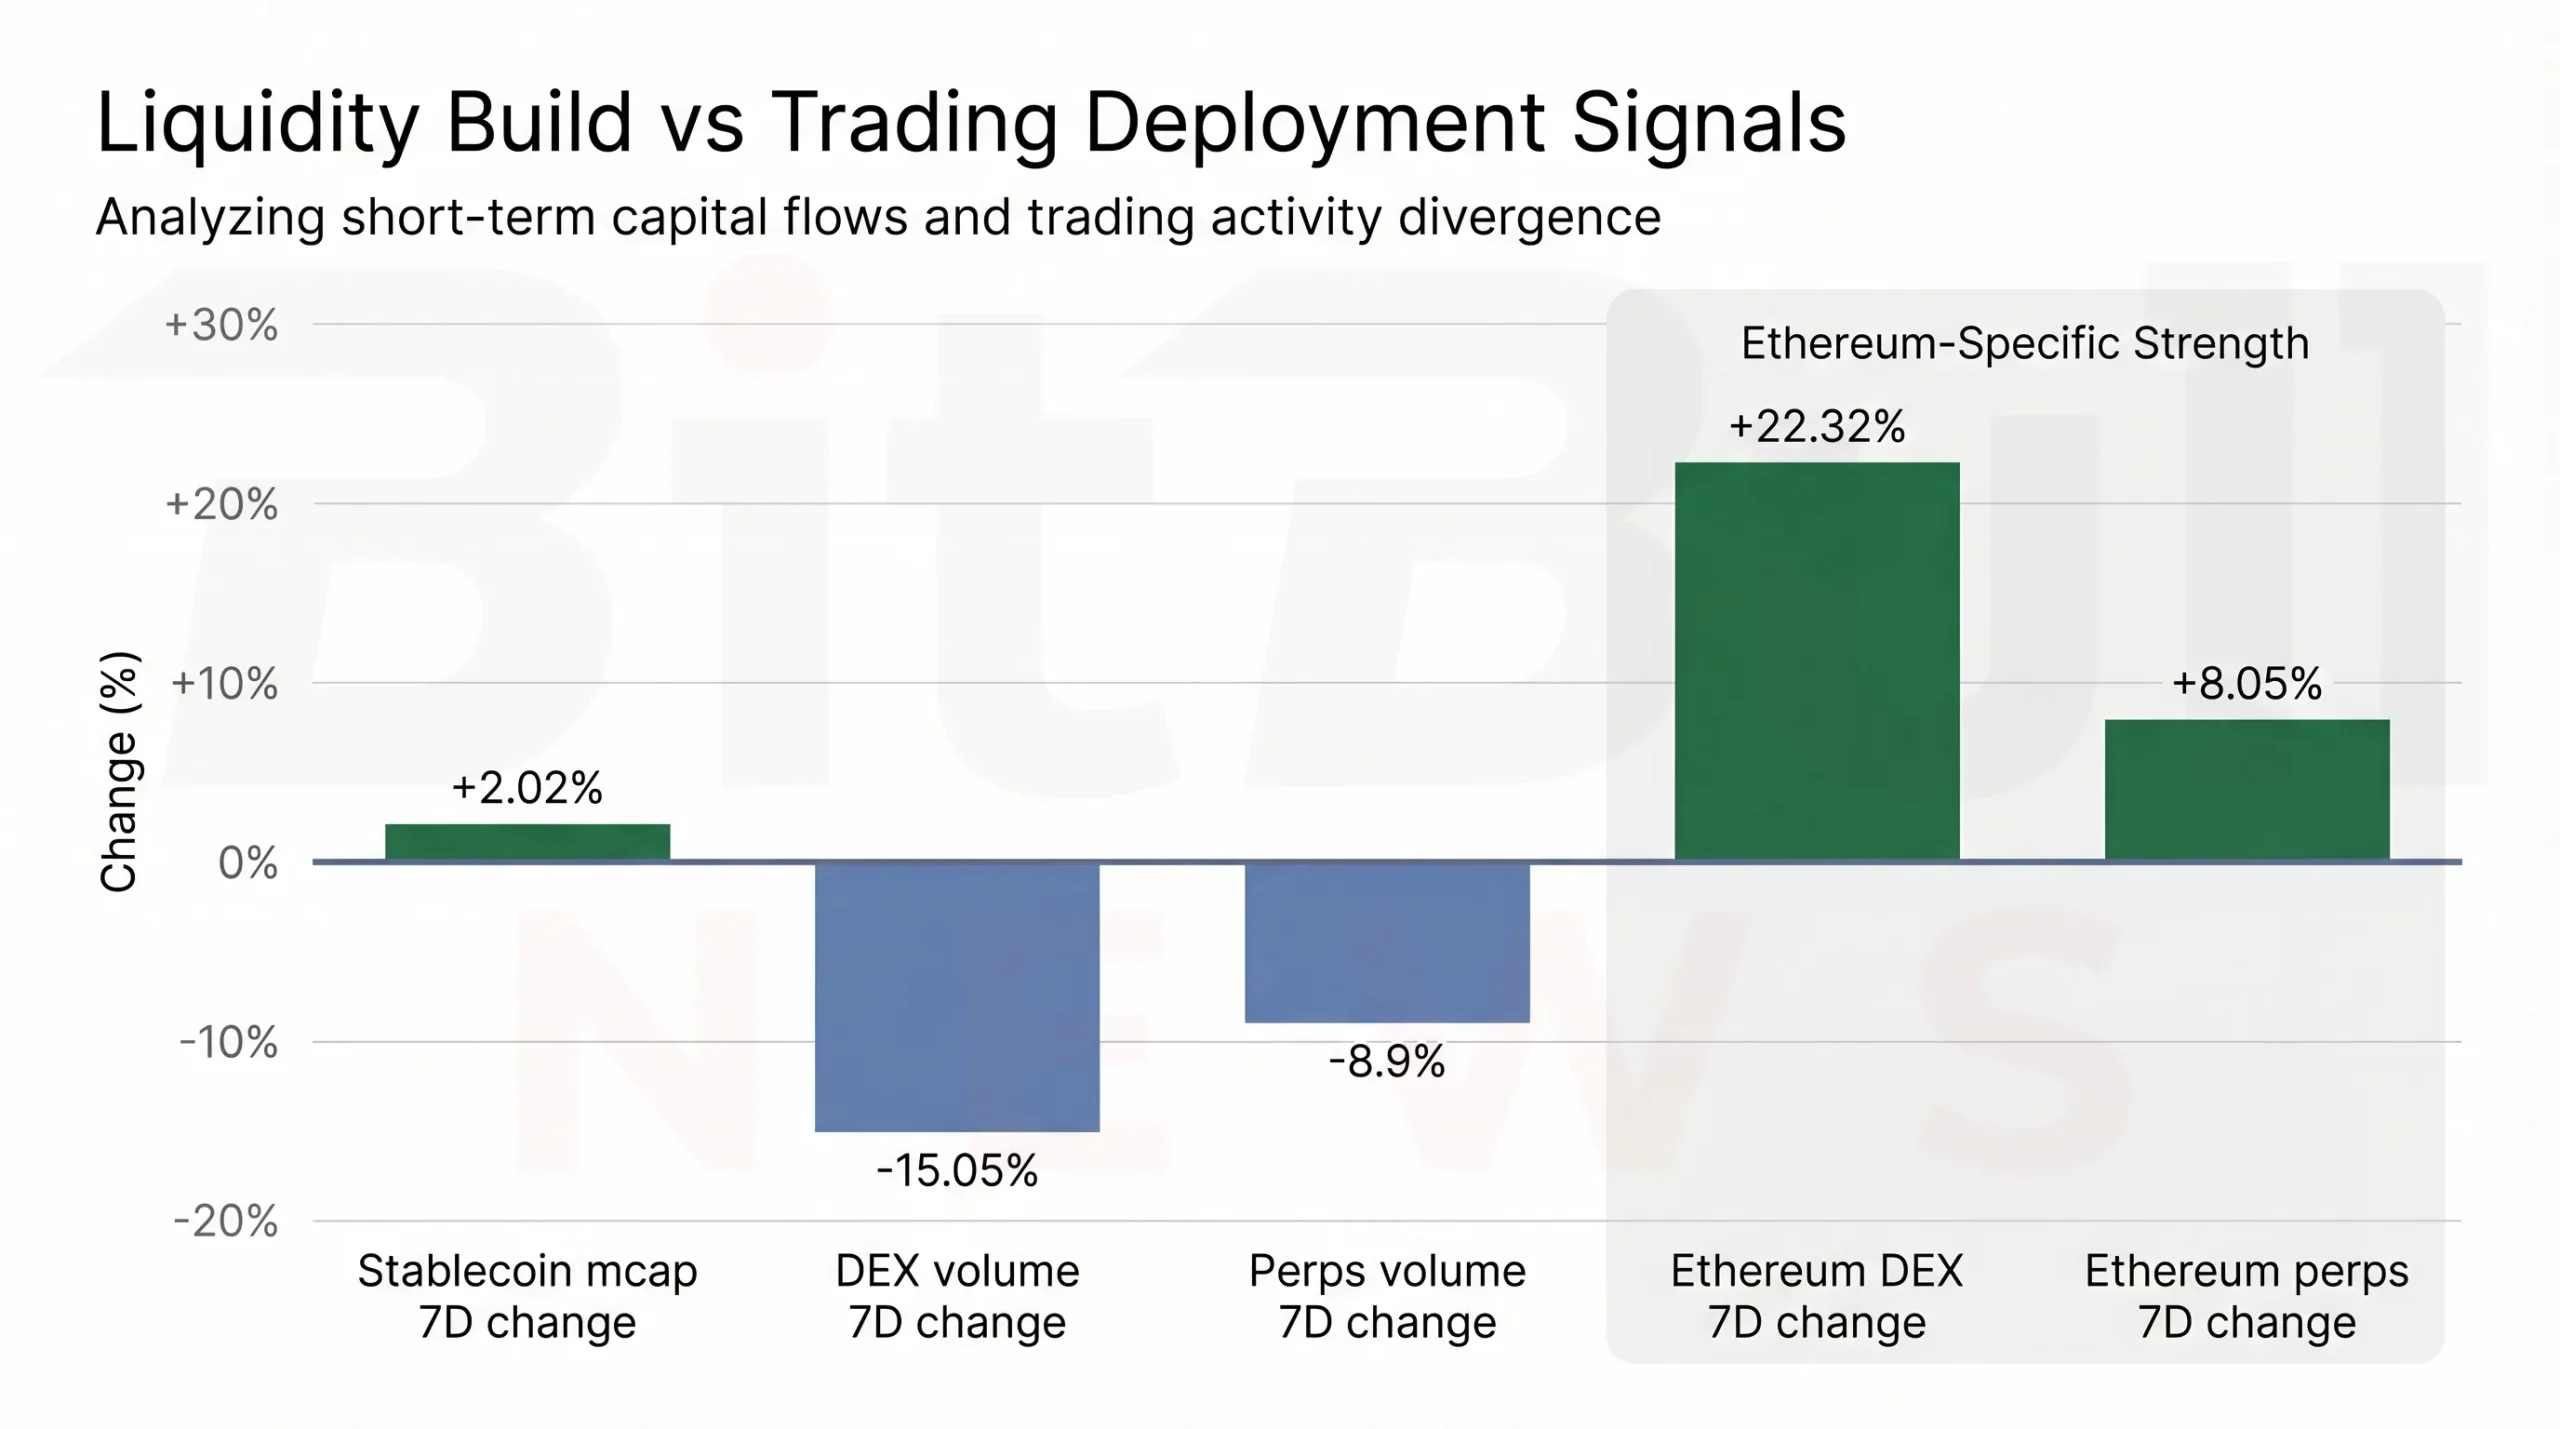
Chart 3. The week’s core divergence: stablecoin market cap rose strongly, broad DEX and perps volumes fell, but Ethereum itself still posted rising DEX and perps activity.
What This Week Means in Series Context
Across the last two issues, the sequence now looks cleaner.
The prior week was modest build, softer deployment. This week was meaningful build, selective deployment. That is a real step forward, but it is not yet the same thing as a full-market risk-on signal. The improvement was strongest where the market already trusts the deepest rails — Ethereum and Tron — while the more speculative or DeFi-forward venues did not all participate equally.
That makes the next issue unusually important. If stablecoin growth remains positive and broader DEX/perps activity starts reaccelerating across more than just Ethereum, the market would have a much stronger case for saying fresh supply is turning into broader risk appetite. If instead stablecoins keep growing while volumes stay muted and chain concentration rises further, the market will look more like it is buffering and parking liquidity than spending it.
BitBullNews View
From a BitBullNews perspective, this week’s most important fact is that the stablecoin market grew fast enough to matter, but not cleanly enough to simplify.
Fresh supply clearly entered the system. Ethereum and Tron captured most of it. Ethereum-specific trading activity strengthened enough to look genuinely risk-on. But the wider market still did not confirm that same behavior, and Arbitrum’s contraction is a real warning that not all execution venues shared in the liquidity build.
The right read is not bearish. It is conditional. This was a constructive liquidity week, but still a selective one.
Key Findings
- Total stablecoin market cap on DefiLlama’s chain aggregation reached $307.544B, up +$6.083B (+2.02%) over seven days.
- The biggest weekly gains were on Ethereum (+$3.956B) and Tron (+$1.58B).
- Arbitrum was the main negative outlier at -$242.06M (-6.35%).
- Broad DEX spot volume fell about 15.05%, and broad perps volume fell about 8.9%, even as stablecoin supply expanded.
- Ethereum was the clearest localized risk-on pocket, with DEX volume up 22.32% and perps volume up 8.05% alongside stablecoin growth.
- Live public chain pages show Tron remains overwhelmingly USDT-heavy, while Solana, Base, Arbitrum, and OP Mainnet remain much more USDC-led.
Final Verdict
Weekly verdict: Fresh supply, selective follow-through
The week of April 6–13 was the strongest stablecoin supply build we have seen in this recent run, but it still stopped short of a full-market risk-on confirmation. The new liquidity was real. The broad deployment was not.
The clearest conclusion is this:
Stablecoins expanded meaningfully, but the market still deployed them unevenly — strongest on Ethereum, steady on Tron, and weaker across parts of the risk-forward L2 map.