


Content
In the March 23–30 report, the market showed almost no fresh liquidity creation: total stablecoin market cap stood near $315.781B, up only $184.39M (+0.06%), which we classified as neutral-to-defensive on issuance alone. In the newly uploaded report covering the period into April 6, total stablecoin market cap rose to about $317.106B, with a 7-day increase of +$1.812B (+0.57%) and USDT dominance around 58.04%. That is stronger than the prior week, but still not the kind of expansion usually associated with a full risk-on impulse.
The more important change is qualitative. The new report shows USDC up about +0.40% over 24 hours, implying roughly +$309.9M of end-window net increase, while PYUSD fell -3.29%, or about -$118.4M. That is not broad speculative stablecoin growth. It looks more like quality rotation toward the most liquid multi-chain rails, especially USDC, while smaller fiat-backed names continue to lose relative standing. The report’s own conclusion — “defensive-to-neutral liquidity build” — is the right one.
Continuity With the Previous Issue
Last week’s monitor showed a system that was large but cautious. This week shows a system that is still cautious, but slightly more constructive.
The easiest way to see the continuity is in the aggregate market-cap line. The prior issue ended at $315.781B. The current one prints $317.106B. That is not a breakout in system-level liquidity, but it does mean the market moved from “almost flat” issuance to modest positive expansion. The system is building balances again, just not aggressively enough to call it fully deployed risk capital.
The second continuity point is structural. In the prior report, Tron was still described as a primary settlement rail with roughly $85.76B in USD-pegged stablecoins. In the latest public chain page, Tron is near $86.722B, up about +$491.11M (+0.57%) over seven days, with USDT dominance at 97.92%. So the market did not abandon Tron. It kept Tron as a payments/transfer rail, while the broader balance-sheet growth of the system remained centered on high-liquidity majors rather than a broad alt-stablecoin expansion.
Market Structure Snapshot
The market remains overwhelmingly concentrated, and that remains the most important structural fact.
The current report places total stablecoin market cap at $317.106B, with USDT dominance at 58.04%. A closely aligned chain view showed $316.801B in total stablecoin market cap and Ethereum dominance at 52.46%, reinforcing that Ethereum plus its surrounding L2 ecosystem remains the main balance sheet for stable liquidity.
Table 1. Headline market structure
| Metric | Reading |
|---|---|
| Total stablecoin market cap | $317.106B |
| 7-day change | +$1.812B |
| 7-day change % | +0.57% |
| 1-day change | -0.02% |
| 30-day change | +1.31% |
| USDT dominance | 58.04% |
| Ethereum dominance (chain view) | 52.46% |
That means two things at once. First, the market kept growing. Second, the growth still happened inside a highly concentrated system, with USDT and USDC dominating issuer-side liquidity and Ethereum plus Tron dominating the settlement map.
Token-Level Flows: The Quality Tilt Is the Real Story
The report is strongest when it moves from system-level market cap into token-level directionality.
Using the end-window snapshot stamped April 4, 2026, the report shows:
- USDT: $182.38B, 24h change +0.00%
- USDC: $77.47B, 24h change +0.40%
- USDS: $8.57B, 24h change +0.10%
- USDe: $5.89B, 24h change +0.00%
- DAI: $4.46B, 24h change +0.16%
- PYUSD: $3.6B, 24h change -3.29%
- BUSD: $39.2M, 24h change +0.00%.
Table 2. Observable token-level supply snapshot at period end
| Stablecoin | Supply snapshot | 24h change | Implied direction |
|---|---|---|---|
| USDT | $182.38B | +0.00% | Flat |
| USDC | $77.47B | +0.40% | Expanding |
| USDS | $8.57B | +0.10% | Slightly positive |
| USDe | $5.89B | +0.00% | Flat |
| DAI | $4.46B | +0.16% | Slightly positive |
| PYUSD | $3.6B | -3.29% | Contracting |
| BUSD | $39.2M | +0.00% | Residual / immaterial |
This is why the week should be read as a quality-stablecoin build, not a broad speculative build. USDT stayed flat. USDC expanded. DAI and USDS edged higher. PYUSD contracted sharply enough to matter. BUSD remained economically irrelevant. That profile is more consistent with institutions, DeFi allocators, and more conservative on-chain users preferring the deepest rails rather than chasing fringe stablecoin beta.
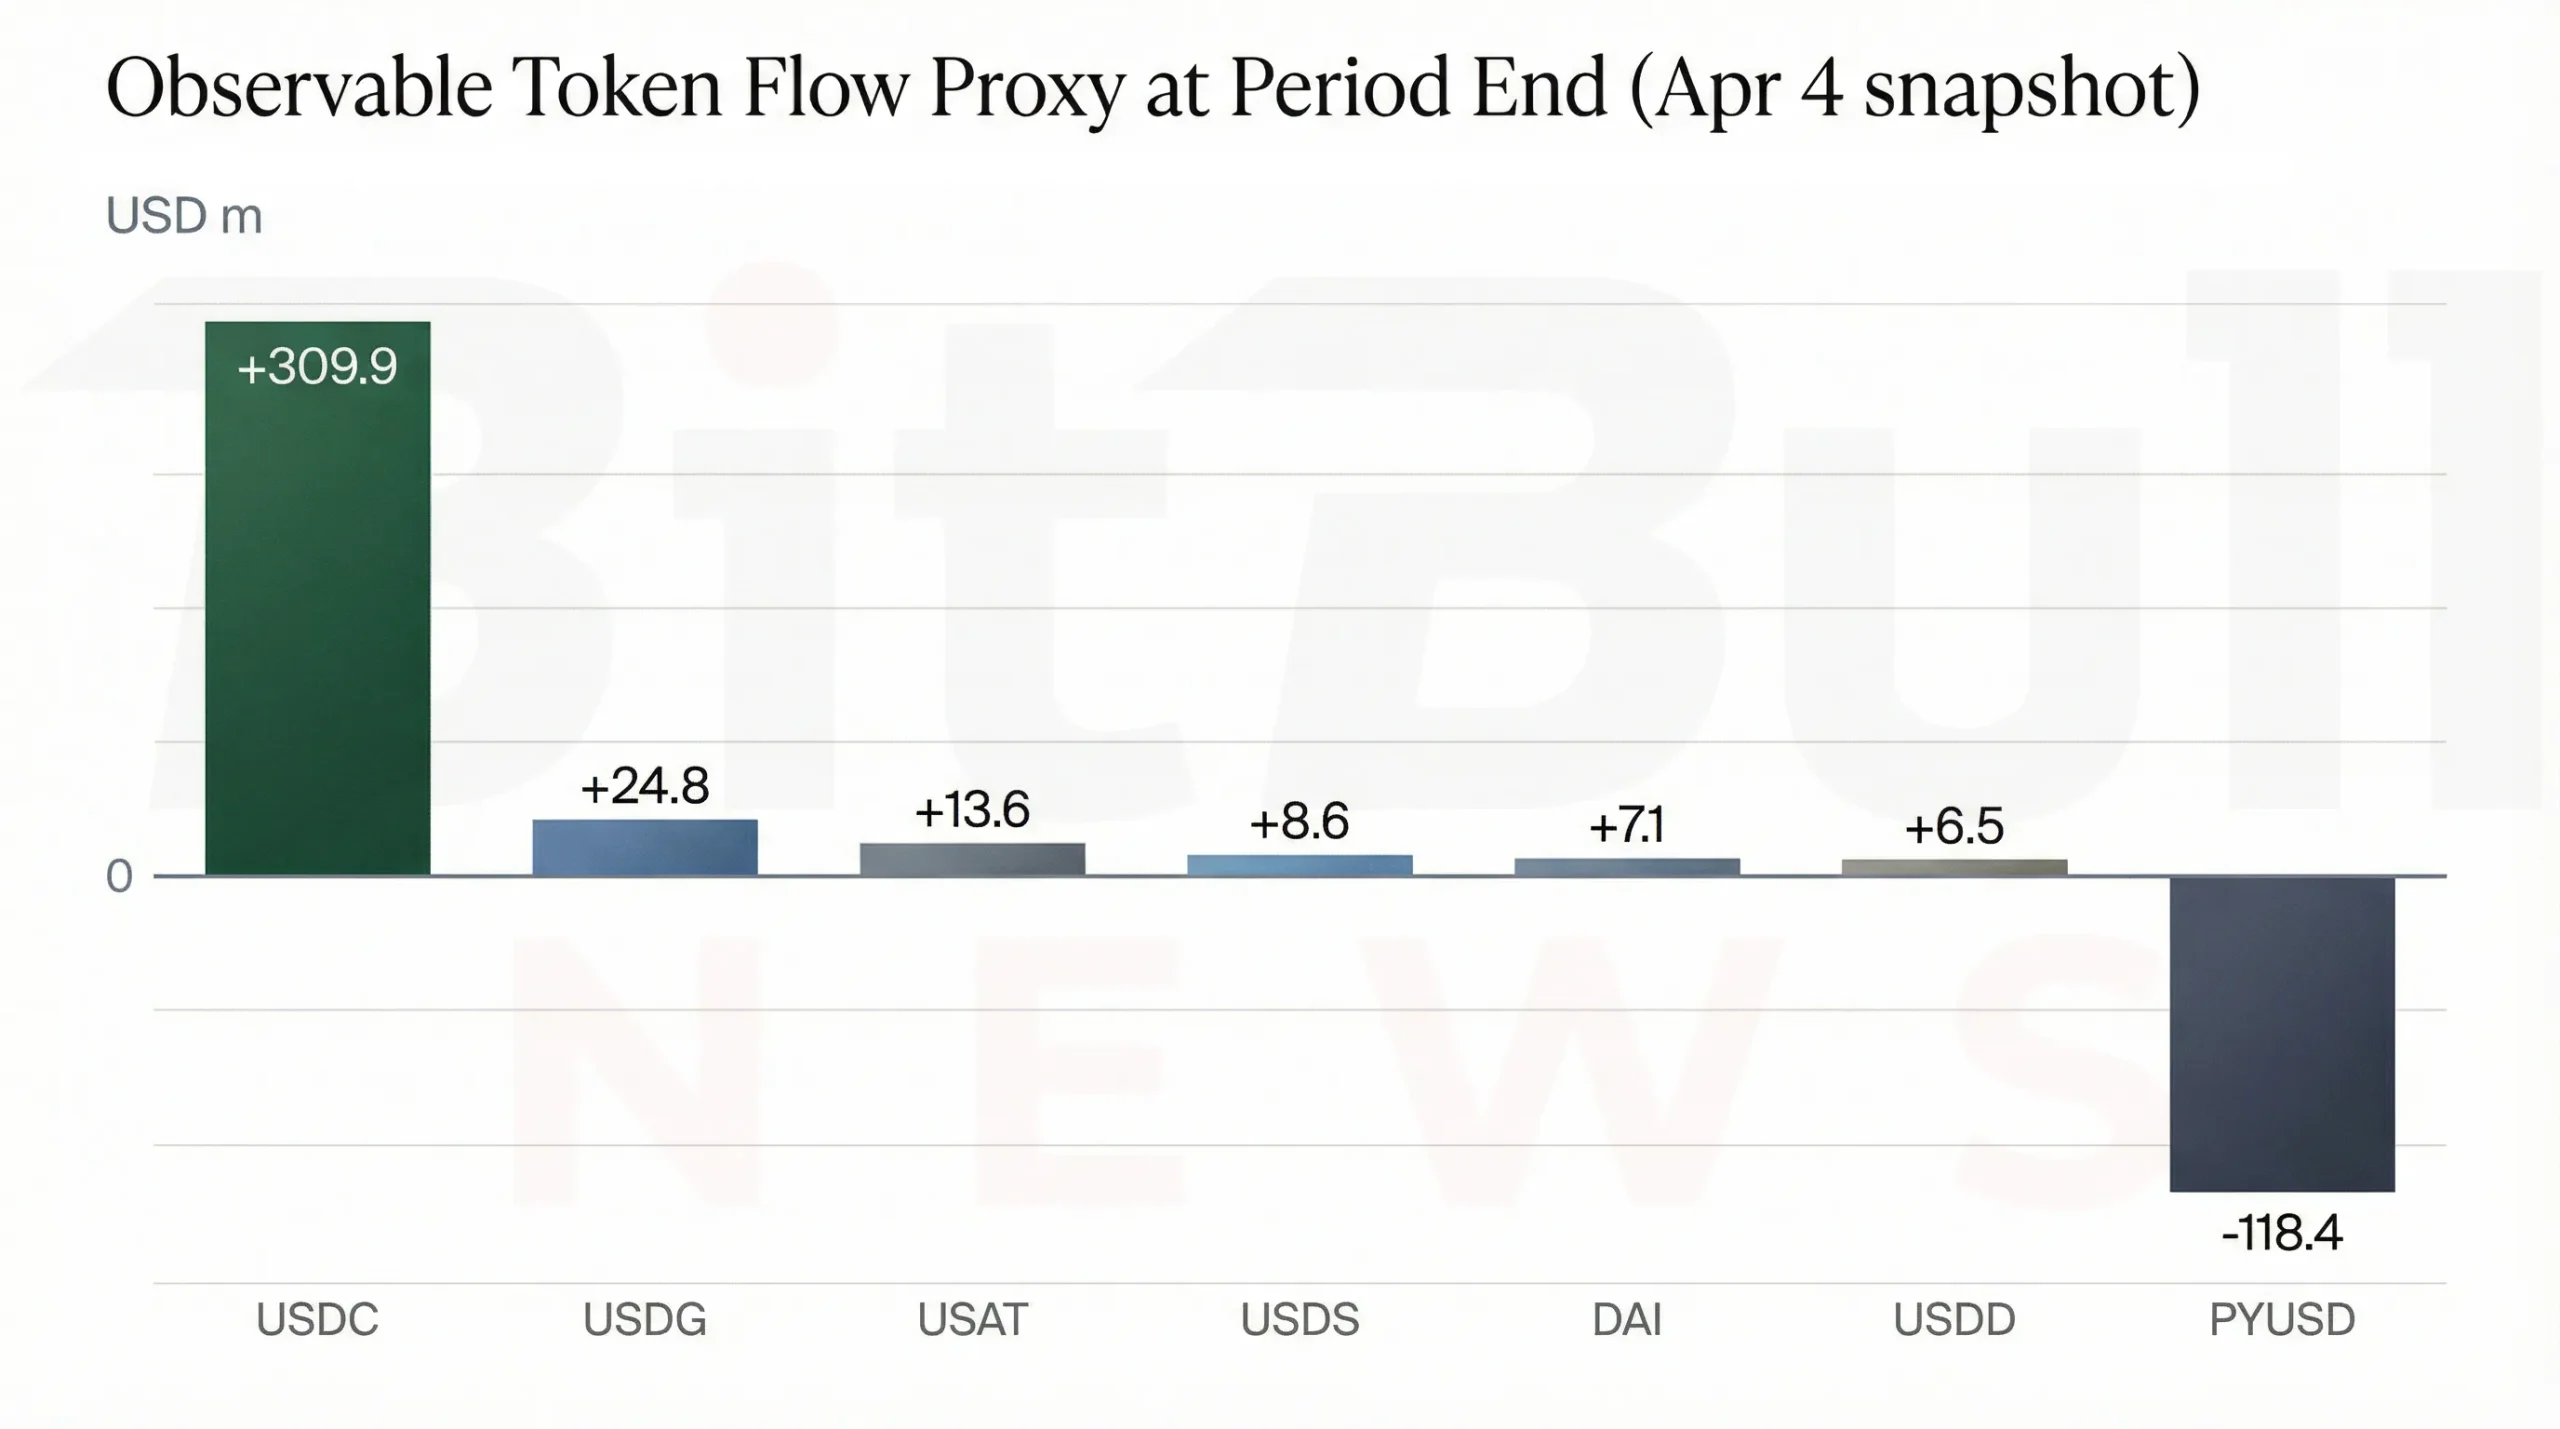
The same report also gives the best directly observable end-window flow proxy:
- USDC: about +$309.9M
- PYUSD: about -$118.4M
- USDG: about +$24.8M
- USAT: about +$13.6M
- USDS: about +$8.6M
- DAI: about +$7.1M
- USDD: about +$6.5M.
Network Breakdown: Where Stablecoins Actually Sit
The uploaded report is transparent that fully clean chain-by-chain daily deltas were not available in this environment. That limitation remains real. But enough public information exists to make a useful network-level read.
The report itself confirms Ethereum dominance at 52.46% of the stablecoin market-cap-by-chain view. Using the same total of $316.801B, that implies roughly $166.2B of stablecoin liquidity sitting on Ethereum and its directly counted balance sheet. Meanwhile, the current public DefiLlama chain pages show:
- Tron: $86.722B, +0.57% 7d, USDT dominance 97.92%
- Solana: $14.684B, -1.67% 7d, USDC dominance 52.41%
- BSC: $13.69B, +0.04% 7d, USDT dominance 65.62%
- Base: $4.702B, -0.09% 7d, USDC dominance 89.87%
- Arbitrum: $3.652B, +2.34% 7d, USDC dominance 58.78%
- Avalanche: $1.402B, -7.96% 7d, USDT dominance 41.47%.
Table 3. Current chain positioning
| Chain | Stablecoin market cap | 7d change | Dominant stablecoin |
|---|---|---|---|
| Ethereum | ~166.2B | n/a in open snapshot | Mixed / diversified |
| Tron | $86.722B | +0.57% | USDT |
| Solana | $14.684B | -1.67% | USDC |
| BSC | $13.69B | +0.04% | USDT |
| Base | $4.702B | -0.09% | USDC |
| Arbitrum | $3.652B | +2.34% | USDC |
| Avalanche | $1.402B | -7.96% | USDT |
This suggests a market that is not rotating uniformly. Tron strengthened again as a transfer rail. Arbitrum improved. BSC was flat-to-slightly positive. Solana and Avalanche weakened. Base held almost flat. Ethereum remained the dominant settlement balance sheet by far. That is not a broad risk-on map. It is a selective, quality-first map.
Venue and Deployment Signals: Softer Than Issuance
This is where the new issue adds something important to the series.
The previous report judged the market neutral-to-defensive because issuance was nearly flat. The new issue shows somewhat better issuance, but then checks that against deployment and finds that activity still lagged. The report cites a DefiLlama mirror snapshot showing DEX spot volume down about 9.35% week over week and perps volume down about 6.01% week over week. That matters because stablecoin growth without parallel acceleration in trading and leverage tends to mean parking, buffering, or preparation, not aggressive speculative deployment.
That is why the report’s “defensive-to-neutral liquidity build” label is stronger than a simple “stablecoin market cap rose, therefore risk-on” reading. Stable balances increased, but the higher-value venues where those balances would normally be deployed at speed were softer. In other words, the market accumulated liquidity faster than it used it.
Structural Venue Proxy: DeFi Utilization Still Splits the Chains
Because direct CEX/DEX/bridge/payment breakdowns are still a data gap in open-access workflows, the report uses a structural DeFi-usage proxy from stableflows.finance. Even though the snapshot is older, it remains useful because it explains how to interpret fresh supply once it lands on each chain.
The report cites approximate stablecoin utilization in DeFi as:
- Base: ~80.8%
- Arbitrum: ~44.8%
- Plasma: ~33.4%
- Avalanche: ~26.4%
- Tron: ~0.1%.
That is one of the most useful contextual metrics in the whole piece. It explains why equal inflows to different chains do not mean equal risk impact. Stablecoins arriving on Base or Arbitrum can move quickly into collateral, swaps, or leverage loops. Stablecoins sitting on Tron are far more likely to behave as transfer or payments liquidity. So even modest USDC-led growth can matter more for future market risk appetite than larger but flatter USDT balances parked on payments-heavy rails.
Table 4. Structural DeFi utilization proxy by chain
| Chain | Approx. stablecoin utilization in DeFi | Interpretation |
|---|---|---|
| Base | ~80.8% | Very DeFi-heavy |
| Arbitrum | ~44.8% | Strong deployment potential |
| Plasma | ~33.4% | Moderate deployment |
| Avalanche | ~26.4% | Moderate deployment |
| Tron | ~0.1% | Transfer / payments-heavy |
Risk Appetite Assessment
The cleanest weekly classification remains the one in the file:
Defensive-to-neutral liquidity build.
That assessment is supported by three measurable facts:
- System-level stablecoin supply expanded by +$1.812B (+0.57%).
- USDC expanded while USDT stayed flat and PYUSD contracted, which points to selective preference rather than generalized exuberance.
- DEX and perps volumes were softer week over week, which means stablecoin growth was not matched by an equally strong increase in speculative deployment.
This is the exact kind of week where a market becomes easier to misread. If you only watch stablecoin supply, you could call it bullish. If you only watch trading volume, you could call it weak. The better interpretation is that the market built liquidity first, but did not yet put that liquidity to work aggressively.
BitBullNews View
The sequence across the last two issues now looks clearer.
The March 23–30 issue was a flat-liquidity week. The March 30–April 6 issue improved on headline issuance, but the improvement came with softer DEX and perps activity and a visible preference for stronger, more trusted stablecoins. That is not a breakout. It is a positioning week.
The market still looks defensive in tone, but less stagnant than a week earlier. It is holding more stablecoin liquidity, favoring higher-quality rails like USDC, and keeping the biggest transfer base — Tron/USDT — intact. The unresolved question is whether that liquidity becomes deployed in the next window or remains parked.
Key Findings
- Total stablecoin market cap rose to $317.106B, up +$1.812B (+0.57%) over seven days.
- The prior issue’s market cap was $315.781B, so the system improved week over week, but only modestly.
- USDT dominance remained high near 58%, meaning concentration is still the defining structural fact.
- USDC was the clearest positive token-level flow signal, while PYUSD was the clearest contraction signal.
- Tron strengthened slightly, Arbitrum improved, BSC held flat, while Solana, Base, and especially Avalanche were weaker on the week.
- The most defensible classification remains defensive-to-neutral liquidity build, not full risk-on deployment.
Final Verdict
Weekly verdict: Modest build, softer deployment
The week of March 30 to April 6 did not deliver a broad stablecoin breakout. It delivered a mild but real increase in system liquidity, paired with softer trading intensity and a visible preference for higher-quality, multi-chain stablecoins. That is constructive in balance-sheet terms, but still cautious in market-behavior terms.
The clearest conclusion is this:
Stablecoins grew, but deployment did not keep pace — so the market looks more like it is preparing liquidity than aggressively spending it.