


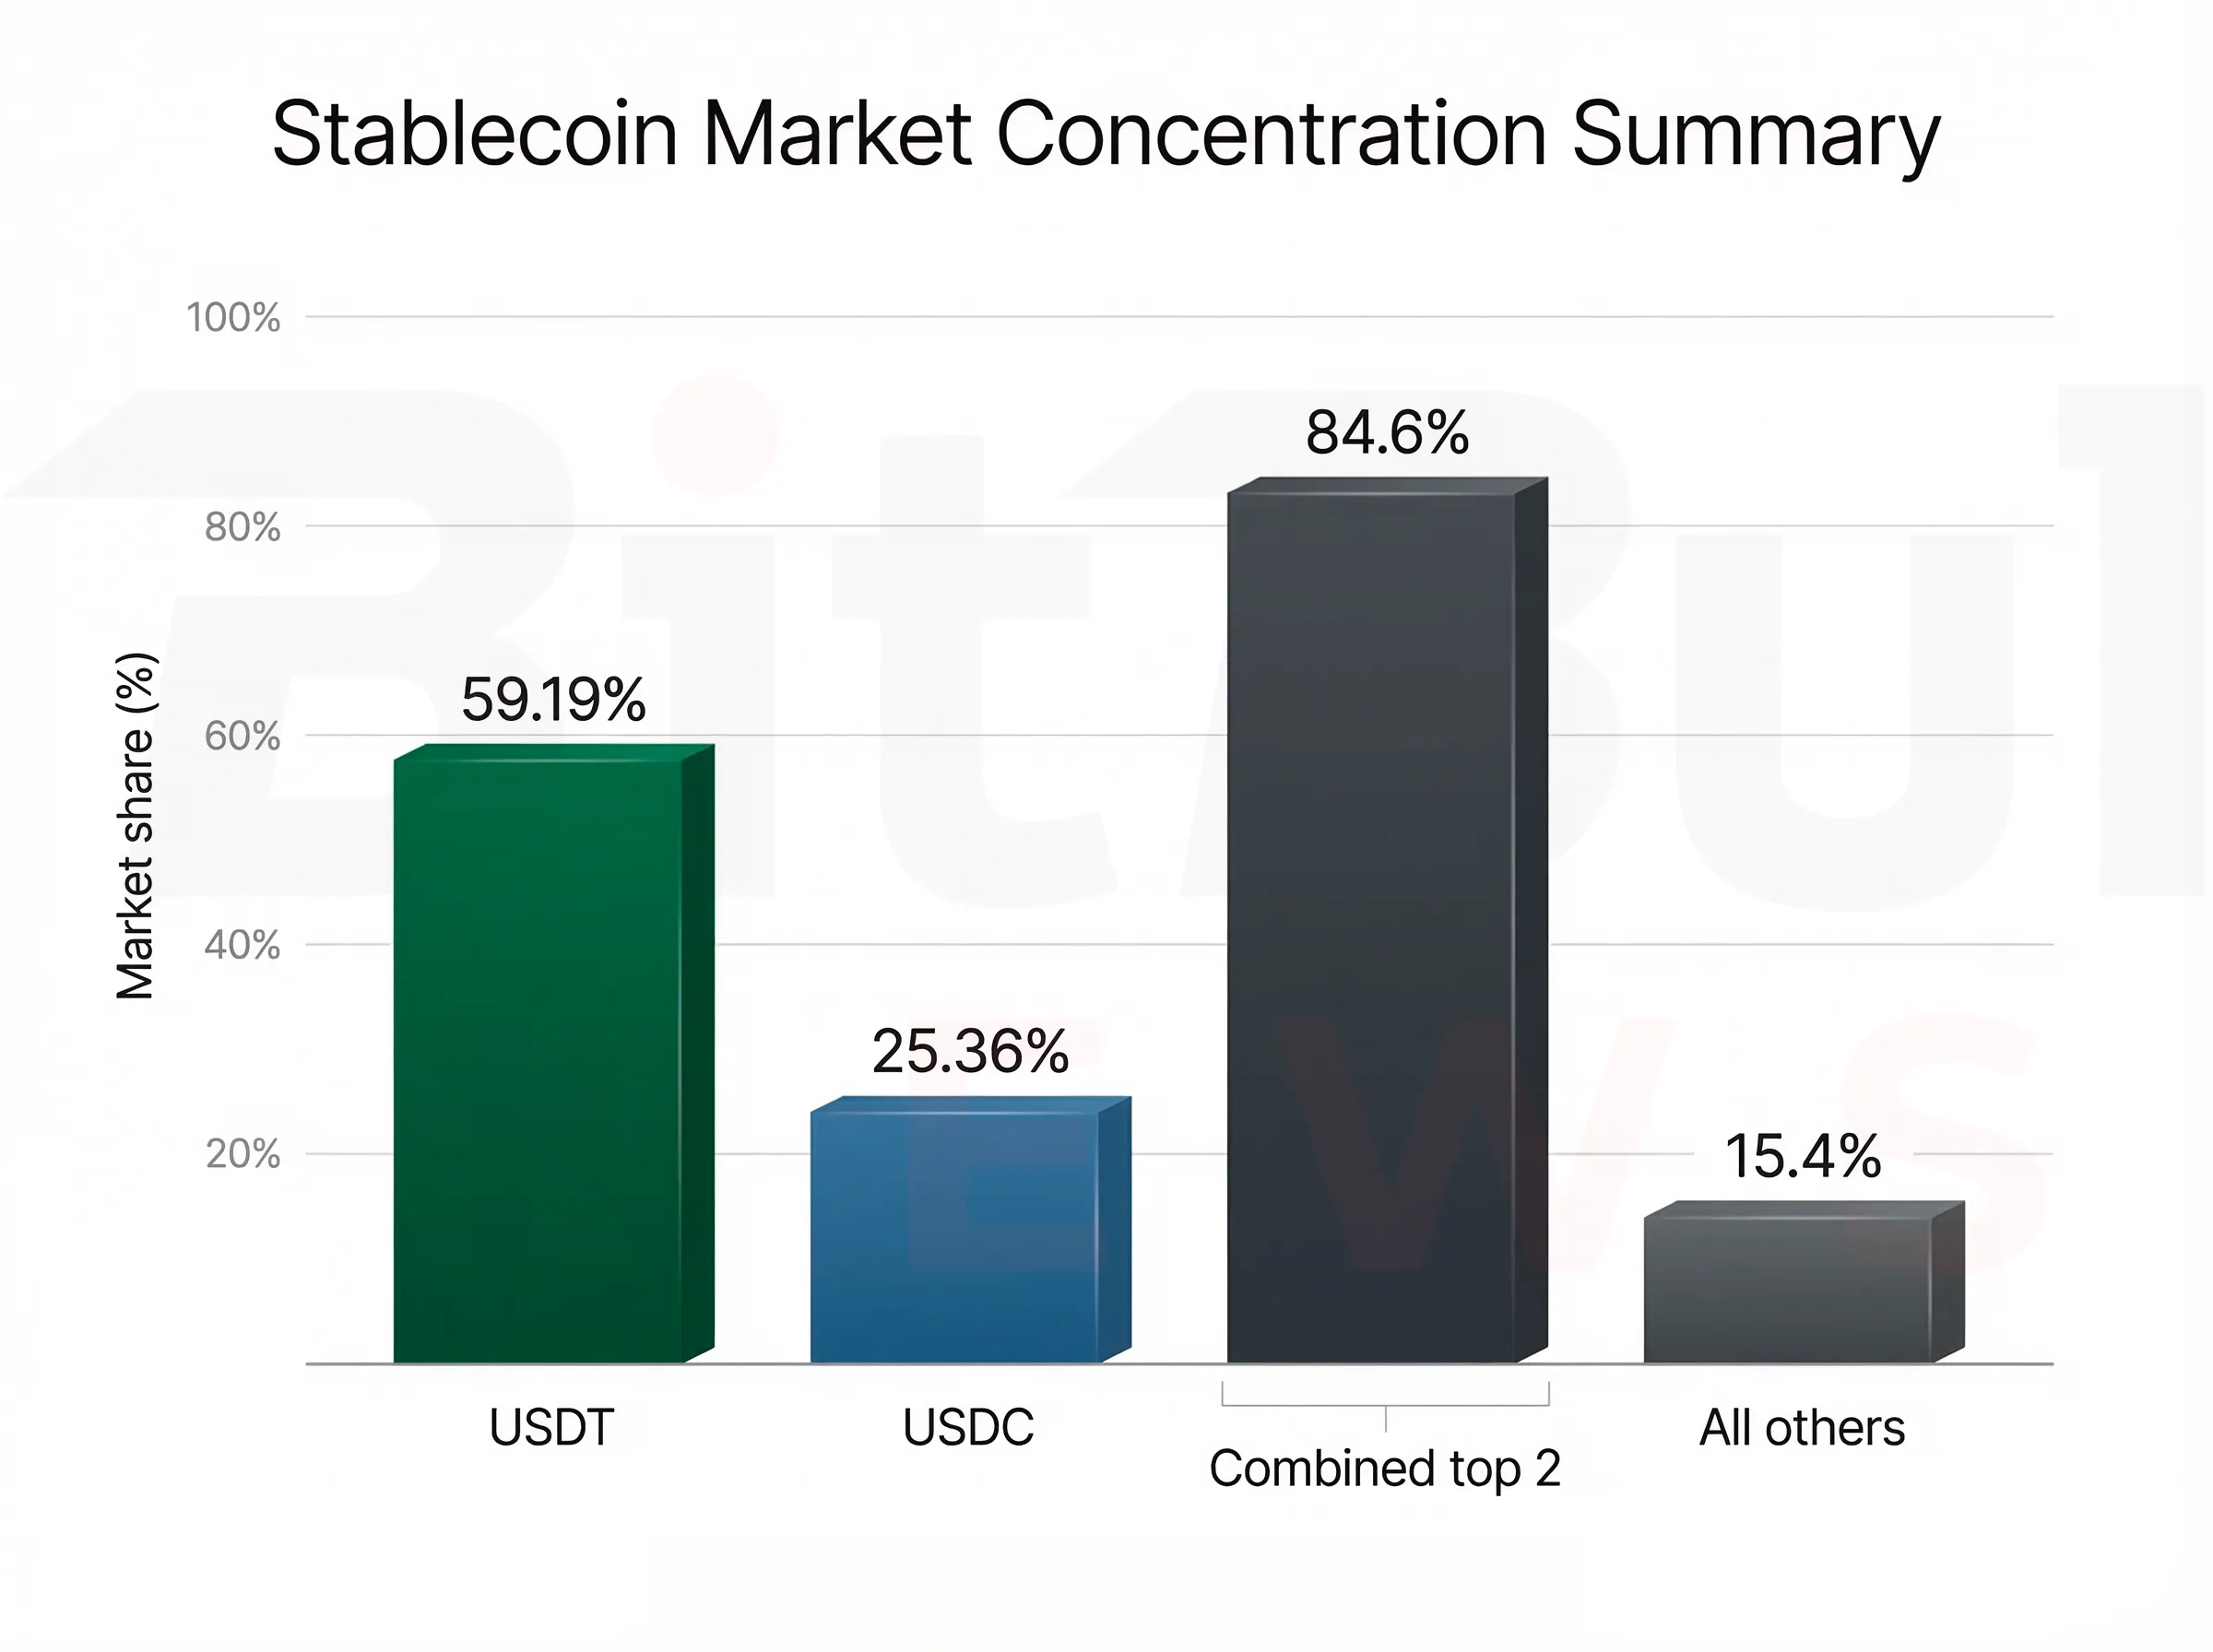
The stablecoin market remained large, concentrated, and systemically important during the March 8–16 reporting window. Total market capitalization stood around $310.8 billion on the latest category-level snapshot used in the source document, with USDT at roughly $184.0 billion and USDC at roughly $78.8 billion. Together, those two issuers accounted for about 84.6% of the market, which means the stablecoin system still rests on a very narrow issuer base. That remains the single most important structural fact in the sector.
The week’s most visible signals came from three directions. First, publicly flagged issuance events included a 250 million USDC mint reported on March 10 and a 1 billion USDT mint on Tron reported on March 12. Second, exchange-flow snapshots pointed to large net outflows from centralized venues, especially in USDC and USDT, which is consistent with either risk reduction, self-custody migration, or capital moving closer to DeFi deployment. Third, regulation remained fluid: the Bank of England signaled openness to revising parts of its proposed stablecoin regime, reminding the market that issuer economics and distribution models can still change quickly under policy pressure.
The key conclusion is straightforward. Stablecoin liquidity did not look impaired in this window. But it did look concentrated, policy-sensitive, and increasingly shaped by how users move capital between exchanges, wallets, and execution venues rather than simply how much supply exists on paper. That makes stablecoin analysis less about market cap alone and more about who issues, where supply sits, and how quickly it can move.
Market Structure Snapshot
The market remains overwhelmingly controlled by a small top tier. USDT and USDC dominate by a wide margin, while the next layer of stablecoins is materially smaller and far more specialized in its use cases. Some function as DeFi-native liquidity, some as ecosystem-specific settlement tools, and some as legacy remnants of earlier market structure. That means the stablecoin category should not be treated as a flat list of equivalent digital dollars. It is a hierarchy.
Snapshot table across key metrics
| Stablecoin | Category / backing | Market cap (USD) | Share of total stablecoins | Status notes relevant to flows |
|---|---|---|---|---|
| USDT | Fiat-backed | 183,968,929,613 | 59.19% | Dominant liquidity rail; highest systemic significance |
| USDC | Fiat-backed | 78,806,836,973 | 25.36% | “Regulated” positioning; major exchange and layer activity |
| USDS | Sky / Maker ecosystem | 9,902,183,226 | 3.19% | DAI-related rebrand / wrapper context |
| USDe | Synthetic / delta-hedged | 6,078,248,315 | 1.96% | DeFi-native; sensitive to funding and hedge conditions |
| USD1 | Fiat-backed | 4,697,082,481 | 1.51% | Growing centralized-exchange footprint |
| DAI | Crypto-backed | 4,266,672,878 | 1.37% | Deep DeFi integration; stable base liquidity |
| PYUSD | Fiat-backed | 4,093,189,577 | 1.32% | Payments-brand distribution plus DeFi presence |
| USDD | Algorithmic / Tron ecosystem | 757,313,985 | 0.24% | Smaller but still material in ecosystem pockets |
| RLUSD | Fiat-backed | ~645,324,485 | ~0.21% | Emerging challenger stablecoin |
| TUSD | Fiat-backed | 494,460,000 | 0.16% | Legacy multi-chain stablecoin |
| FRAX | Fractional / hybrid legacy model | 281,695,253 | 0.09% | Smaller footprint; DeFi-liquidity concentrated |
| BUSD | Fiat-backed legacy | 40,579,608 | 0.01% | Run-off / legacy footprint |
| USTC | Legacy depegged | 27,724,831 | 0.01% | Not a functioning $1 unit; mainly a legacy-risk monitor |
This table makes two things clear. First, the market is still a USDT/USDC duopoly. Second, everything below that top layer needs to be interpreted through its role, not just its size. USDe is not the same product as PYUSD. DAI is not the same product as RLUSD. BUSD and USTC are not current-system liquidity leaders at all. They are legacy indicators.
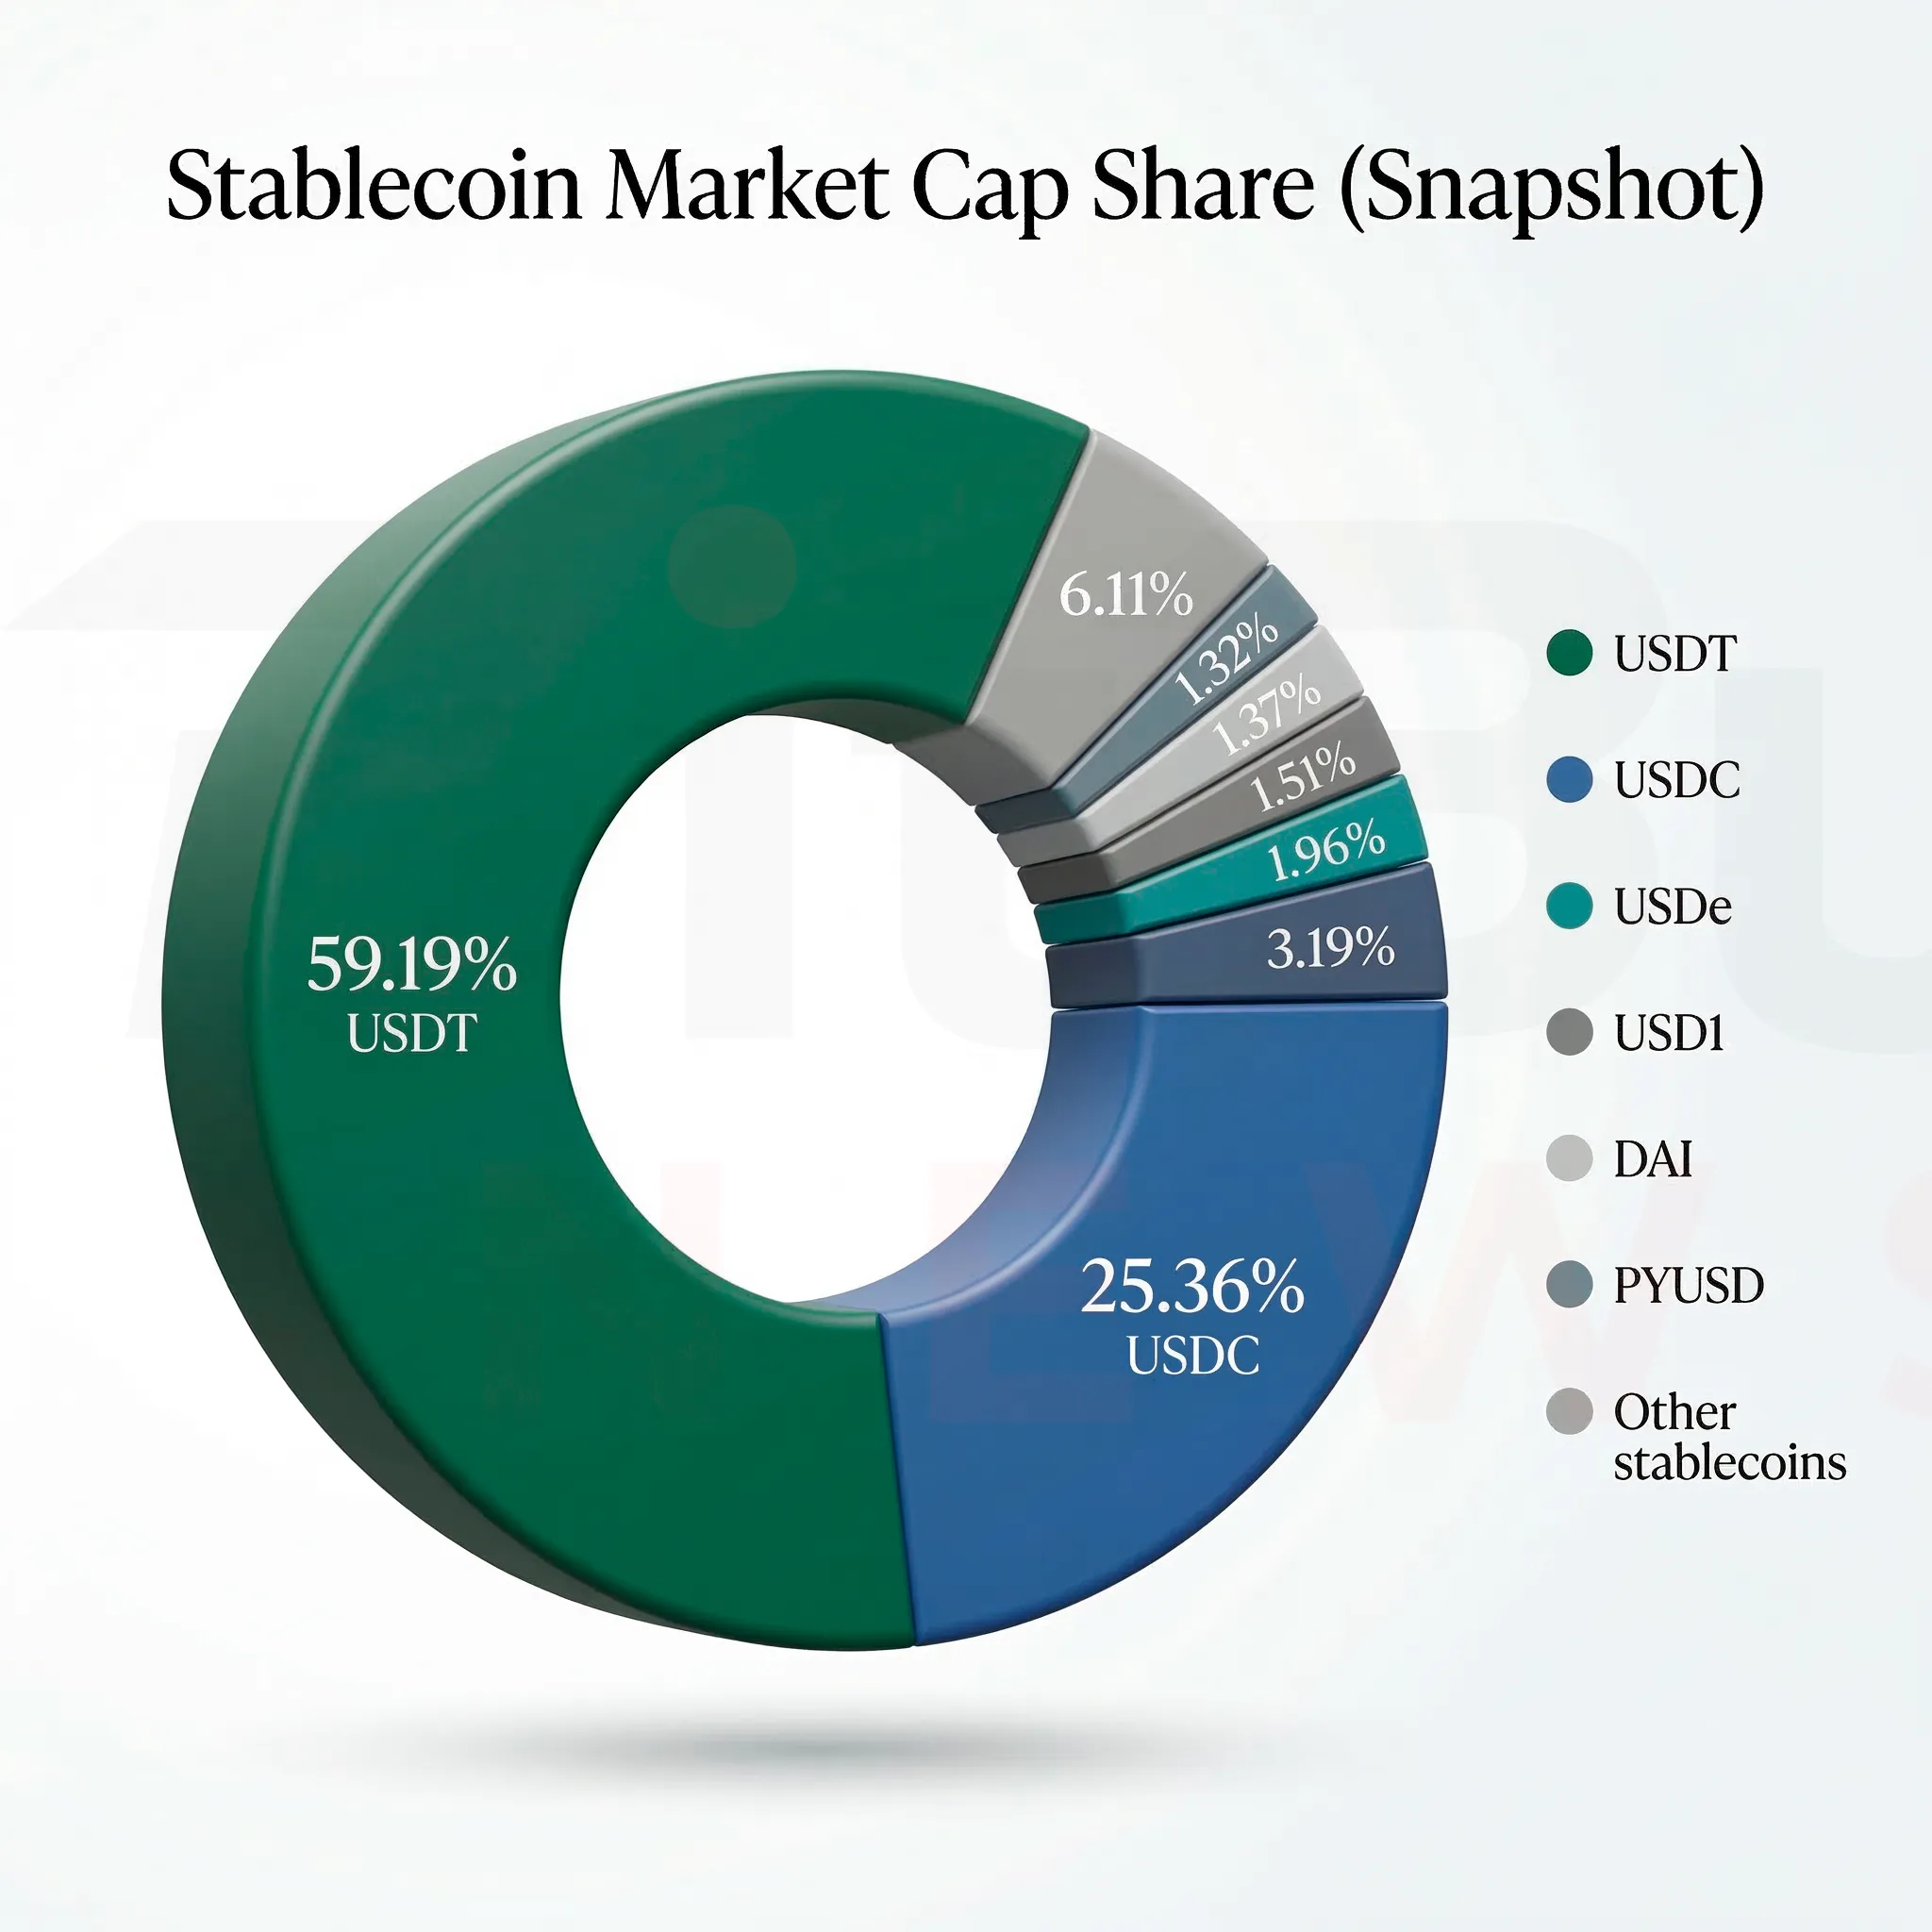
Chart 1: USDT and USDC continued to control roughly 84.6% of the stablecoin market during the reporting window, reinforcing the sector’s high issuer concentration.
Issuance and Redemptions
The biggest challenge in any weekly stablecoin report is that market cap alone does not show real net issuance behavior. A production-grade monitor needs daily mint and burn totals by chain, ideally from onchain logs. The source document makes clear that this full series could not be extracted under the current public-data constraints. As a result, the report does not pretend to have a complete week-long mint/burn ledger for every required stablecoin. Instead, it works from publicly flagged large issuance events and makes the data gap explicit. That is the right approach.
Large issuance events publicly flagged during the reporting window
| Date reported | Stablecoin | Event type | Amount | Chain / venue context |
|---|---|---|---|---|
| 2026-03-10 | USDC | Mint | 250,000,000 | “USDC Treasury” mint, chain unspecified in the source snippet |
| 2026-03-12 | USDT | Mint | 1,000,000,000 | Reported mint on Tron |
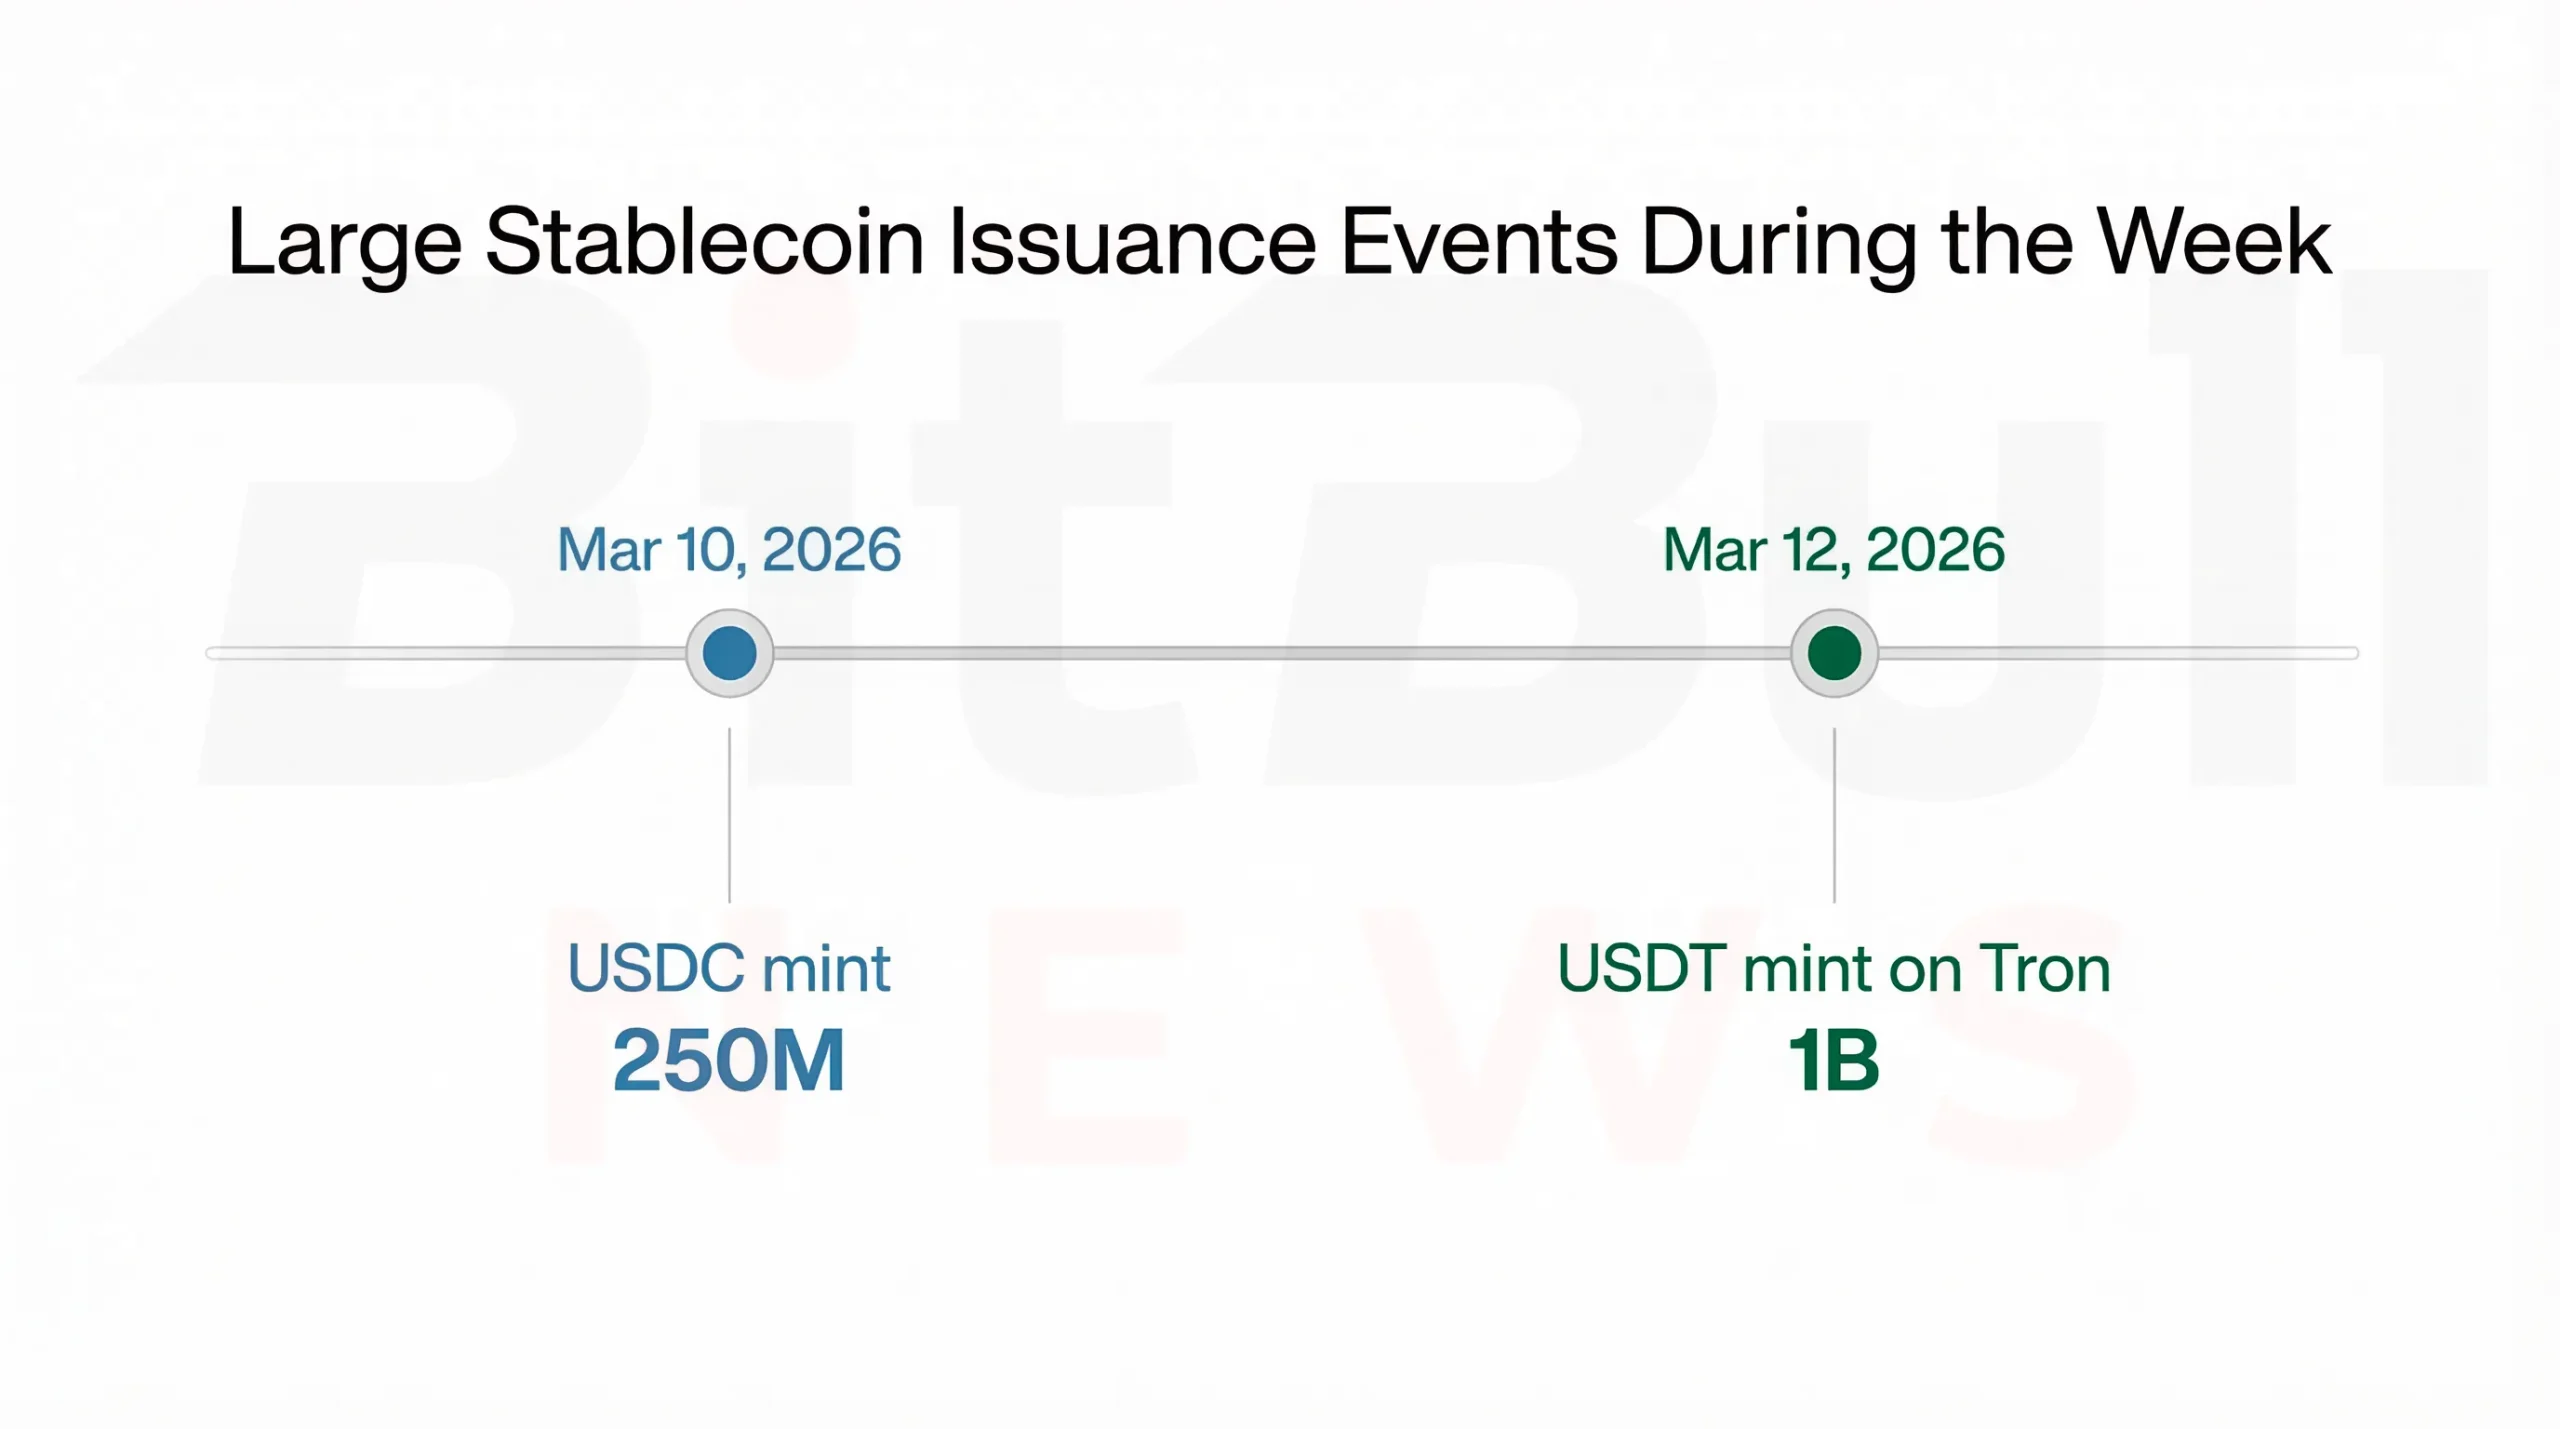
These events matter, but they should not be overinterpreted. A mint is not automatically proof of net new market demand. It can also represent inventory management, pre-positioned liquidity, or issuer-side operational preparation before distribution. That is why a single mint headline is useful as a signal, but incomplete as a conclusion. What really matters is where the newly created supply goes next: exchanges, custody, DeFi, OTC channels, or internal treasury routing.
Weekly issuance / redemption table for required stablecoins
| Stablecoin | Weekly minted volume | Weekly burned volume | Net issuance | Notes |
|---|---|---|---|---|
| USDT | ≥ 1.0B | Unspecified | Unspecified | At least one 1B mint on Tron was publicly reported |
| USDC | ≥ 0.25B | Unspecified | Unspecified | At least one 250M mint was publicly reported |
| BUSD | Unspecified | Unspecified | Unspecified | Legacy supply; market cap now very small |
| DAI | Unspecified | Unspecified | Unspecified | No complete public weekly mint/burn series in this run |
| TUSD | Unspecified | Unspecified | Unspecified | Snapshot supply only |
| FRAX | Unspecified | Unspecified | Unspecified | Snapshot circulating supply only |
| USTC | Unspecified | Unspecified | Unspecified | Legacy depegged monitor, not active peg liquidity |
The most honest interpretation here is that the window showed visible issuance capacity, not a fully measurable week of net supply expansion. The market should treat this as a reminder that public large-mint alerts are useful, but incomplete without burn data and distribution changes.
Inter-Venue and Onchain Flows
This is where the report becomes more interesting than a simple market-cap summary.
The source document highlights that, during at least one 24-hour snapshot within the broader reporting window, USDC and USDT were among the largest net outflows from centralized exchanges. CoinGecko’s exchange-flow snapshot showed approximately $2.36 billion in USDC net outflows and $2.17 billion in USDT net outflows in one recent 24-hour window. That is not a weekly aggregate, but it is still highly relevant.
Why does this matter? Because stablecoin flows tell a different story depending on direction:
- Into exchanges: often interpreted as deployable buying power preparing for trading activity.
- Out of exchanges: often interpreted as risk reduction, self-custody movement, DeFi deployment, or venue rotation.
- Into bridges and L2 wrappers: often interpreted as execution-layer migration rather than systemwide exit.
In other words, stablecoin supply can stay large while exchange-visible liquidity shrinks. That is exactly why flow analysis matters more than aggregate market cap in some weeks. A market with stable supply but falling exchange balances can behave very differently from one with fresh inflows into trading venues.
Token-level flow readouts (24-hour snapshots)
The report also notes token-level CoinGecko flow panels showing:
- USDC: overall net flow around -$2.48 billion, with CEX net flow near -$2.60 billion, alongside massive gross DEX flows and a small positive DEX net flow.
- USDT: overall net flow around -$874 million, with CEX net flow around -$846.8 million and a smaller DEX net outflow.
These are directional indicators, not a complete weekly dataset, but they still suggest a market where stablecoin liquidity was being moved, re-routed, or de-risked, not simply held static.
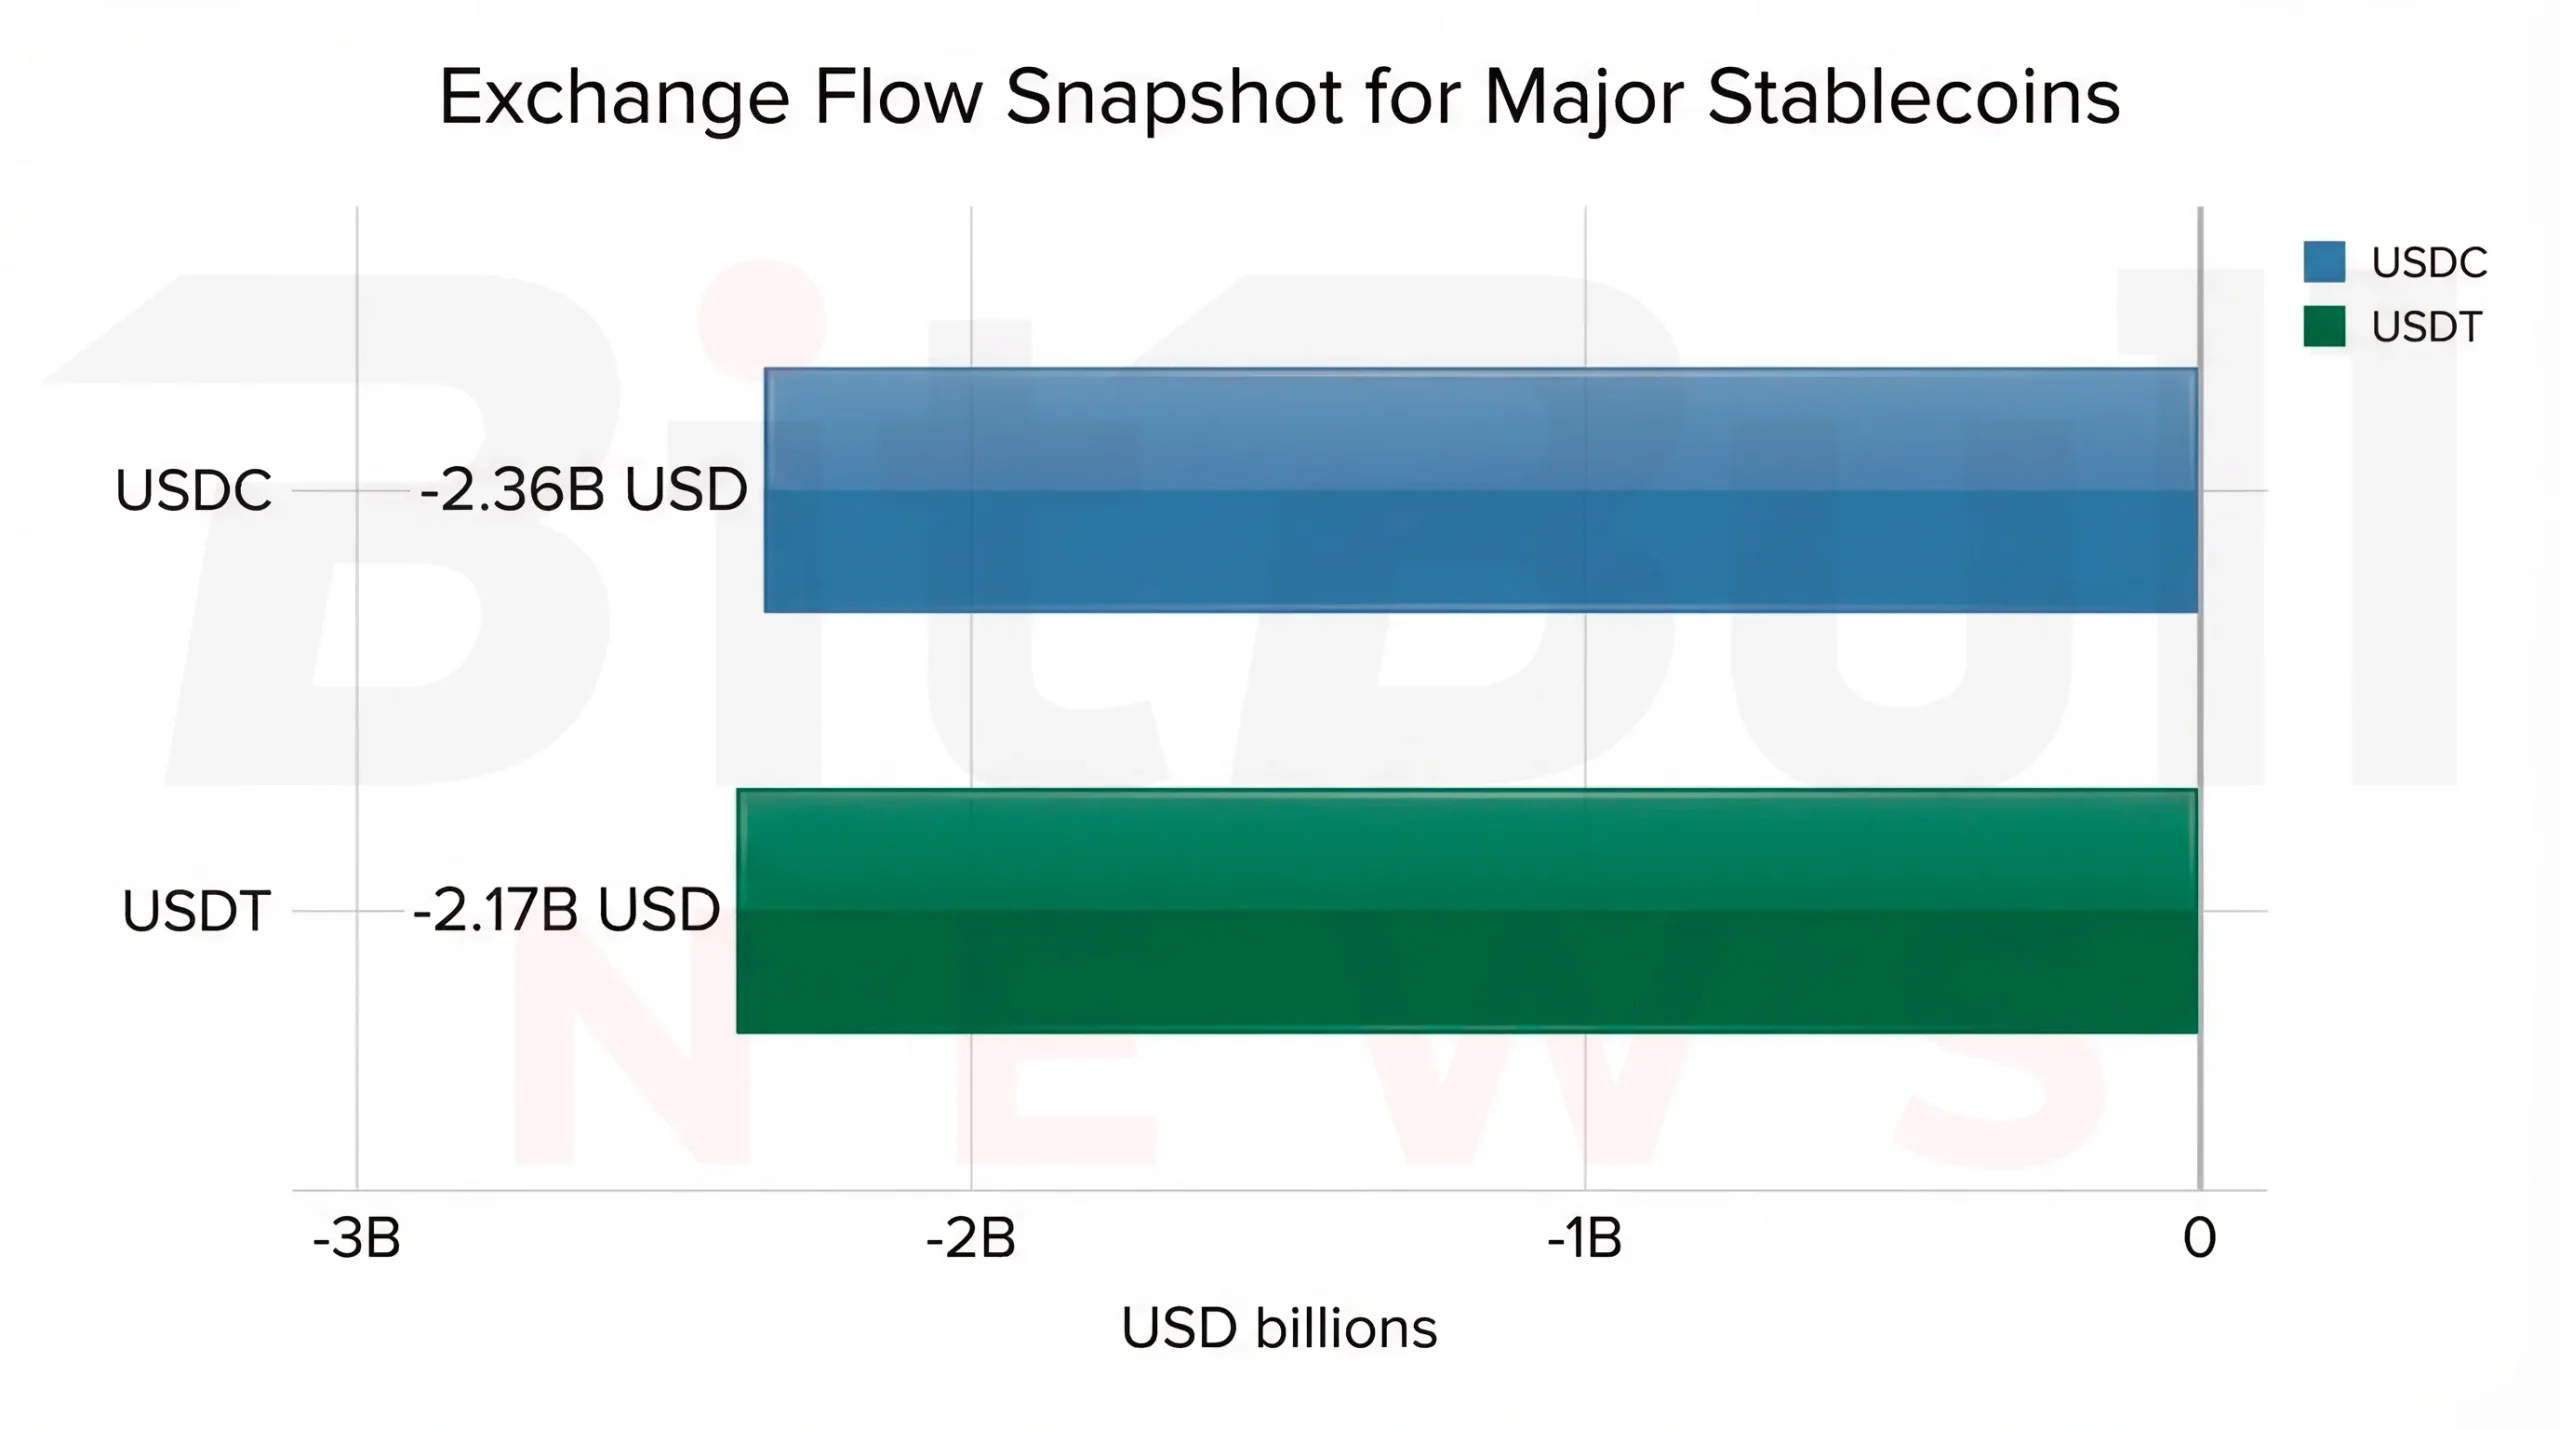
Chart 2: In at least one 24-hour window during the March 8–16 period, USDC and USDT ranked among the largest exchange outflows, consistent with capital rotation into wallets, DeFi, or off-exchange custody.
Bridges, Wrappers, and L2 Routing
Stablecoin movement increasingly happens through bridges and wrapped forms, not just direct L1 transfers. The report explicitly points to this as a reason why a proper stablecoin monitor should treat bridged versions of USDT and USDC as separate flow objects rather than as invisible technical details. That is a good methodological point.
Two examples highlighted in the source document:
- L2 Standard Bridged USDT on Base showed a small positive net-flow signal in one 24-hour snapshot.
- Polygon Bridged USDC / USDC.E showed a modest negative net-flow signal split across exchange and DEX behavior.
These are not the biggest numbers in the report, but they matter because they reveal something about where execution is migrating. If stablecoins move from main centralized venues toward L2s, bridge routes, and secondary wrappers, then the market is effectively shifting its operational center of gravity even if total supply stays roughly unchanged.
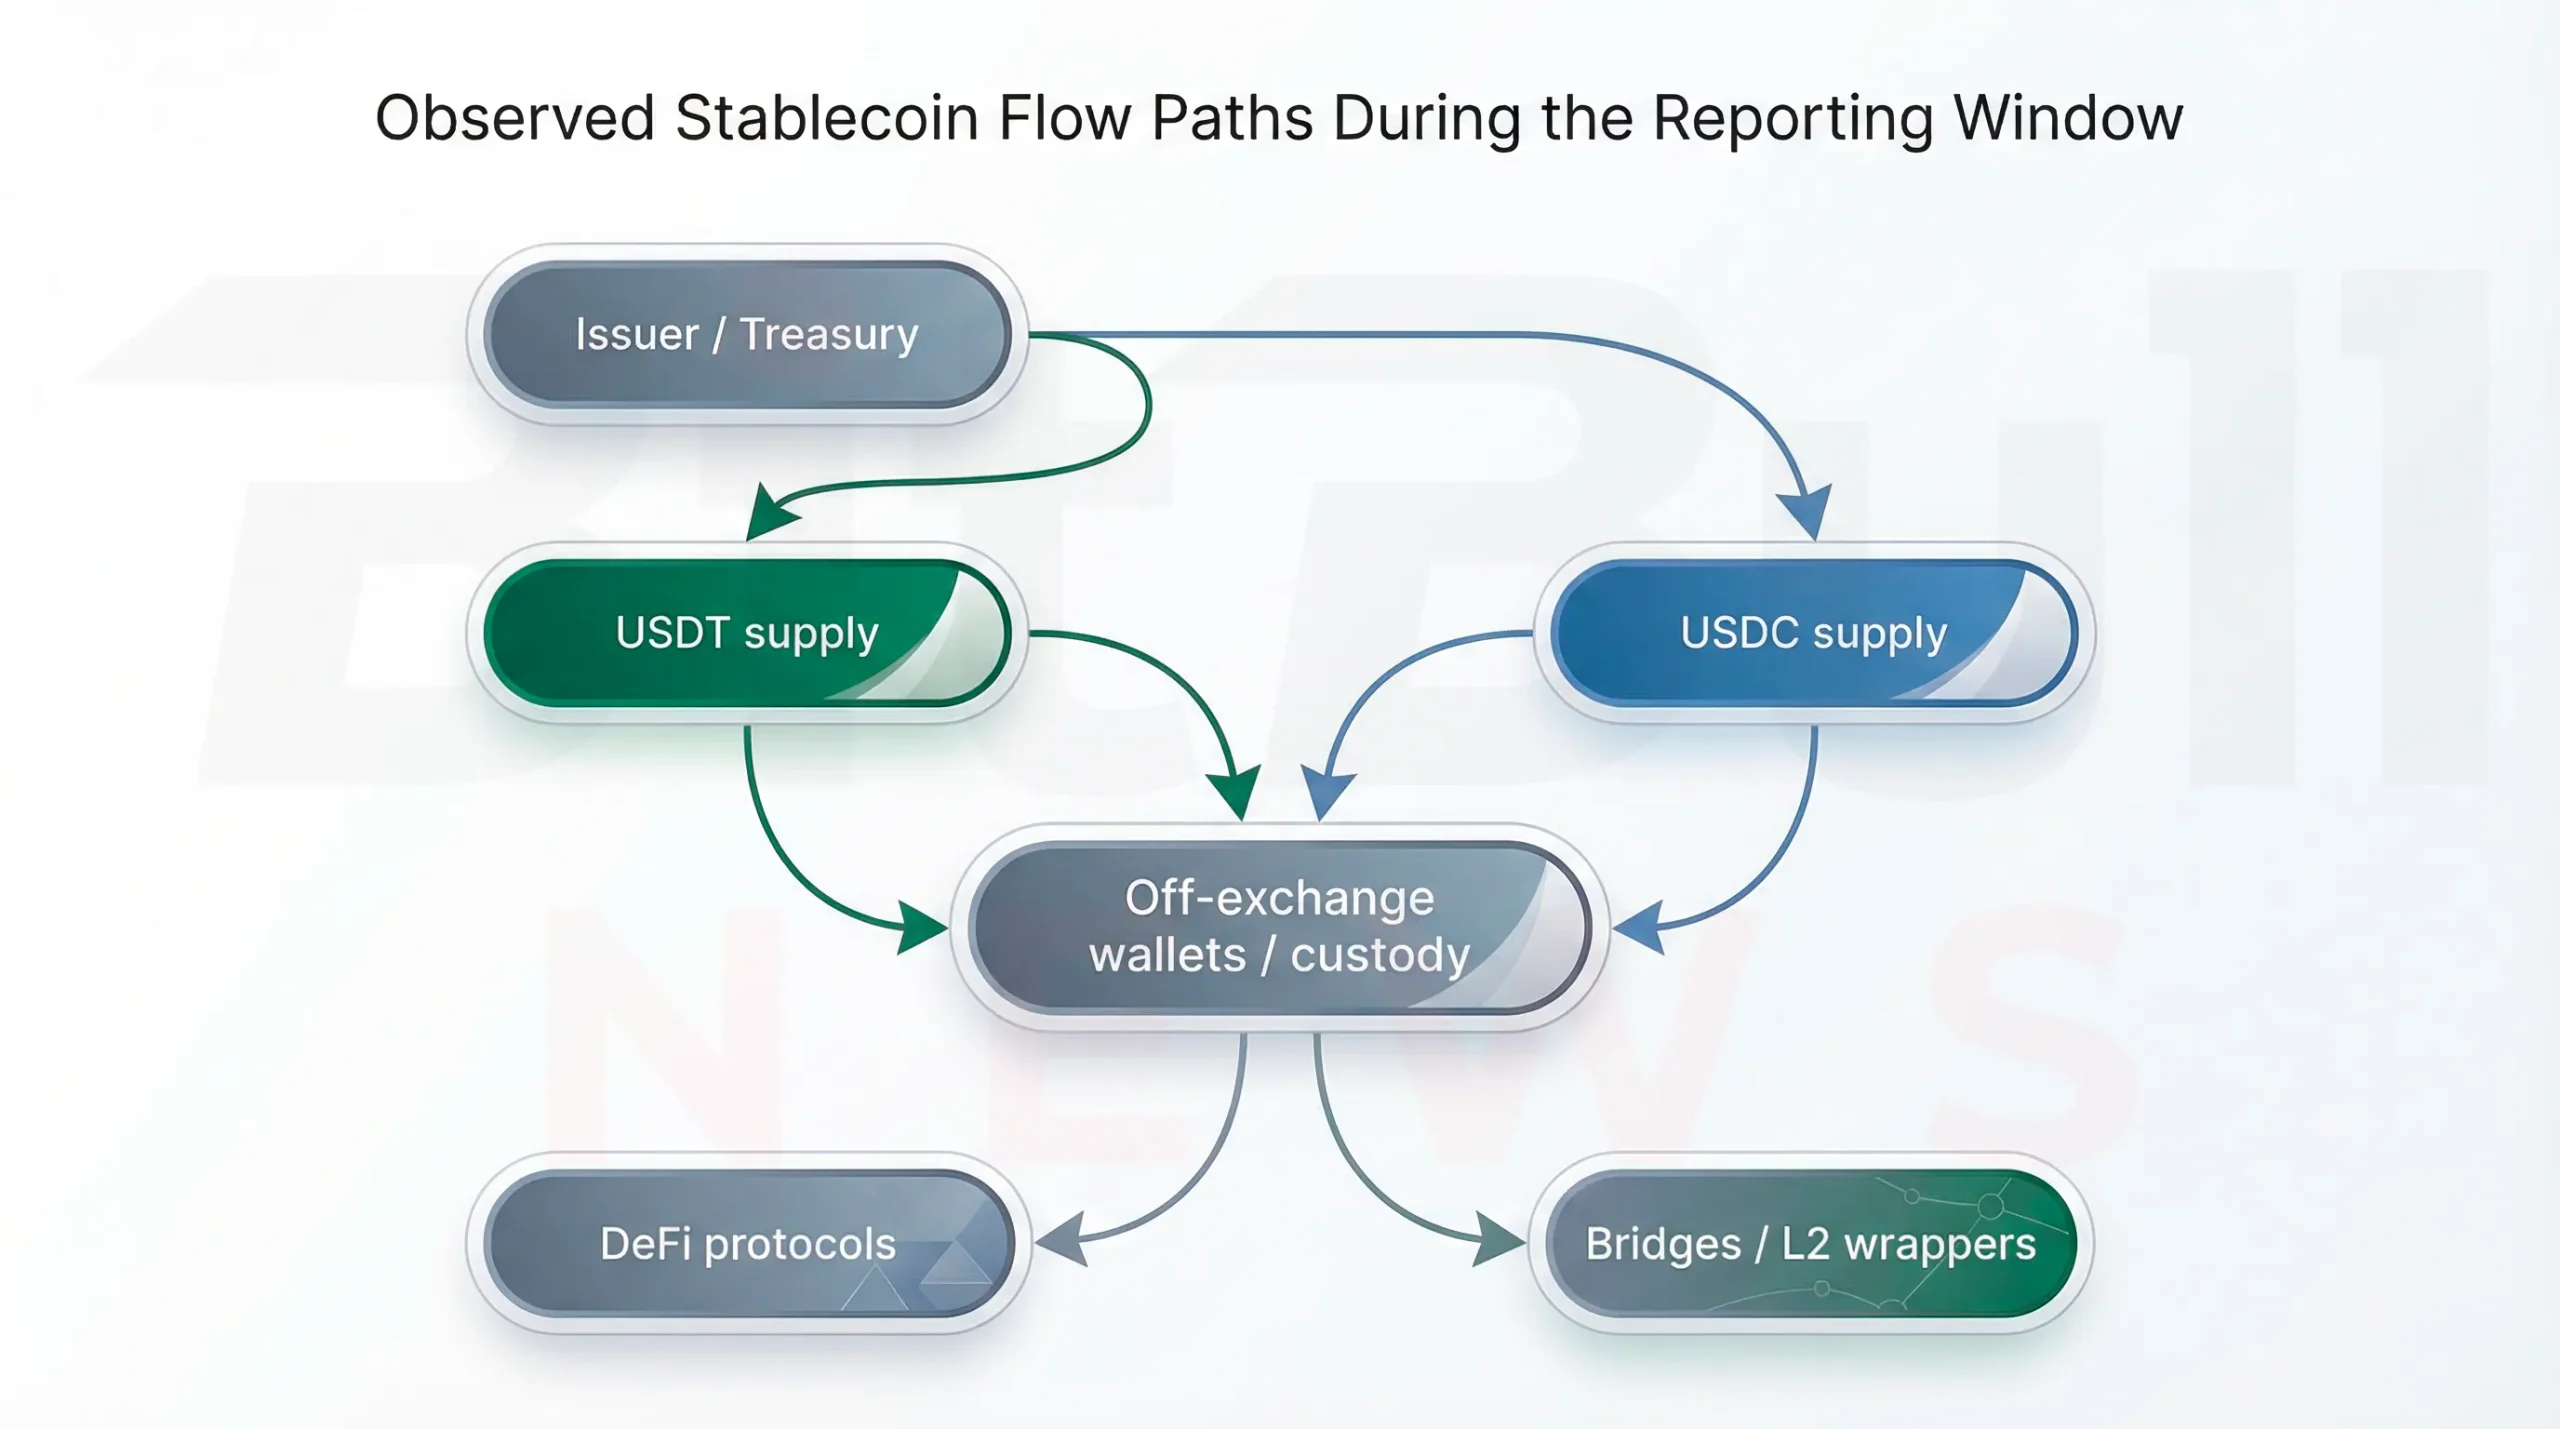
Chart 3: The observed flow pattern suggests that the key action during the week was not only new issuance, but how liquidity moved away from centralized venues and into alternative execution or custody environments.
Reserves, Chain Liquidity, and Peg Health
Stablecoin flow analysis is incomplete without reserve quality and chain distribution.
For fiat-backed products, reserve design matters because stress events do not hit all stablecoins equally. The report notes that explanatory materials describe USDT as backed by a broader basket of offchain reserve assets, while USDC is presented as backed by cash and short-duration U.S. Treasuries. That distinction matters when markets are testing redemption confidence or reserve transparency. It is not just a balance-sheet detail. It changes how traders and institutions interpret stablecoin risk during volatility.
The report also references commentary raising concerns about Tether’s equity cushion and reserve-mix risk. Even though that is not a week-specific event, it remains part of the market’s structural backdrop. When the system is this concentrated, issuer-quality concerns are not isolated. They are systemic.
On chain distribution, the source document points to a useful baseline from early 2026 where Ethereum and Tron together hosted the majority of stablecoin supply, with an example split of roughly:
- Ethereum: ~58%
- Tron: ~28%
- Solana: ~5%
- BNB Chain: ~4%
That is a useful reminder that chain-level concentration is layered on top of issuer concentration. Stablecoin risk is not only about which issuer dominates. It is also about which networks dominate the settlement and transfer base.
Peg health notes
- USTC should be treated purely as a legacy/depeg monitor, not as an active cash-like unit.
- BUSD is now effectively a run-off product rather than a systemwide liquidity pillar.
- For active stablecoins, peg health matters most when deviations persist and coincide with redemption or liquidity stress rather than brief market noise.
That means the modern stablecoin market should be monitored using issuer concentration + chain concentration + flow behavior + reserve quality, not simply “is it close to $1 today?”
Concentration and Distribution
The market-cap concentration section is one of the strongest parts of the report because it clarifies just how narrow the stablecoin system still is.
Using the source snapshot, total stablecoin market cap was about $310.8 billion. With USDT and USDC combined at about 84.6%, the market remains highly concentrated in two names. The report also notes a rough concentration estimate using a simplified HHI-style partition, though it correctly flags that the calculation is upward-biased because “others” are grouped together rather than split individually. The core point still stands: concentration remains high enough that issuer-specific events can quickly become marketwide events.
The document also highlights another important layer: holder concentration. A separate February overview cited in the report suggested that USDT, USDC, and DAI were relatively broadly held, with the top 10 wallets holding around 23%–26% of supply, while many smaller stablecoins remain far more concentrated. This matters because concentration at the wallet level can amplify redemption shocks, increase the impact of a few large holders, and create unstable liquidity when only a narrow holder base is active.
| Metric | Reading | Why it matters |
|---|---|---|
| Total stablecoin market cap | ~$310.8B | Shows the scale of the category |
| USDT share | 59.19% | Dominant issuer and liquidity rail |
| USDC share | 25.36% | Second major pillar of the market |
| Top-2 combined share | ~84.6% | Stablecoin market remains structurally concentrated |
| Smaller stablecoins | Highly fragmented | Many are niche, ecosystem-specific, or legacy |
| Holder concentration (major names) | Top 10 wallets ~23%–26% | Broader than smaller rivals, but still relevant for risk |
What the Week Actually Means
The most important insight from this reporting window is that stablecoins should not be read as a single bullish or bearish signal.
Large mints alone do not make a week risk-on, just as weekly exchange outflows are not necessarily bearish. Furthermore, functional stability cannot be assumed simply because the market cap remains stable. The market only becomes readable when issuance, distribution, flows, and policy context are interpreted together.
This week suggested the following:
- Supply remained large and structurally important.
- Issuer concentration remained extremely high.
- At least two major mint events signaled issuance capacity.
- Exchange outflow snapshots suggested liquidity was leaving centralized venues.
- Policy risk remained active, especially for regulated stablecoin frameworks.
That combination points to a market where stablecoins are still growing as core infrastructure, but where the most important question is increasingly not “how much supply exists?” but “where is that supply positioned and under what rules?”
BitBullNews View
From a BitBullNews perspective, the week of March 8–16 was not about a dramatic stablecoin shock. It was about infrastructure behavior under concentration.
USDT and USDC still dominate the system. Large-mint headlines continue to shape sentiment. Exchange outflows remain one of the best directional clues for positioning changes. And regulators are still actively shaping the perimeter in which stablecoins can grow.
That makes stablecoins less like a passive “digital cash” category and more like a real financial market layer with its own concentration risks, routing logic, and regulatory sensitivity. In this market, the next important move may not come from total supply alone. It may come from where liquidity leaves, where it reappears, and which issuers or chains the market trusts most when pressure rises.
Key Findings
- Total stablecoin market capitalization remained around $310.8B in the report’s reference snapshot.
- USDT and USDC combined for roughly 84.6% of the stablecoin market.
- A 250M USDC mint and a 1B USDT mint on Tron were publicly flagged during the reporting window.
- Exchange-flow snapshots showed large USDC and USDT outflows from centralized venues in at least one 24-hour period.
- Stablecoin routing through bridges and L2 wrappers remained an important secondary layer of flow analysis.
- USTC remains a legacy/depeg monitor, not a functioning modern stablecoin.
- Policy risk remained active after the Bank of England signaled openness to revising parts of its stablecoin regime.
Final Verdict
Weekly verdict: Structurally constructive, operationally cautious
Stablecoins remained one of the strongest pillars of crypto market infrastructure during March 8–16, 2026. The category stayed large, concentrated, and actively used. But the week also showed why simple market-cap readings are not enough. Large issuance events, exchange outflows, bridge routing, and regulatory uncertainty all matter for understanding what stablecoin liquidity is really doing.
The clearest conclusion is this:
stablecoin supply stayed strong, but the more important signal was where liquidity moved and how concentrated the system still remains.