


Content
The past twelve months were a real growth year for tokenized real-world assets, but not in the way the market often presents them. The headline number looks impressive. The visible tokenized-asset universe tracked on public rails stood near $26.78 billion in distributed assets and roughly $352.40 billion in represented assets near the end of the reporting window. But that split is the real story: most “tokenized value” still does not behave like a freely transferable, wallet-native crypto asset. It behaves more like blockchain-assisted recordkeeping, reconciliation, and controlled market infrastructure.
That distinction matters because the RWA narrative is often flattened into a single claim: traditional assets are “coming onchain.” They are, but with very different degrees of actual mobility. In tokenized treasuries, the year’s defining trend was onchain cash management. In tokenized credit, large represented structures still dominate total value. In tokenized public equities, market value is smaller, but transfer activity is unusually high, suggesting a more trading-heavy, venue-like profile.
For BitBullNews readers, the most important conclusion is this: tokenized does not automatically mean liquid, portable, or DeFi-native. Investors, banks, custodians, and asset managers need to separate true distributed tokenization from represented or mirrored structures that use blockchain as a controlled operational layer rather than as an open settlement environment.
Market Structure Snapshot
The market is highly bifurcated. The report’s core framework separates distributed assets from represented assets. Distributed assets can move to external wallets and be transferred peer-to-peer, including under allowlist conditions. Represented assets cannot move freely between external wallets, either by design or because of legal, compliance, or infrastructure constraints. That framework is not cosmetic. It changes how the market should be valued and how liquidity should be interpreted.
On the distributed side, Ethereum remained the center of gravity with about $15.3 billion, or roughly 56.9% of visible distributed RWA value. BNB Chain followed with about $2.9 billion, then Liquid Network at about $1.9 billion, Solana at $1.7 billion, Stellar at $1.4 billion, and a smaller but meaningful long tail across Arbitrum, Avalanche, XRPL, and Polygon. That concentration shows that public-chain RWA activity is still very far from evenly distributed.
At the same time, the much larger represented side of the market shows that a substantial share of institutional tokenization still prioritizes controlled books-and-records design over open composability. The report points to examples such as Figure HELOC Token, with about $15.8 billion in represented value, and the BNY Mellon / Goldman Sachs mirrored money-market-fund model, where ownership is mirrored onchain while official records and settlement remain inside a controlled institutional framework. That is a meaningful form of tokenization, but it is not the same product category as a wallet-movable treasury token or a DeFi-compatible bearer instrument.
Leading Networks by Distributed RWA Value
The network table from the source report is one of the most useful framing devices because it makes clear where actual distributed RWA value sits.
| Rank | Network | Distributed RWA count | Total value | Share | Notes |
|---|---|---|---|---|---|
| 1 | Ethereum | 498 | ~$15.3B | 56.90% | Main center of gravity for treasury and credit primitives |
| 2 | BNB Chain | 284 | ~$2.9B | 10.96% | Large treasury and high-velocity tokenized assets footprint |
| 3 | Liquid Network | 6 | ~$1.9B | 7.08% | Small number of large-value instruments |
| 4 | Solana | 341 | ~$1.7B | 6.24% | Material tokenized equities and select treasury presence |
| 5 | Stellar | 33 | ~$1.4B | 5.16% | Strong role in tokenized MMF shares and multi-asset issuance |
| 6 | Arbitrum | 205 | ~$813.4M | 3.03% | Multi-chain treasury distribution venue |
| 7 | Avalanche | 52 | ~$589.0M | 2.20% | Appears in treasury and fund-distribution structures |
| 8 | XRP Ledger | 15 | ~$459.7M | 1.71% | Non-EVM rail for select treasury products |
| 9 | Polygon | 56 | ~$450.1M | — | Snapshot affected by explorer-access limitations in the source environment |
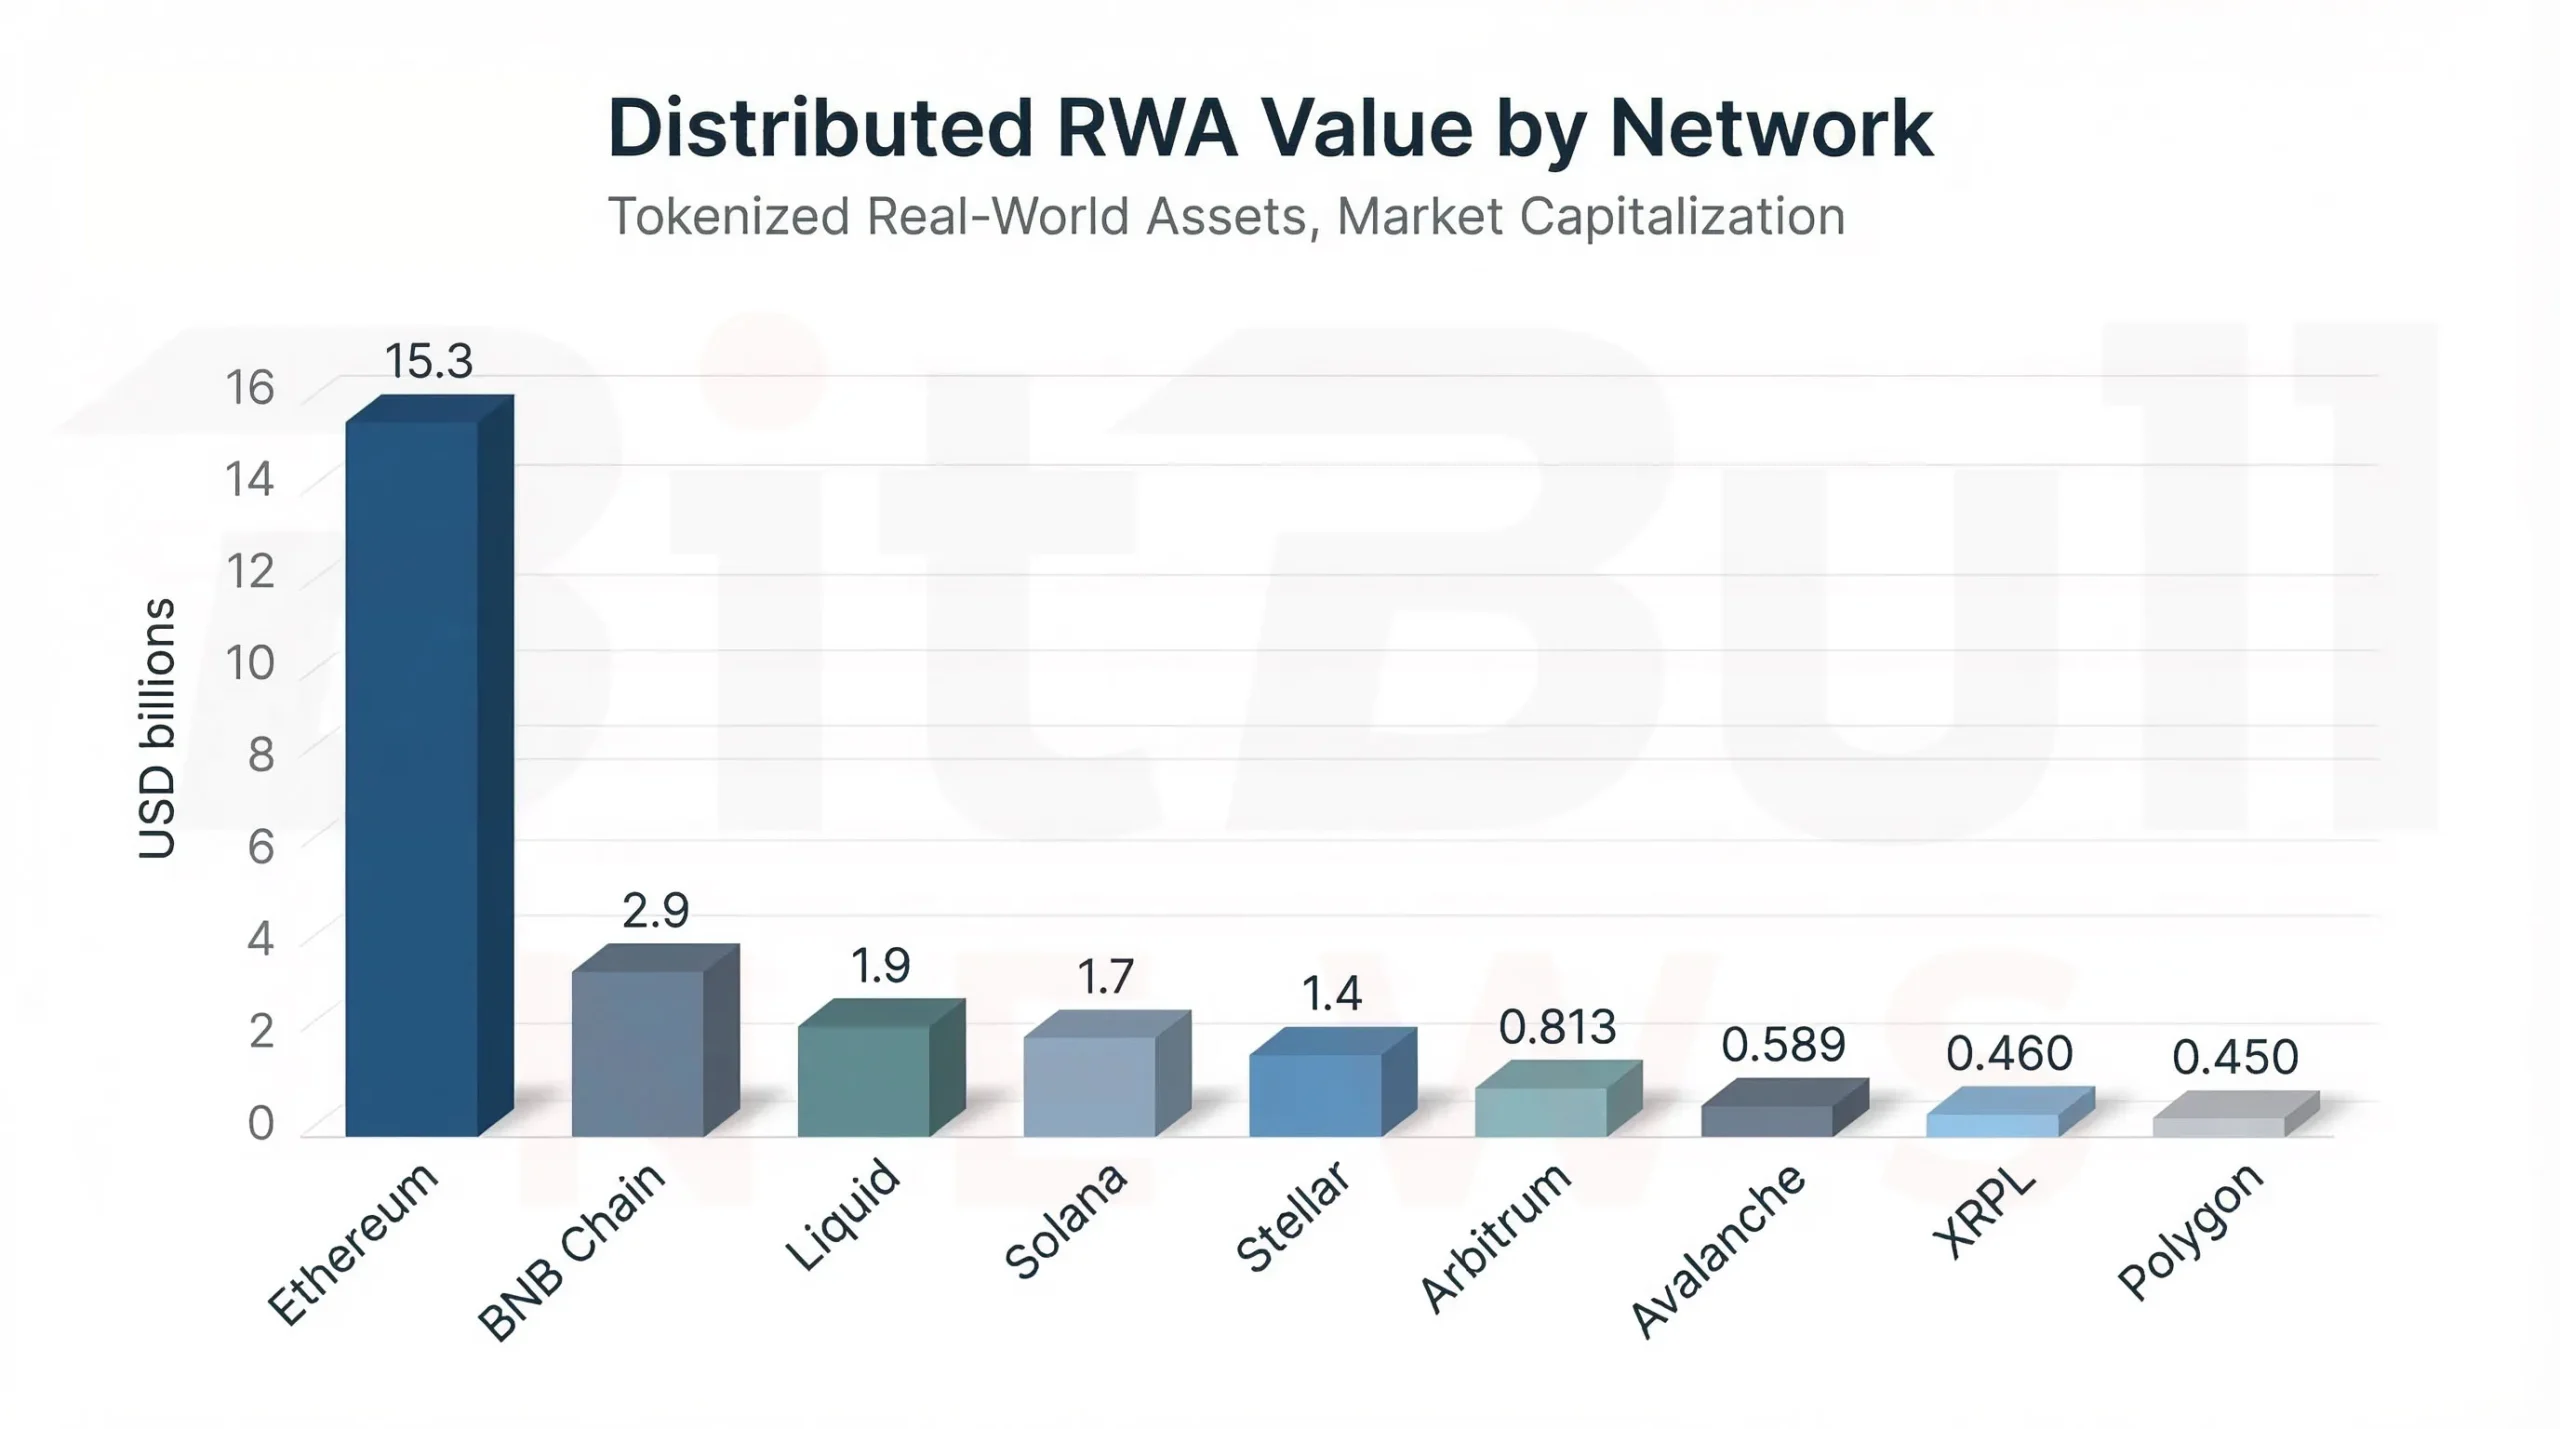
Chart 1. Distributed RWA value by network near the end of the reporting period. Ethereum remained the dominant public-chain home for distributed RWAs, with BNB Chain, Liquid, Solana, and Stellar forming the next tier.
The main takeaway from this chart is that RWA tokenization on public rails is not a multi-chain free-for-all. It is still concentrated in a small set of ecosystems, and Ethereum remains the default gravity center for treasury and credit-style instruments. That gives Ethereum a structural advantage in settlement credibility, infrastructure density, and institutional familiarity, even as other chains carve out specialized niches.
Tokenized Treasuries and Money-Market Instruments
The strongest investable RWA category over the last year was clearly tokenized treasuries and money-market-style products. The report frames this correctly: the dominant story is not speculative tokenization, but cash management going onchain.
The growth anchors are striking. The market moved from around $5.6 billion in April 2025 to about $6.75 billion in late July 2025, then around $7.45 billion in late August 2025, roughly $8.95 billion by mid-December 2025, more than $10 billion in late January 2026, and above $10.8 billion by late February 2026. Even allowing for the report’s use of anchored and interpolated values in the monthly visual, the direction is unmistakable: tokenized treasury products became one of the clearest real-use segments in the onchain asset market.
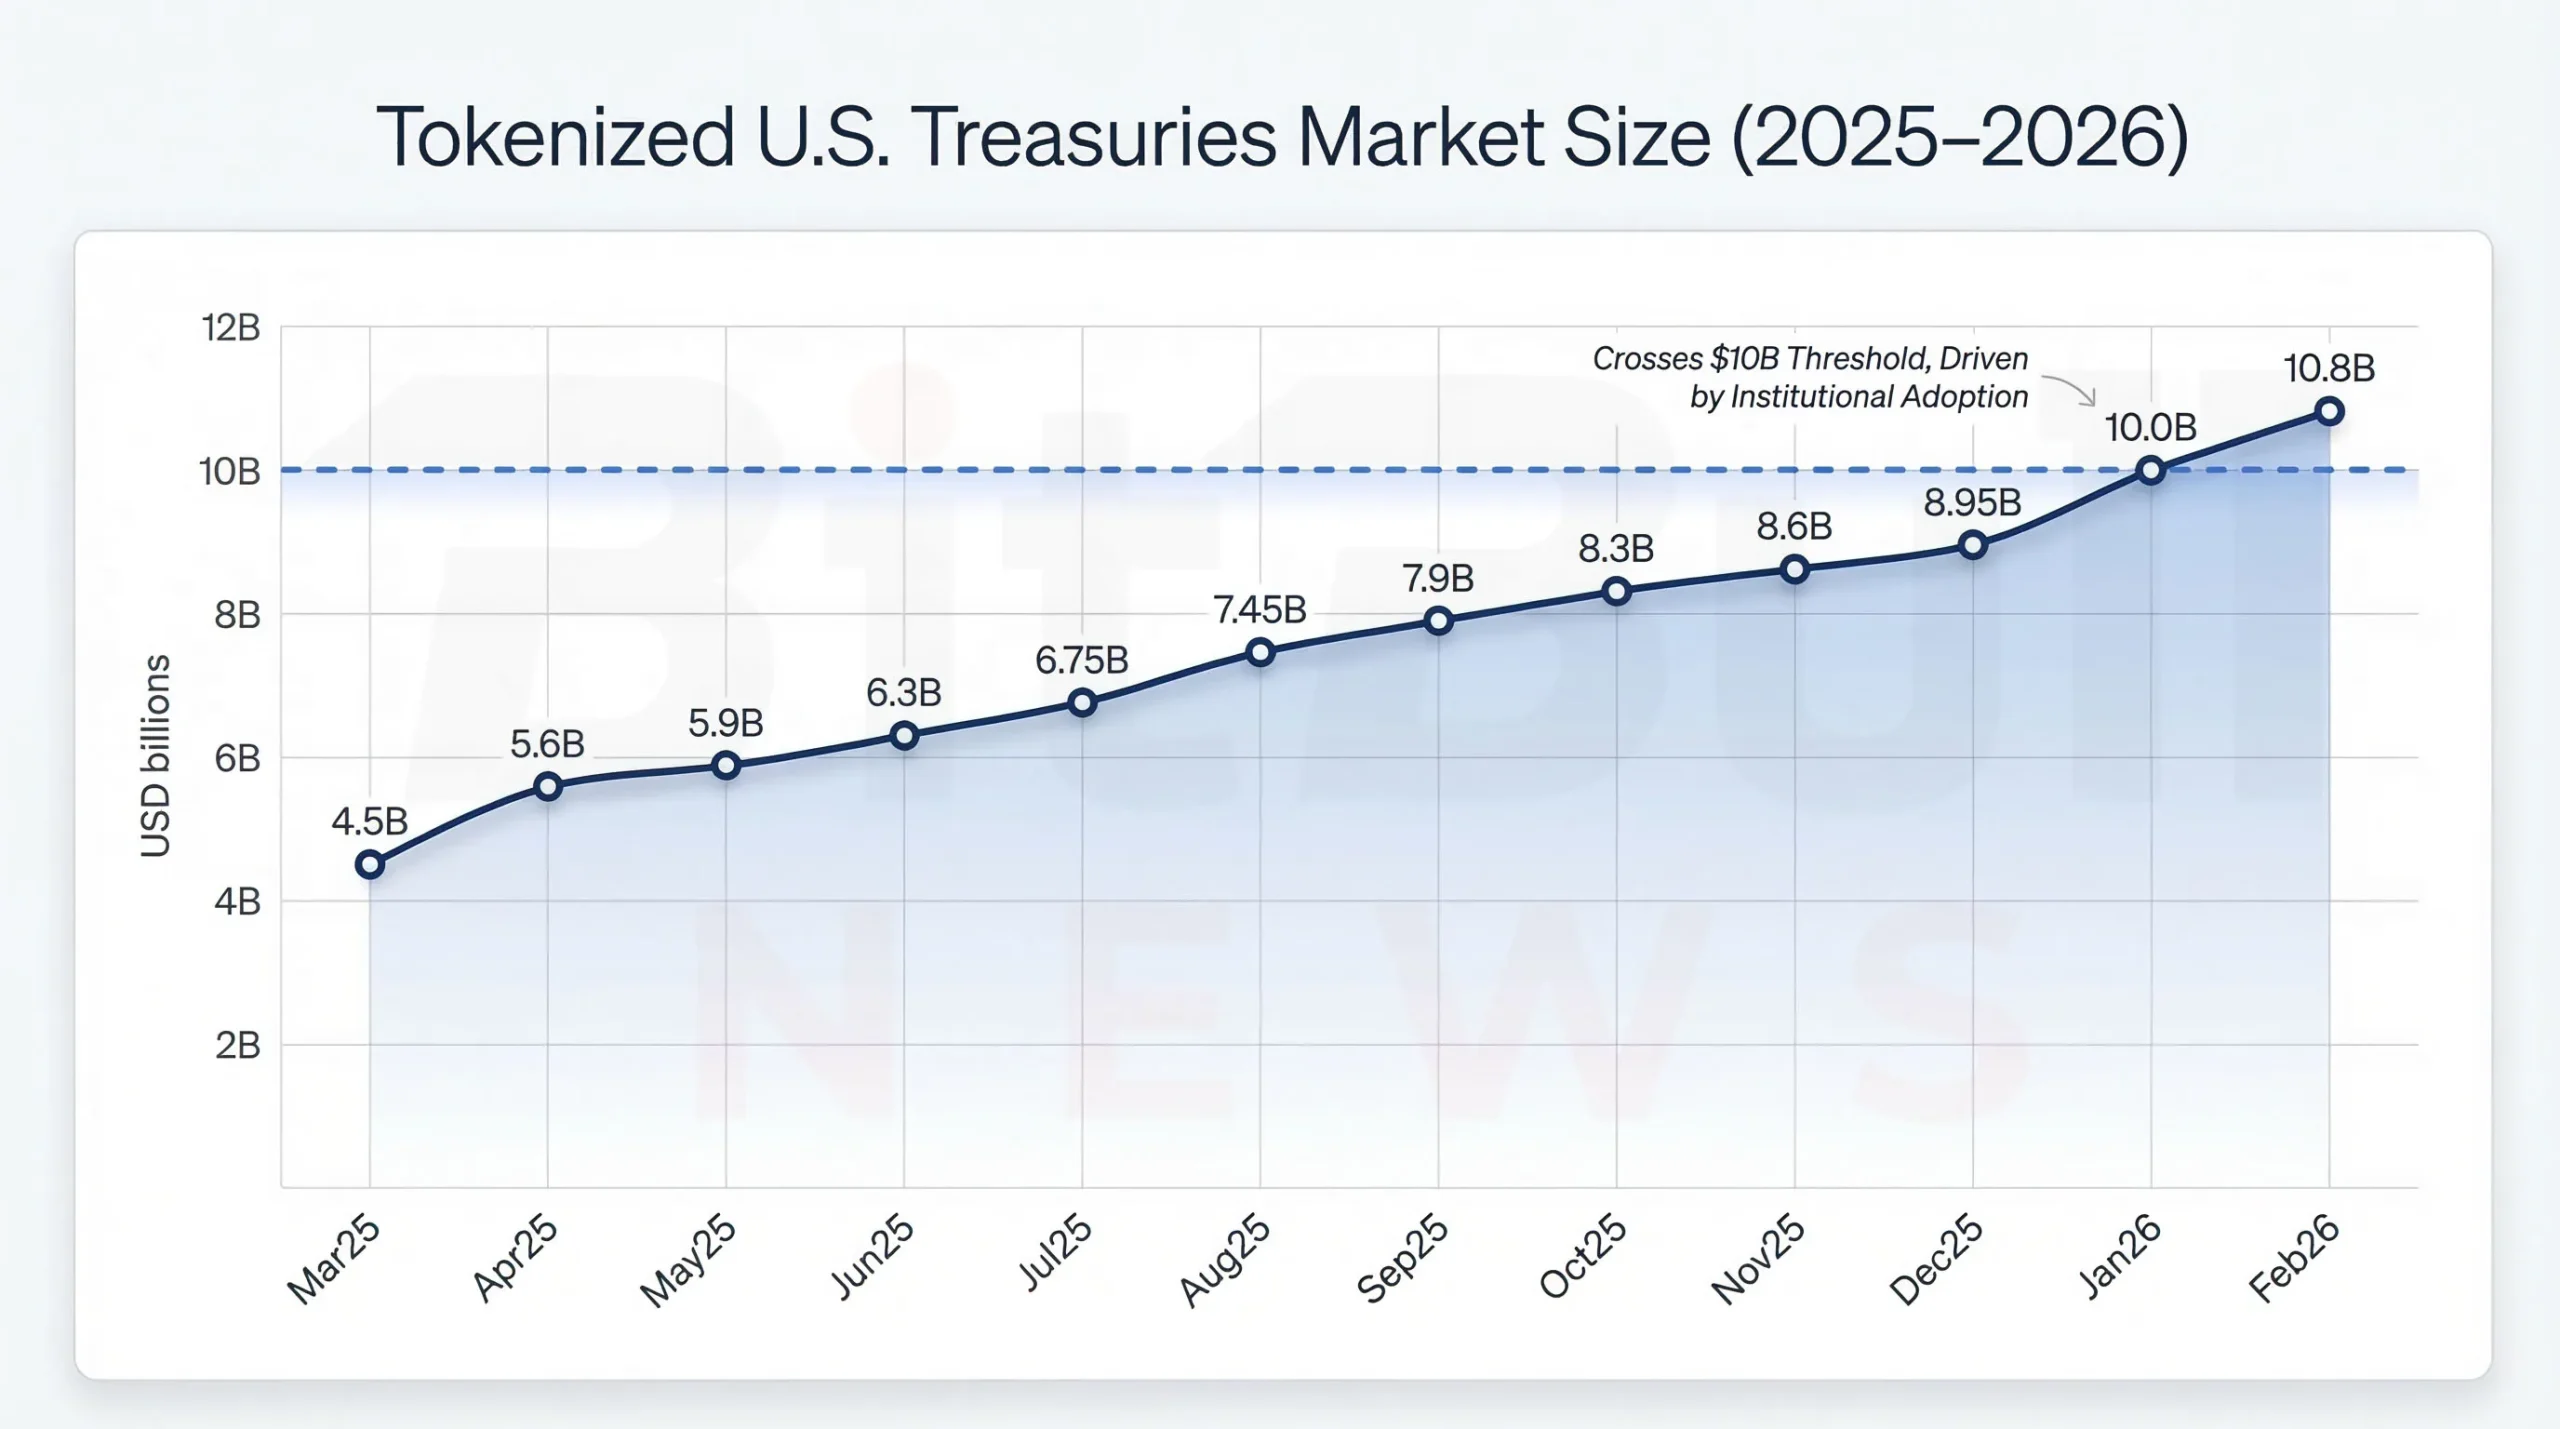
Chart 2. Tokenized U.S. Treasuries market size over the last year, using the report’s anchored data points and interpolated continuity between them.
This is where the RWA story becomes practical rather than theoretical. Treasury tokens are not trying to be the next meme trade. They are increasingly functioning as onchain versions of short-duration yield, treasury-bill exposure, and institutional cash parking, while B2B stablecoin treasury stacks are beginning to connect those products to real corporate workflows.
Leading treasury and money-market products
| Product | Issuer / platform | Domicile | Eligibility | AUM / total value | Monthly transfer volume / liquidity proxy |
|---|---|---|---|---|---|
| USYC | Circle | Bermuda | Non-U.S. investor | $2.219B | $535.37M |
| BUIDL | Securitize / BlackRock product | British Virgin Islands | U.S. qualified purchaser | $1.993B | $436.03M |
| USDY | Ondo | United States | Non-U.S. investor | $1.211B | $212.36M on Ethereum view |
| BENJI (FOBXX share token) | Franklin Templeton | United States | U.S. retail & institutional | $1.029B | Lower-to-modest by chain |
| WTGXX | WisdomTree | United States | U.S. retail & institutional | $0.756B | $51.00M |
| JTRSY | Centrifuge | British Virgin Islands | Professional investor | $0.666B | $49.82M |
| USTB | Superstate | United States | U.S. accredited / qualified purchaser | $0.646B | $223.24M on Ethereum view |
| CUMIU | Libeara | Hong Kong | Non-U.S. investor | $0.546B | $0 on Ethereum row shown |
| USTBL | Spiko | France | U.S. and global retail | $0.184B | Multi-network transfer volumes shown |
The most notable thing in this table is not just size. It is the mix of eligibility constraints, domiciles, and liquidity profiles. These are not generic public tokens in the crypto-native sense. Many of them are wrapped in familiar legal structures: Reg S-type non-U.S. offerings, accredited-investor access, qualified-purchaser gates, professional-investor restrictions, mutual-fund style structures, or UCITS-style frameworks. In other words, the product design is often as important as the chain.
Treasury market-share snapshot among leading products
Using the report’s top-set proxy of roughly $9.94 billion across the leading treasury-style products, issuer-grouping shares came out approximately as follows:
| Issuer grouping | Approx. share of top-set proxy |
|---|---|
| Circle (USYC) | ~22.3% |
| BlackRock / Securitize (BUIDL) | ~20.0% |
| Ondo (USDY + OUSG) | ~19.1% |
| Franklin Templeton (BENJI / FOBXX) | ~10.4% |
| WisdomTree (WTGXX) | ~7.6% |
| Remaining issuers | ~20.6% |
This is only a partial-market proxy, not a full market-share calculation. But it still tells an important story: the category is no longer just an early-stage niche. It already has identifiable leaders, recognizable asset-management brands, and visible concentration among a small top tier.
Tokenized Credit: Big Category, Split Reality
Tokenized credit is one of the biggest RWA segments in headline value, but it is also one of the most misunderstood. The report shows distributed tokenized credit of about $6.40 billion and represented tokenized credit of about $17.07 billion, for a combined total near $23.47 billion across 883 assets. That split is essential. Much of the value is not sitting in portable, open secondary market instruments. It is sitting in more controlled structures.
Platform market shares in tokenized credit
| Rank | Platform | Total value | Market share | Directionality (30D) |
|---|---|---|---|---|
| 1 | Maple | $2.6B | 40.46% | +14.33% |
| 2 | STOKR | $1.9B | 29.34% | +20.08% |
| 3 | Centrifuge | $467.8M | 7.30% | -39.86% |
| 4 | Hastra | $315.4M | 4.92% | +11.40% |
| 5 | Securitize | $254.5M | 3.97% | +0.54% |
| 6 | Asseto | $205.3M | 3.21% | 0% |
This table shows a market with real leaders, but also a market where platform structure matters enormously. Maple and STOKR control most of the visible value in the distributed snapshot, yet the category’s biggest single example of tokenized credit is still the represented Figure HELOC Token.
Largest credit instruments and the represented vs distributed divide
| Asset | Platform | Network | Tokenization type | Total value | Why it matters |
|---|---|---|---|---|---|
| Figure HELOC Token | Figure | Provenance | Represented | $15.796B | Very large value, but not wallet-portable liquidity |
| syrupUSDC | Maple | Ethereum | Distributed | $1.717B | Large holder base and visible transfer activity |
| Blockstream Mining Note 2 (BMN2) | STOKR | Liquid Network | Distributed | $1.303B | High-value security-token style instrument with jurisdictional metadata |
This is one of the most important sections in the report because it dismantles a common market shortcut. A large tokenized-credit number does not necessarily mean a large liquid onchain credit market. It may instead mean a large controlled-recordkeeping layer with limited DeFi-style portability. That is still economically meaningful, but it should not be sold as if it were open, composable credit liquidity.
Tokenized Public Equities: Smaller Value, Faster Turnover
The tokenized public-equities category is smaller by market capitalization, but much more active relative to its size. The report shows about $1.08 billion in total value, but around $2.30 billion in monthly transfer volume and roughly 190.6K holders. That is an unusually high-velocity profile compared with the broader RWA market.
Platform market shares in tokenized stocks
| Rank | Platform | Total value | Market share | Notes |
|---|---|---|---|---|
| 1 | Ondo | $644.0M | 60.49% | Dominant share of tokenized equities value |
| 2 | xStocks | $252.8M | 23.75% | Large share and fast recent growth |
| 3 | Securitize | $98.0M | 9.21% | Smaller set of instruments but meaningful share |
That high transfer velocity is encouraging from a market-activity perspective, but the legal caveat is crucial. The report explicitly notes that tokenized equities may be native onchain securities or synthetic representations. Those are not equivalent. A synthetic token can show substantial transfer activity while still offering a different legal and economic profile than a directly registered equity exposure. So the category looks “liquid” in usage terms, but investors still need to ask what exactly they own.
Evidence-Based Classification: Real Liquidity vs Tokenization Theater
One of the strongest parts of the research is the classification framework separating genuine market utility from superficial tokenization.
| Instrument / segment | Classification | Why | Primary risks |
|---|---|---|---|
| USYC | Real liquidity / distributed cash management | Large AUM, large transfer volume, major-chain distribution | Eligibility limits, fragmentation, concentration |
| BUIDL | Real adoption with gated liquidity | Large AUM, meaningful transfers, multi-chain deployment | High minimums, compliance gating, limited holder breadth |
| USDY | Real adoption, retail-accessible outside U.S. | High holder count, daily redemption, significant transfers | Cross-chain fragmentation, wrapper risk |
| Tokenized stocks (aggregate) | Real trading activity, but legal form varies | Transfer volume exceeds market value materially | Synthetic-vs-native exposure risk |
| Figure HELOC Token | Institutional recordkeeping, not DeFi-liquid | Huge represented value but non-portable | Portability and transparency trade-off |
| Mirrored MMF tokens via BNY / GS DAP | Controlled pilot / walled garden | Blockchain mirrors ownership but official records remain traditional | Limited open composability and reliance on infrastructure integration |
This table should become part of how BitBullNews treats the entire RWA narrative. The right question is not “Is it tokenized?” The right questions are:
- can it move,
- can it settle externally,
- can it be redeemed predictably,
- is there real transfer activity,
- and does the legal wrapper match the market’s implied liquidity narrative?
That is a much more useful lens than repeating gross tokenized-value numbers.
Geographic and Legal Concentration
The report also highlights domicile concentration across leading treasury products. Using the same top-set proxy, the approximate split was:
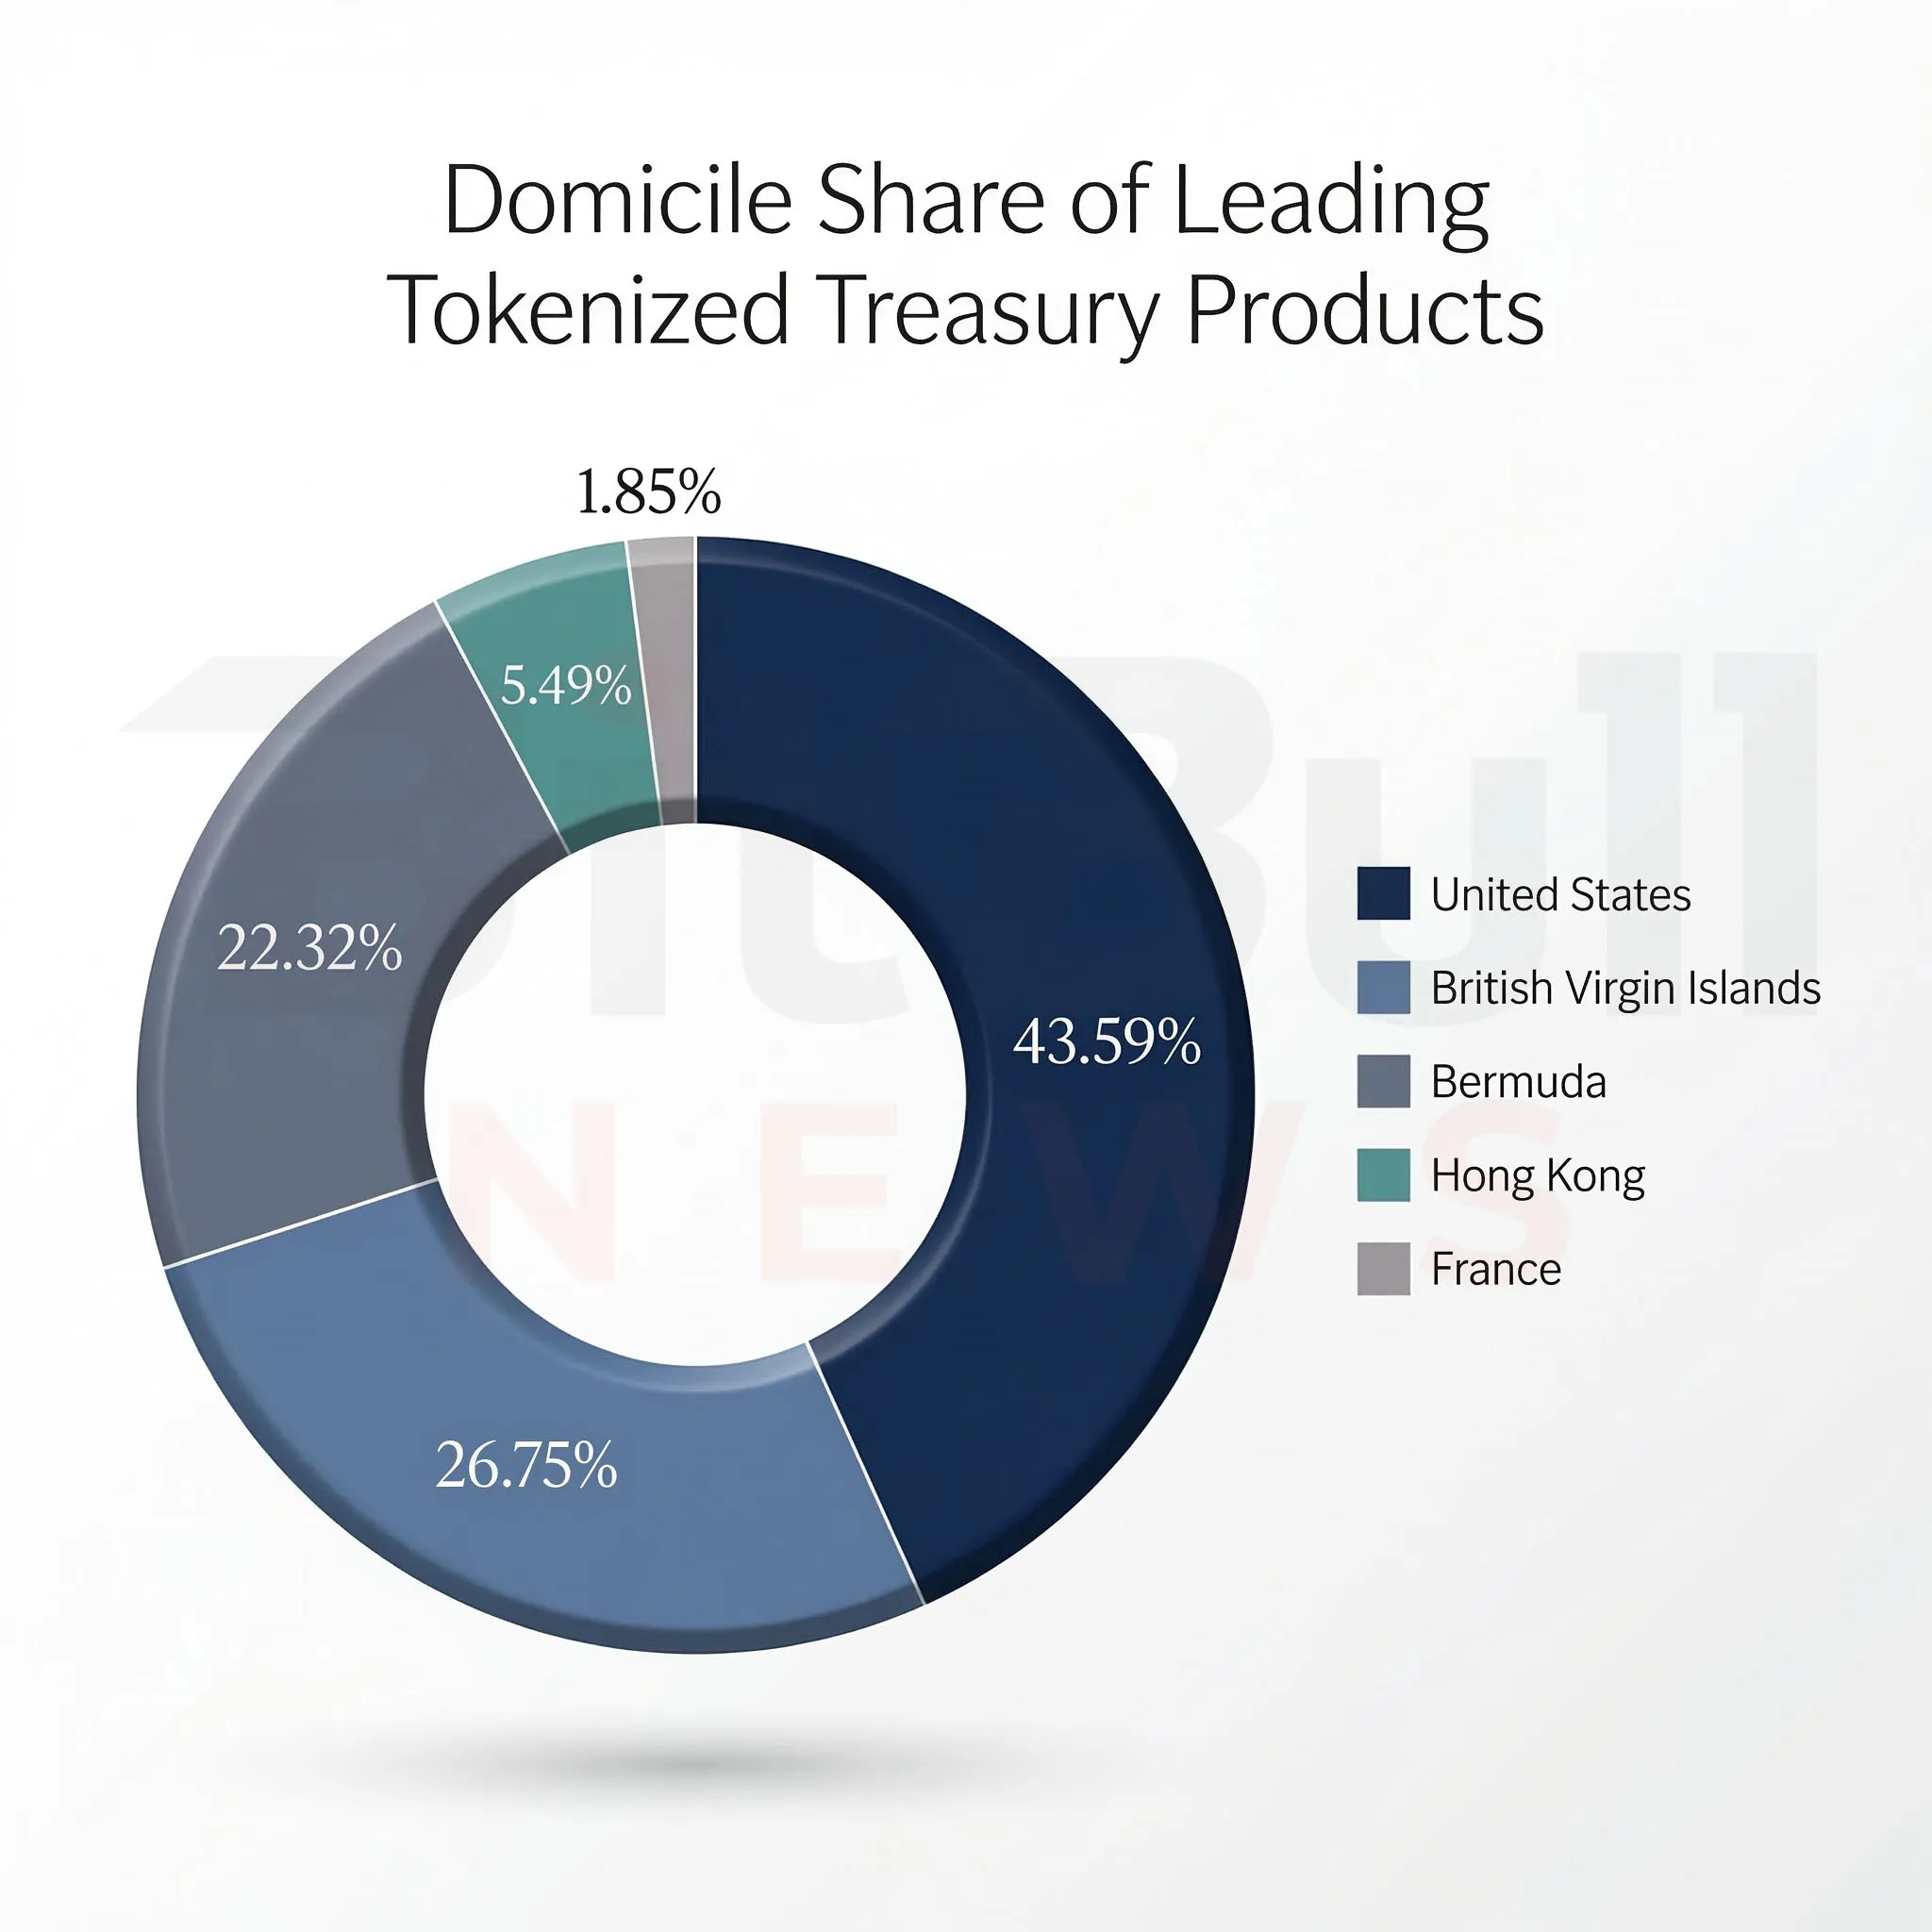
Chart 3. Domicile concentration among the leading tokenized treasury products in the source report’s top-set proxy.
This matters because tokenization is not escaping legal structure. It is being built through it. The dominant wrappers still rely on familiar exemptions and regulated frameworks: Reg S-style non-U.S. distribution, Reg D / Rule 506(c)-type restricted offerings, mutual-fund filings, professional-investor regimes, and UCITS-type structures. In other words, tokenization is not replacing traditional finance’s legal perimeter. It is being layered on top of it.
Timeline of the Last Year’s Key Milestones
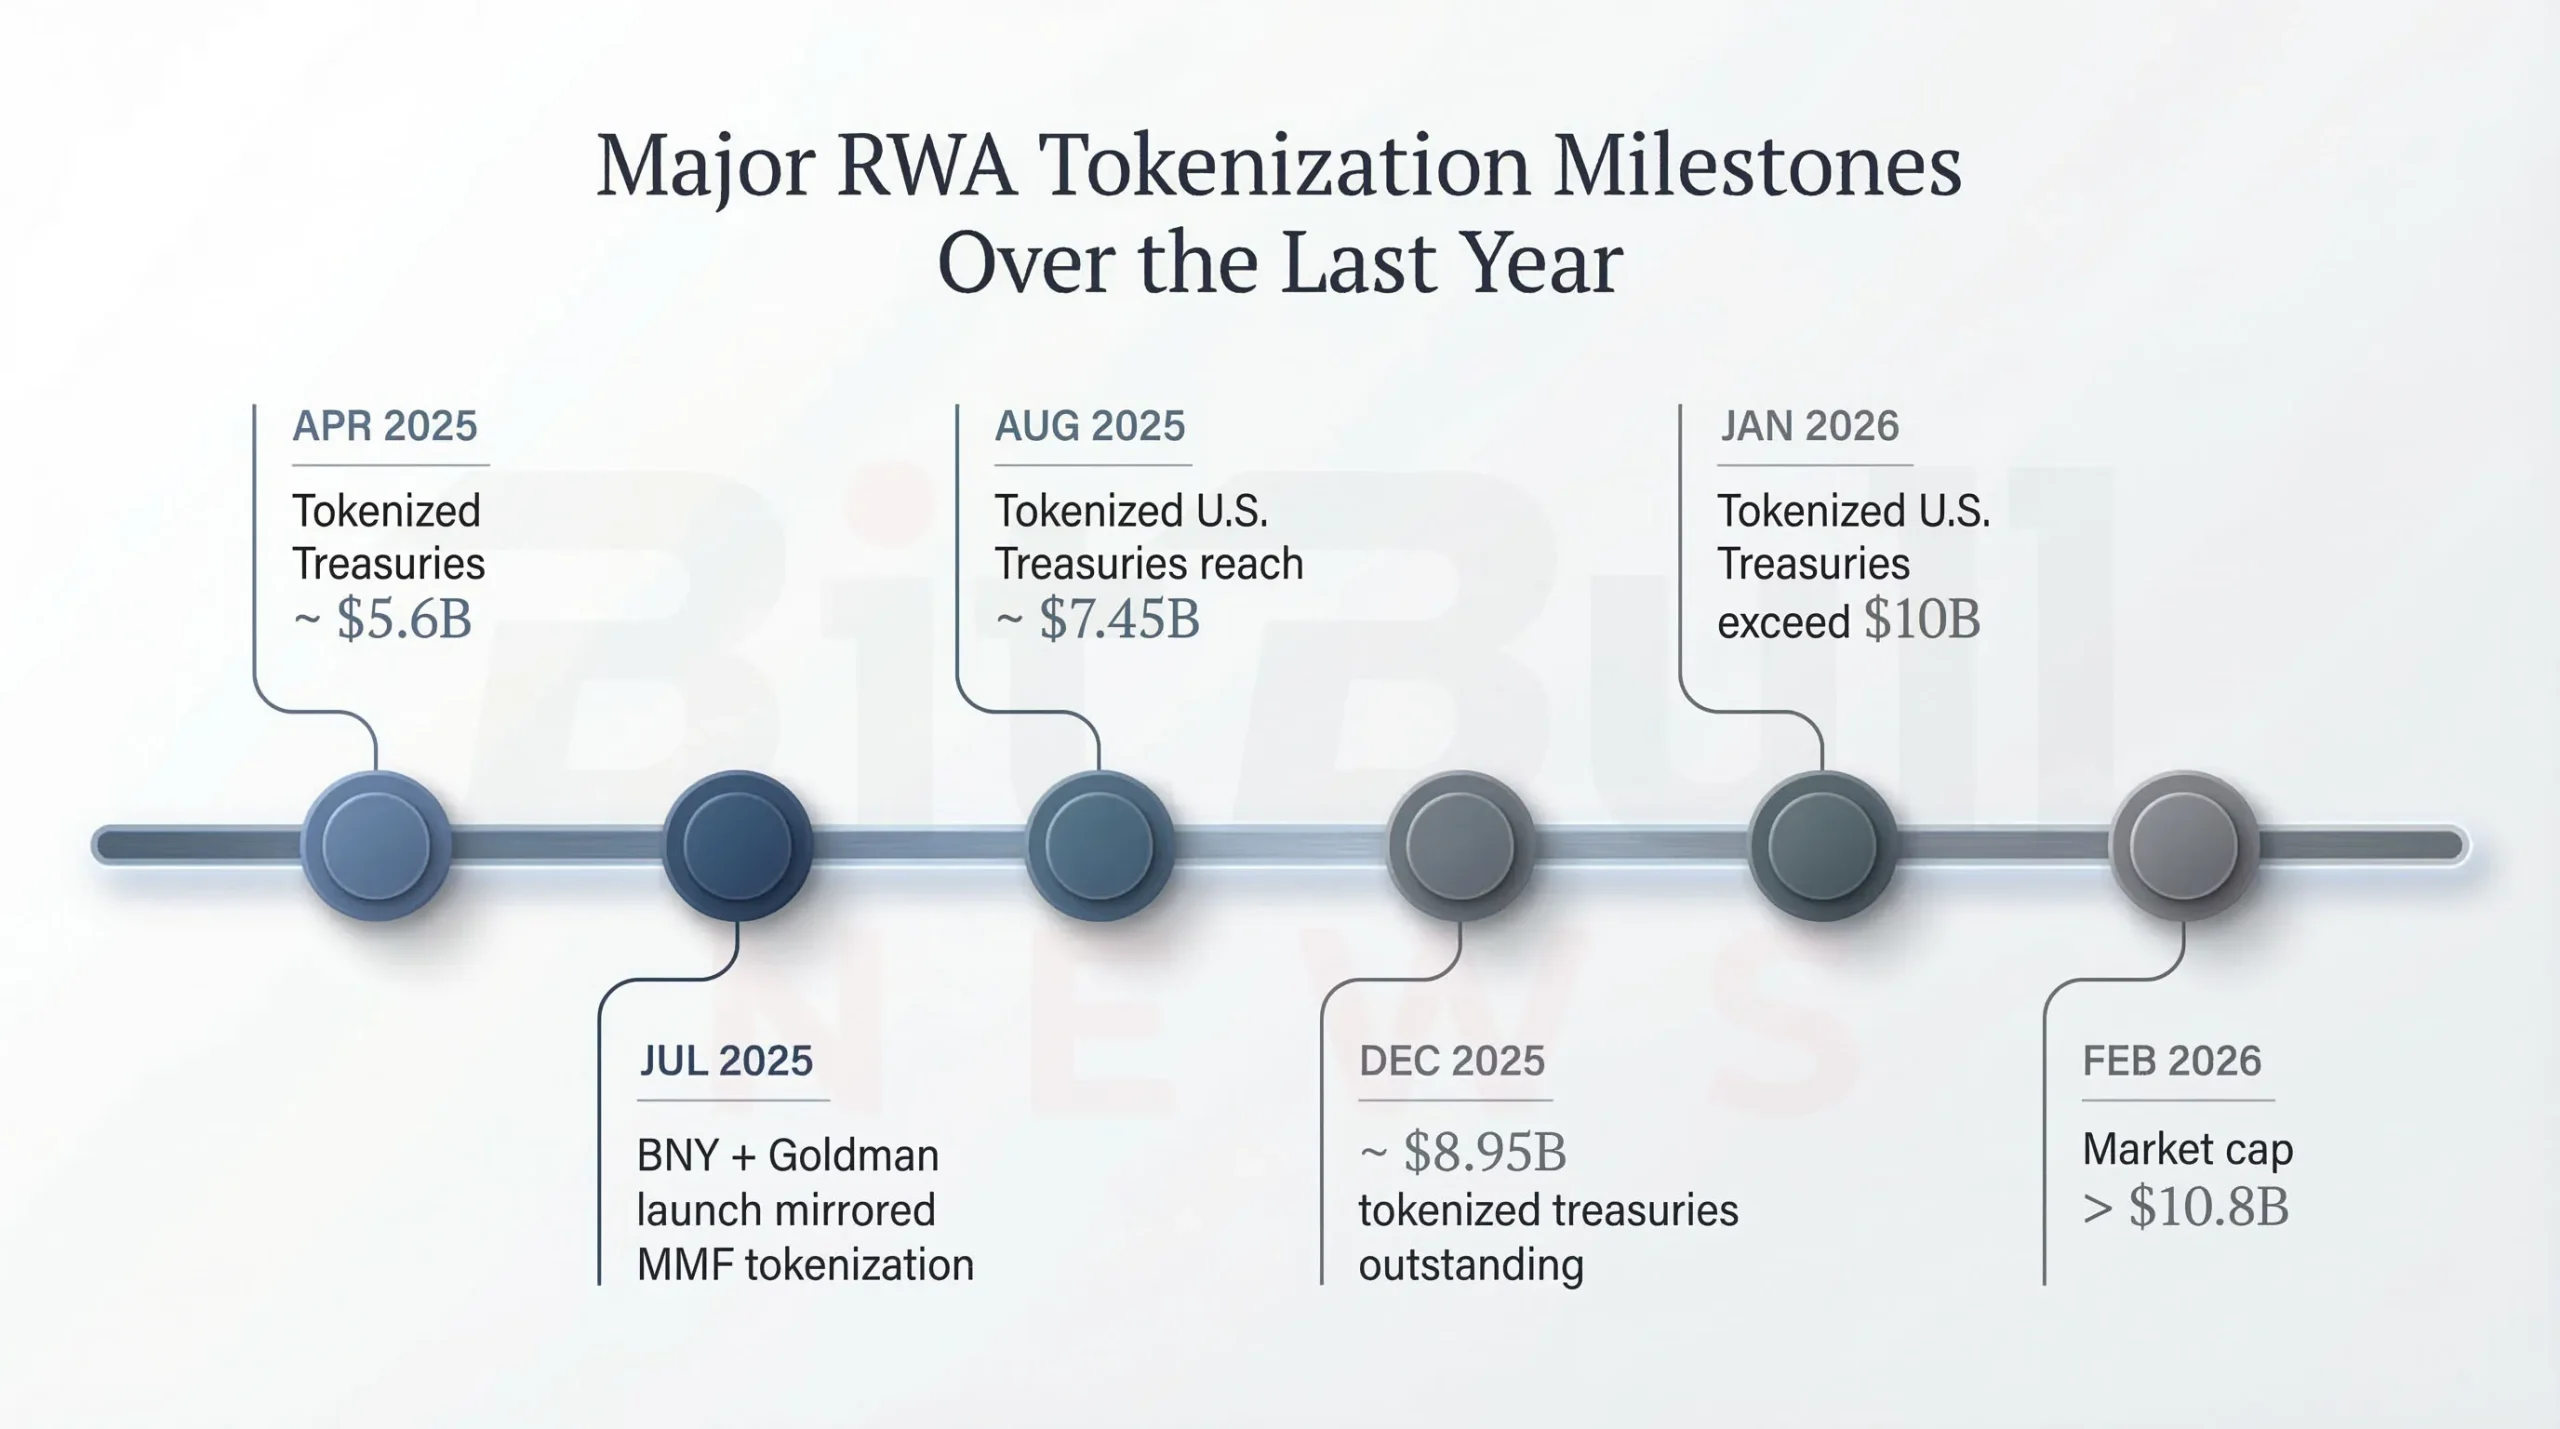
Chart 4. Major RWA milestones over the last year, from the April 2025 treasury-market base to the January and February 2026 milestones above $10 billion and $10.8 billion.
The milestone sequence tells a cleaner story than the hype cycle around RWAs usually does:
- April 2025: tokenized treasuries near $5.6B
- July 2025: BNY Mellon and Goldman Sachs launch mirrored MMF tokenization via GS DAP
- August 2025: tokenized U.S. treasuries reach roughly $7.45B
- December 2025: around $8.95B outstanding
- January 2026: the market exceeds $10B
- February 2026: tokenized treasury market cap moves above $10.8B
That progression supports a clear interpretation: the fastest-maturing RWA use case today is not broad-based consumer tokenization. It is institutional cash management and controlled collateral modernization, with tokenized post-trade infrastructure emerging as the next serious institutional lane
What Enables Scale, and What Still Constrains Real Liquidity
The report is especially useful when it shifts from category description to practical constraints.
What enables scaling
The main enablers are:
- legal wrappers and exemptions that make institutional distribution possible,
- regulated or semi-regulated fund structures,
- recognized custodians, administrators, auditors, and transfer agents,
- and product designs that align with treasury and collateral workflows rather than pure crypto-native speculation.
What constrains real liquidity
The dominant constraints are:
- transfer restrictions and represented designs,
- cross-chain fragmentation,
- market-infrastructure sandboxing,
- and legal uncertainty around the exact form of tokenized equities and similar instruments.
The cross-chain problem deserves special emphasis. Multi-chain issuance expands addressable reach, but it also fragments liquidity, settlement logic, compliance sets, and price discovery — a problem that increasingly looks like structural blockchain fragmentation, not just a temporary market inefficiency. The report notes research suggesting persistent price gaps and transfer frictions between chains. That means multi-chain growth is not a free upgrade. It comes with real operational and market-structure costs.
What This Means for Investors, Custodians, Banks, and Asset Managers
Investors
The main diligence question is no longer “Is the asset onchain?” It is “Which wrapper, which redemption path, and how real is the secondary activity?” Monthly transfer volume and active-address data are useful first-pass liquidity proxies, but they need to be checked against whether the activity is genuine trading or merely operational transfers. Tokenized equities, especially, require close attention to the synthetic-vs-native distinction.
Custodians
Custodians need to prepare for a two-track world: one where represented tokenization grows very large while remaining low-mobility, and another where distributed issuance grows more slowly but is more composable and operationally complex. Supporting multi-chain treasury tokens now means dealing with allowlists, transfer controls, smart-contract risk, and chain-level monitoring across multiple ecosystems.
Banks
Banks appear to be approaching tokenization primarily through collateral utility and settlement modernization rather than open DeFi distribution. The mirrored MMF initiative is a strong example of that. It keeps official records in a traditional institutional framework while using tokenization to improve operational flexibility and prepare for future collateral use. That is a very bank-like adoption path.
Asset managers
Asset managers face a distribution tradeoff: single-chain depth versus multi-chain reach. Multi-chain helps scale distribution, but it increases fragmentation and operational burden. Just as importantly, managers need to be careful in how they communicate liquidity. A represented product can be very large and still not justify marketing language that implies open 24/7 tradability.
Issuance Lifecycle
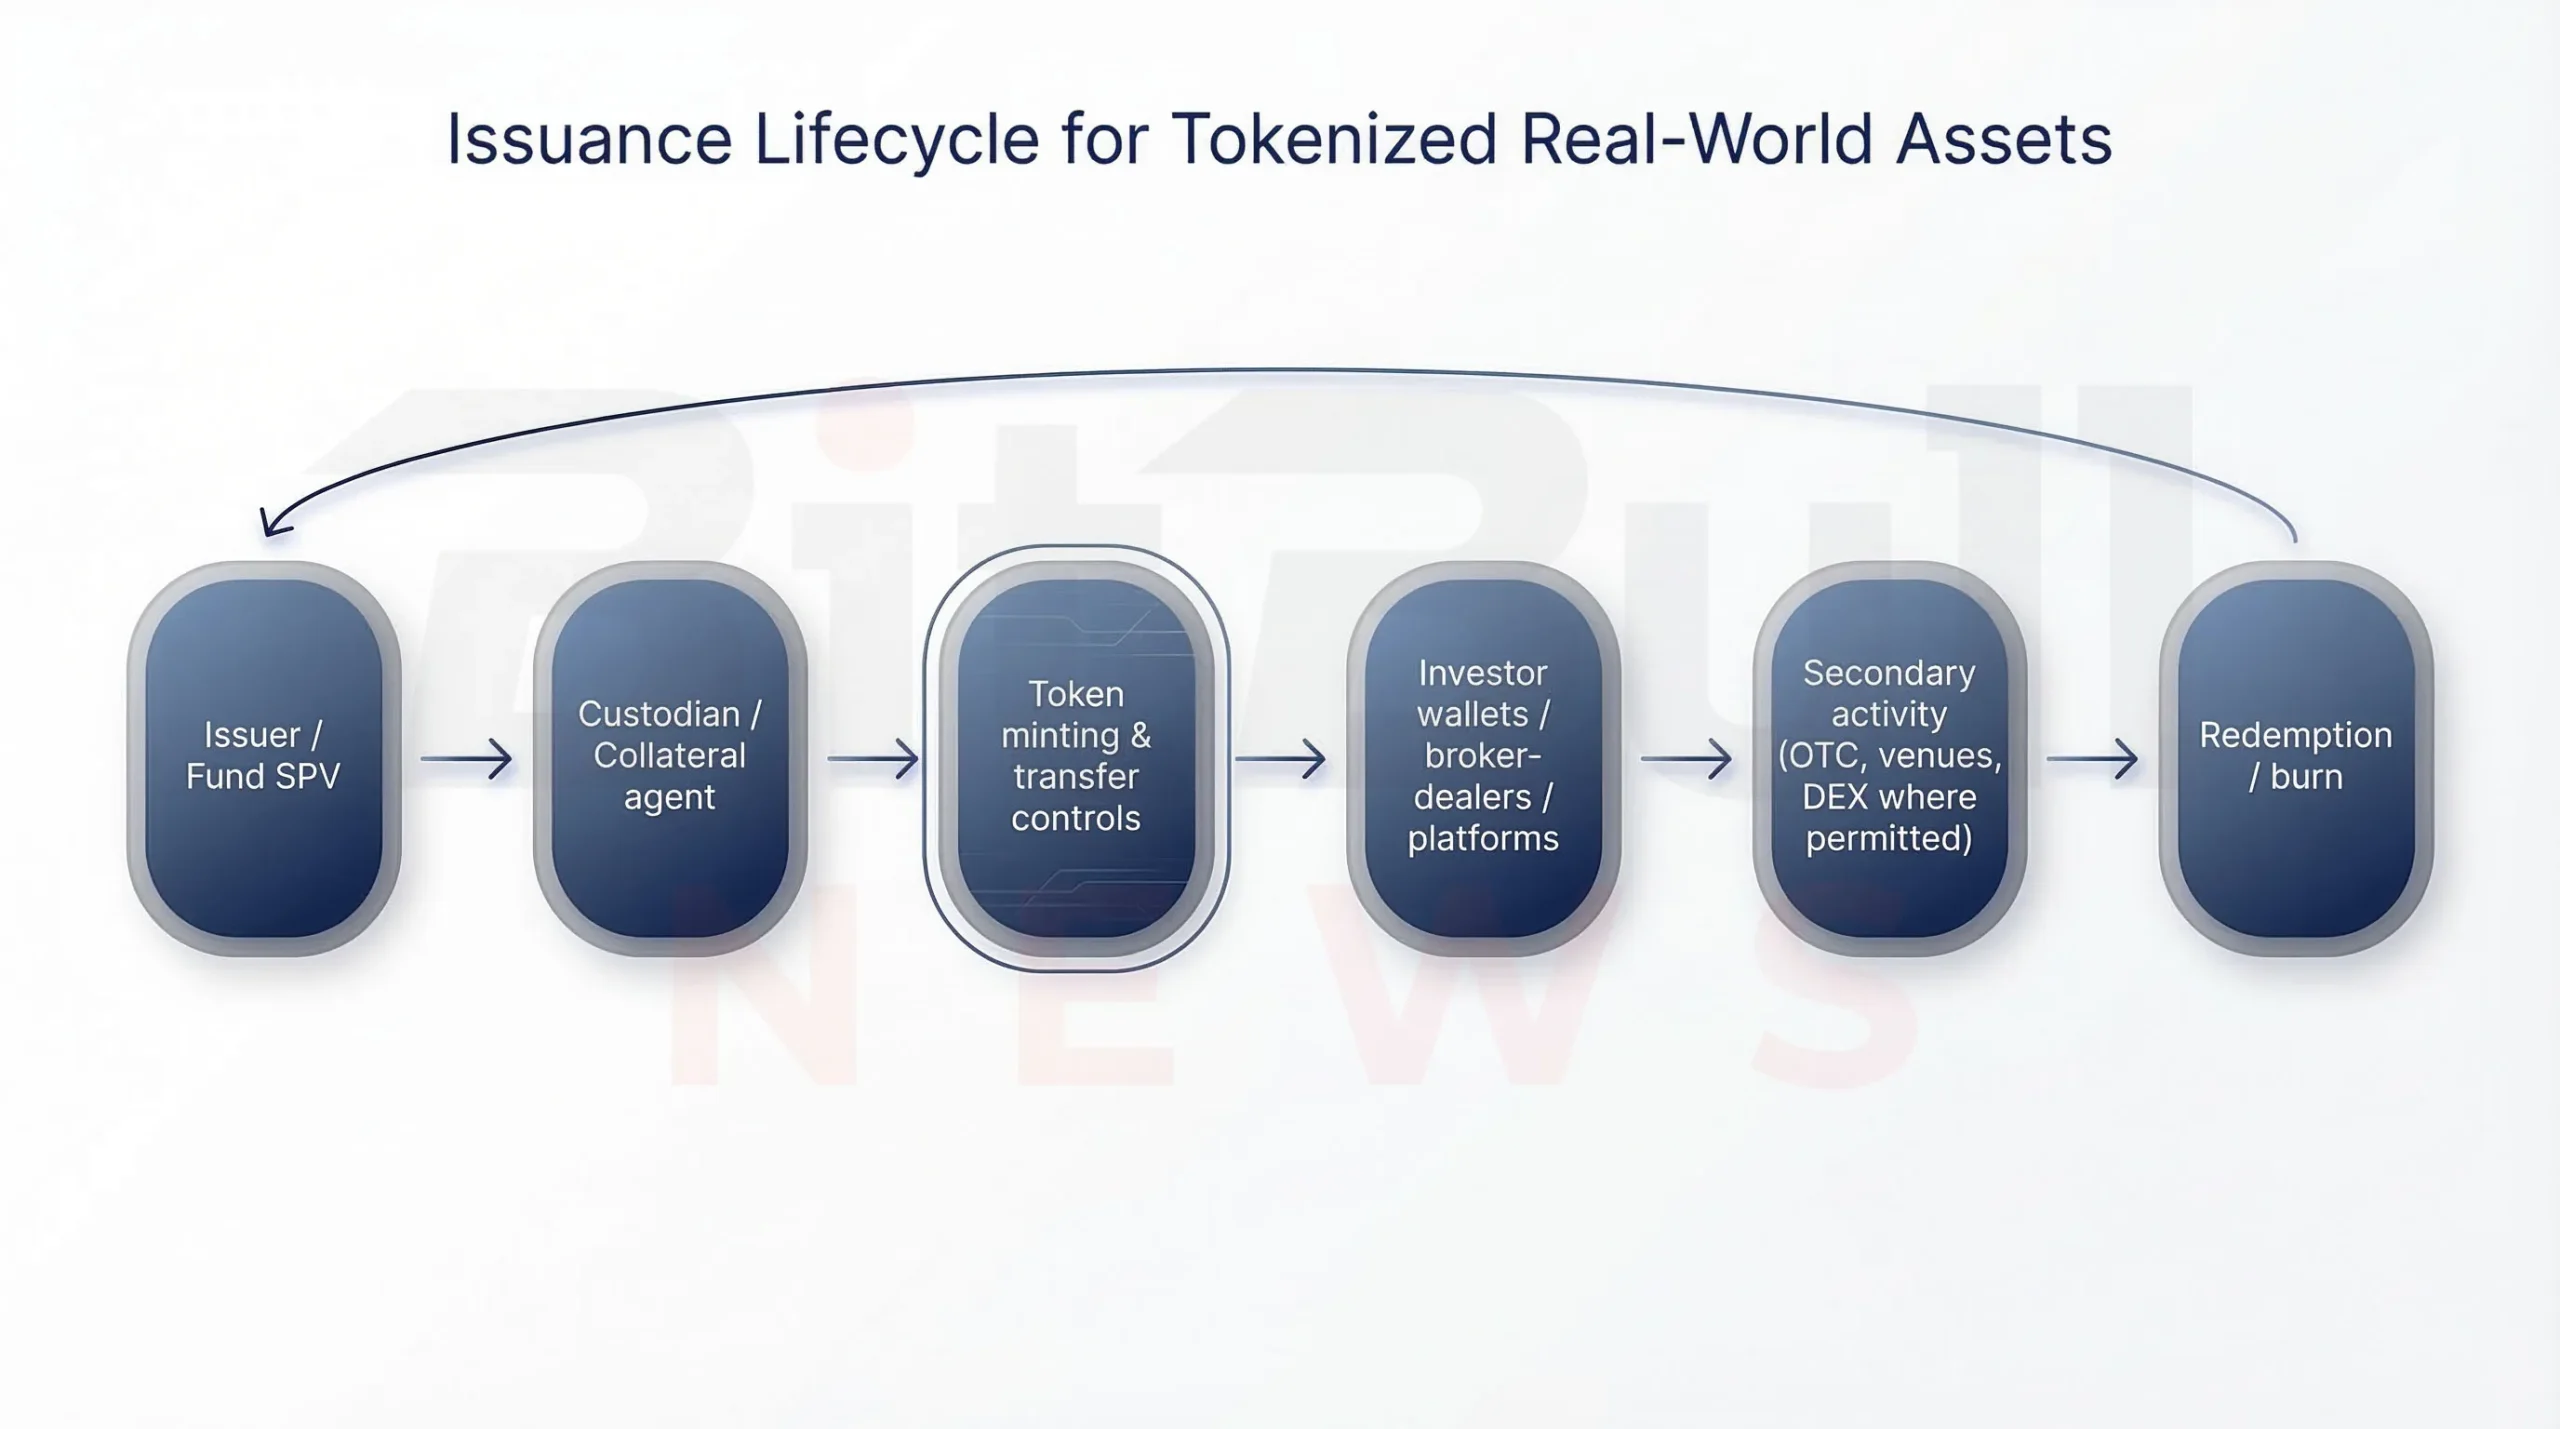
Chart 5. Issuance lifecycle for tokenized real-world assets, based on the source report’s issuer–custodian–mint–distribution–secondary–redemption loop.
The process is straightforward in diagram form but highly consequential in practice:
- Issuer / Fund SPV
- Custodian / Collateral agent
- Token minting and transfer controls
- Investor wallets, broker-dealers, and platforms
- Secondary activity
- Redemption / burn
What determines whether this cycle behaves like a real distributed asset market or collapses into a represented, platform-internal system is not just the technology. It is transferability, eligibility, legal design, and redemption mechanics.
BitBullNews View
From a BitBullNews perspective, this is one of the clearest examples of a market that is both growing fast and still widely misunderstood.
The bullish part of the story is real. Tokenized treasuries crossed the $10 billion threshold. The category now includes serious issuers, meaningful transfer activity, recognizable custodians, and regulated wrappers that institutions can actually use. Ethereum remains a credible public settlement base. Tokenized stocks show visible trading energy. The market is no longer just pilot-stage theater.
But the market is also not yet what a lot of RWA marketing implies. Most tokenized value still sits in represented structures, not freely portable instruments. Many of the most institutionally important deployments are deliberately controlled, gated, or mirrored rather than openly composable. And cross-chain expansion, while helpful for reach, still fragments liquidity and adds real operational cost.
So the right reading is neither “RWAs have already arrived” nor “this is all hype.” The right reading is:
the most successful RWA products today are the ones that solve cash management, custody, collateral, and operational settlement problems first. Open liquidity comes later, if at all.
Key Findings
- The visible market near period end was split between about $26.78B in distributed assets and about $352.40B in represented assets.
- Ethereum dominated distributed RWA value with roughly 56.9% share.
- Tokenized treasuries grew from roughly $5.6B in April 2025 to more than $10.8B by late February 2026.
- Leading treasury products included USYC, BUIDL, USDY, BENJI, WTGXX, JTRSY, USTB, CUMIU, and USTBL.
- Tokenized credit was large in total value, but much of it remained represented rather than distributed.
- Tokenized equities showed unusually high transfer activity relative to market value, but legal form varied materially.
- The biggest misconception in the sector remains confusing tokenized with liquid.
Final Verdict
Annual verdict: Strong growth, selective real liquidity
Tokenized real-world assets had a meaningful year. The category expanded, treasury products matured, and the market proved that tokenization can support serious institutional cash-management and settlement use cases. But the market also showed clear limits. The largest values are still often represented rather than fully distributed, and many of the most credible deployments remain tightly controlled by legal, eligibility, and infrastructure design.
The most accurate conclusion is this:
RWAs are scaling fastest where tokenization improves treasury, custody, and settlement workflows — not where it promises instant open-market liquidity.